Pépite | Les conséquences génétiques de la colonisation d’un milieu pollué par las métaux, des approches de génétique des populations et génétique quantitative
Texte intégral
(2) Thèse de Dima Souleman, Lille 1, 2017. Genetic consequences of colonization of a metal-polluted environment, population genetics and quantitative genetics approaches. By Dima Souleman. Submitted to the University of Lille 1 in accordance with the requirement for the degree of Doctor of Philosophy Speciality: Evolutionary Biology and Ecotoxicology Supervised by: Pr VANDENBULCKE Franck. Dr FREROT Hélène. Jury members: Dr NORET Nausicaa. Université Libre de Bruxelles. Pr BLOUIN Manuel. AgroSup Dijon. Dr FAUCON Michel-Pierre. Institut Polytechnique LaSalle Beauvais. Pr ARNAUD Jean-François. Université de Lille 1. Dr PAUWELS Maxime. Université de Lille 1. January 2017. © 2017 Tous droits réservés.. lilliad.univ-lille.fr.
(3) Thèse de Dima Souleman, Lille 1, 2017. 6 © 2017 Tous droits réservés.. lilliad.univ-lille.fr.
(4) Thèse de Dima Souleman, Lille 1, 2017. Parfois notre lumière s’éteint, puis elle est rallumée par un autre être humain. Chacun de nous doit de sincères remerciements à ceux qui ont ravivé leur flamme.. Albert Schweitzer Je dois terminer ce travail en disant un grand merci aux personnes qui ont cru en moi et qui m’ont donné la chance d’arriver au bout de cette thèse. Mais par où commencer ? par quel ordre ? c’est la décision la plus difficile, mais quand même je me lance! Je tiens tout d’abord à remercier mon directeur de thèse, Monsieur Franck Vandenbulcke, pour m’avoir accordé sa confiance et permis d’effectuer cette thèse au sein du laboratoire LGCgE. C’est à lui que je dois toute ma reconnaissance pour mon entrée dans le monde de la recherche. Ensuite, j’adresse mes vifs remerciements à ma co-directrice Hélène Frérot, et à Maxime Pauwels, qui ont pris le temps de m’aider à organiser et à rédiger cette thèse, et pour leur présence et disponibilité dans les moments difficiles. Je ne sais comment exprimer ma gratitude à ces deux personnes autrement qu’en leur promettant d’agir comme eux avec des étudiants dans ma situation. J’exprime tous mes remerciements à l’ensemble des membres de mon jury : Monsieur le Professeur BLOUIN Manuel, Monsieur le Docteur FAUCON Michel-Pierre, Jean-François ARNAUD, Nausicaa NORET. En ce qui concerne la partie bioinformatique de ce travail, je remercie Marie-joe Karam qui est devenu ma meilleure amie. Je remercie de plus le Docteur Fabien Grumiaux pour son aide à collecter et à identifier les vers de terre. J’adresse également mes remerciements aux personnes qui m’ont aidé avec les gros travaux à la serre (Angélique, Cédric, Eric, Nathalie), ainsi qu’au laboratoire (Cécile et AnneCatherine). Je remercie toutes les personnes formidables que j’ai rencontrées au LGCgE (Alain, Claude, Mathieu, Sébastien, Céline, Fabien, Sylvain). Je remercie tous les doctorant au SN3 pour la bonne ambiance de travail mais également pour les nombreux moments passés ensemble (Hanine, Léa, Coralie, Joséphine, Fabien) Je remercie également tous les doctorants au SN2. Particulièrement Hélène et Leslie pour leur aide concernant les analyses de génétique des populations, Julien pour ces dessins formidables et son humour. Je tiens à remercier Agnieszka pour ses relecture et correction de mon anglais mais également pour son amitié, elle est devenue comme une sœur pour moi.. 7 © 2017 Tous droits réservés.. lilliad.univ-lille.fr.
(5) Thèse de Dima Souleman, Lille 1, 2017. Je voudrais remercier mes amies à l’université avec qui je mange et je prends mon café chaque jour (Sabette, les nouveaux mariées Salman et Karima, Chadi, …). Mes remerciements vont également à mes amours (Nicole, Judy, Nancy, les futures mariées Naïm et Mijo, Ali, Marc, Sami) qui m’ont permis d’oublier momentanément le travail dans des soirées, repas, sorties… Je remercie mes parents et mes frères de m’avoir soutenu de loin. Enfin, Je remercie mon chéri Reda qui m’a soutenu, m’a supporté, m’a encouragé … pendant toute la durée et les moments difficiles de rédaction qui n’ont pas toujours été agréables.. 8 © 2017 Tous droits réservés.. lilliad.univ-lille.fr.
(6) Thèse de Dima Souleman, Lille 1, 2017. This thesis is dedicated to my parents. For their endless love, support and encouragement.. 9 © 2017 Tous droits réservés.. lilliad.univ-lille.fr.
(7) Thèse de Dima Souleman, Lille 1, 2017. 10 © 2017 Tous droits réservés.. lilliad.univ-lille.fr.
(8) Thèse de Dima Souleman, Lille 1, 2017. Abstract Natural habitats are more and more destructed and fragmented by urban expansion and human activities. The fragmentation of natural and agricultural areas by buildings and new infrastructures affects the size, connectivity and the quality of habitats. The populations of organisms inhabiting these anthropized territories are then more isolated. However, differentiation between populations of the same organism depends on demographic and genetic processes such as genetic drift, gene flow, mutation and natural selection. Only species that have developed special tolerance mechanisms can persist under changed environmental conditions. The introduction of contaminants such as metals in the environment may influence plants and animals evolution by modifying the evolutionary forces and thus generating differences between populations. In this work, attention was focused on the genetic consequences of metallic pollution on two species, the earthworm Lumbricus terrestris and the plant model Arabidopsis halleri. Two different approaches have been used to study the genetic response to metallic contamination: a population genetic approach was performed in L. terrestris and a quantitative genetic approach was carried on in A. halleri. First, it was a question of identifying and validating new microsatellite markers in L. terrestris. These markers were then used to characterize the neutral genetic diversity in worms collected from agricultural and urban sites. Secondly, genetic architecture of Zn tolerance and Zn hyperaccumulation was conducted investigated for the first time using an intraspecific crossing between metallicolous and non-metallicolous individuals of A. halleri. High density of SNP markers was used to proceed to the QTL mapping step.. 1 © 2017 Tous droits réservés.. lilliad.univ-lille.fr.
(9) Thèse de Dima Souleman, Lille 1, 2017. Résumé Les habitats naturels sont de plus en plus détruits et fragmentés par l'expansion urbaine et les activités humaines. La fragmentation des espaces naturels et agricoles par les bâtiments et les nouvelles infrastructures affecte la taille, la connectivité et la qualité des habitats. Les populations d’organismes vivants sur ces territoires anthropisés sont alors plus isolées. Or, la différenciation entre populations d’un même organisme dépend de processus démographiques et génétiques tels que la dérive génétique, le flux génétique, la mutation et la sélection naturelle. La persistance et le développement des populations dans des conditions environnementales modifiées dépendent de mécanismes de tolérance. Dans ce contexte, l'introduction de contaminants tels que des métaux dans l'environnement peut influencer l'évolution des plantes et des animaux en modifiant les forces évolutives et en créant des différences entre populations. Dans ce travail, l’attention a été portée sur les conséquences génétiques de la pollution métallique sur deux espèces, le ver de terre Lumbricus terrestris et une plante modèle Arabidopsis halleri. Deux approches différentes ont été utilisées pour étudier la réponse génétique à la contamination métallique : une approche de génétique des populations chez L. terrestris et une approche de génétique quantitative chez A. halleri. Tout d’abord, il s’est agi d’identifier et de valider de nouveaux marqueurs microsatellites chez L. terrestris. Ensuite, ces marqueurs ont été utilisés afin de caractériser la diversité génétique neutre chez des vers collectés sur des sites agricoles et urbanisés. Parallèlement, l'architecture génétique de la tolérance et de l'hyperaccumulation de Zn chez A. halleri a été explorée à l’aide d’un croisement intraspécifique entre une population métallicole et une population non métallicole. Une densité élevée de marqueurs SNP a été utilisée pour procéder à l'étape de cartographie QTL.. 2 © 2017 Tous droits réservés.. lilliad.univ-lille.fr.
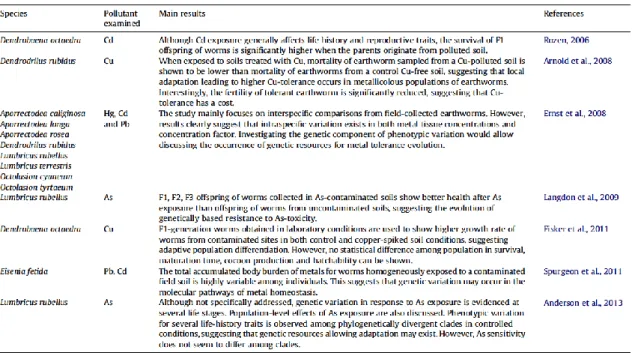
(10) Thèse de Dima Souleman, Lille 1, 2017. Table of contents Chapter I ................................................................................................................................... 7 General Introduction ............................................................................................................... 7 1. Anthropogenic landscape and the consequences on biodiversity .................................. 9. 2 Evolutionary ecotoxicology ............................................................................................. 11 2.1 Background ..................................................................................................................... 11 2.2 Adaptation ....................................................................................................................... 11 2.3 How to study local adaptation in polluted habitats ......................................................... 14 3 Population genetics in anthropogenic landscape .......................................................... 16 3.1 Evolutionary forces ......................................................................................................... 16 3.1.1 Mutation.................................................................................................................... 17 3.1.2 Migration .................................................................................................................. 18 3.1.3 Genetic drift .............................................................................................................. 19 3.1.4 Natural selection....................................................................................................... 20 3.2 Local Adaptation to anthropogenic habitats ................................................................... 22 4 Genetic basis of a quantitative trait ............................................................................... 24 4.1 Generalities ..................................................................................................................... 24 4.2 Genetic architecture for adaptive traits ........................................................................... 25 5 Case study: adaptation to metals .................................................................................... 27 5.1 Metals in the environment............................................................................................... 27 5.2 Adaptation to metals ....................................................................................................... 29 5.2.1 Metals tolerance and hyperaccumulation in plants ................................................. 29 5.2.2 Metals tolerance and hyperaccumulation in soil macro-invertebrate (Earthworms annélides, oligochètes) ......................................................................................................... 33 6 Thesis objectives and studied models ............................................................................. 34 6.1 Population genetics of Lumbricus terrestris ................................................................... 34 6.1.1 Biology of Lumbricus terrestris ................................................................................ 34 6.1.2 Geographical distribution of L. terrestris ................................................................ 35 6.1.3 Approach .................................................................................................................. 36 6.2 Genetic architecture of Zn tolerance and Zn accumulation in Arabidopsis halleri ........ 37 6.2.1 Biology and geographical distribution of A. halleri................................................. 37 6.2.2 Approach .................................................................................................................. 38 7. Thesis objective: ............................................................................................................... 40. Chapter II ............................................................................................................................... 43 Using biomarkers in an evolutionary context: lessons from the analysis of biological responses of oligochaete annelids to metal exposure .......................................................... 43 1 The concept of biomarker in ecotoxicology: definition and limits .............................. 48 1.1 Fundamental approaches ................................................................................................. 49 1.2 Applied ecotoxicology .................................................................................................... 50 2. Biological response of earthworms to MTEs exposure in controlled conditions ....... 51. 3 Interpreting the biological response of field-collected earthworms from sentinel species to MTE pollution ....................................................................................................... 53 3 © 2017 Tous droits réservés.. lilliad.univ-lille.fr.
(11) Thèse de Dima Souleman, Lille 1, 2017. 3.1 Reduced fitness of earthworms under metal exposure .................................................... 58 4. Biological responses of field collected earthworms at the transcriptome level .......... 60. 5. Conclusion: Integrating adaptation into the biomarker concept ................................ 61. Chapter III .............................................................................................................................. 63 Isolation and characterization of eight polymorphic microsatellite markers for the earthworm Lumbricus terrestris ............................................................................................ 63 1. Introduction ...................................................................................................................... 68. 2 Materials and Methods .................................................................................................... 69 2.1 Sampling ......................................................................................................................... 69 2.2 DNA extraction ............................................................................................................... 70 2.3 COI barcoding and analysis ............................................................................................ 70 2.4 Microsatellite library ....................................................................................................... 70 2.5 Microsatellite amplification ............................................................................................ 71 2.6 Microsatellite Data analysis ............................................................................................ 72 3. Results and Discussion..................................................................................................... 74. Chapter IV .............................................................................................................................. 77 Population genetics of the earthworm Lumbricus terrestris in disturbed habitats using microsatellite markers ........................................................................................................... 77 Population genetics of the earthworm Lumbricus terrestris in disturbed habitats using microsatellite markers ........................................................................................................... 81 1. Introduction ...................................................................................................................... 83. 2 Materials and methods .................................................................................................... 85 2.1 Sampling and DNA extraction ........................................................................................ 85 2.2 COI sequencing ............................................................................................................... 87 2.3 COI sequences analysis ................................................................................................... 87 2.4 Microsatellite Genotyping............................................................................................... 87 2.5 Genetic analysis of microsatellites data .......................................................................... 88 2.5.1 Genetic diversity analysis ......................................................................................... 88 2.5.2 Bayesian clustering................................................................................................... 88 2.5.3 Population genetic structure .................................................................................... 89 3 Results ............................................................................................................................... 90 3.1 COI sequences diversity.................................................................................................. 90 3.2 Genetic diversity per locus and per location ................................................................... 90 3.3 Bayesian clustering ......................................................................................................... 92 3.4 Levels of genetic differentiation ..................................................................................... 95 3.5 Spatial genetic structure .................................................................................................. 95 4 Discussion ......................................................................................................................... 97 4.1 A hierarchical structure of genetic diversity ................................................................... 98 4.2 Determinants of genetic structure at the regional scale .................................................. 99 4.3 Determinant of genetic structure at the local scale ....................................................... 100. 4 © 2017 Tous droits réservés.. lilliad.univ-lille.fr.
(12) Thèse de Dima Souleman, Lille 1, 2017. Chapter V ............................................................................................................................. 103 Genetic architecture of local adaptation to anthropogenic habitat: evidence from an F2 progeny from an inter-ecotypic cross in Arabidopsis halleri ............................................ 103 1. Introduction .................................................................................................................... 108. 2 Materials and methods .................................................................................................. 110 2.1 Sampling sites ............................................................................................................... 110 2.2 Plant material and crossing program ............................................................................. 112 2.3 Assessment of Zn tolerance .......................................................................................... 112 2.4 Assessment of Zn hyperaccumulation .......................................................................... 114 2.5 High throughput sequencing and reads processing ....................................................... 115 2.6 SNP and genotype calling ............................................................................................. 115 2.7 Assessing Mendelian violations .................................................................................... 116 2.8 SNP filtering ................................................................................................................. 116 2.9 SNP genotyping ............................................................................................................ 118 2.10 Construction of the genetic map ................................................................................. 118 2.11 Shered synteny of A. halleri genomic sequences with A. lyrata and A. thaliana ....... 119 2.12 QTL mapping and annotation ..................................................................................... 119 3 Results ............................................................................................................................. 120 3.1 Segregating and heritability of the traits ....................................................................... 120 3.2 From reads to SNPs....................................................................................................... 126 3.3 Genetic Map .................................................................................................................. 128 3.4 QTL detection and annotation of the QTL region ........................................................ 129 4 Discussion ....................................................................................................................... 132 4.1 Response of the intra-specific F2 progeny to Zn exposure ........................................... 132 4.2 Construction and validation of the A. halleri genetic map............................................ 134 4.3 Detection of a major QTL for Zn tolerance .................................................................. 135 4.4 Specificity of QTL at the intra-specific and local scale ................................................ 136 Chapter VI ............................................................................................................................ 139 General discussion and perspectives .................................................................................. 139 1. General discussion and perspectives ............................................................................ 140. 2. A population genetics approach to study neutral genetic diversity .......................... 141. 3 A quantitative genetics approach to study the genetic architecture of local adaptation ............................................................................................................................. 144 4. Phenotypic plasticity and local adaptation .................................................................. 146. Annexes ................................................................................................................................. 149. 5 © 2017 Tous droits réservés.. lilliad.univ-lille.fr.
(13) Thèse de Dima Souleman, Lille 1, 2017. 6 © 2017 Tous droits réservés.. lilliad.univ-lille.fr.
(14) Thèse de Dima Souleman, Lille 1, 2017. [Chapter 1] General Introduction. Chapter I General Introduction. 7 © 2017 Tous droits réservés.. lilliad.univ-lille.fr.
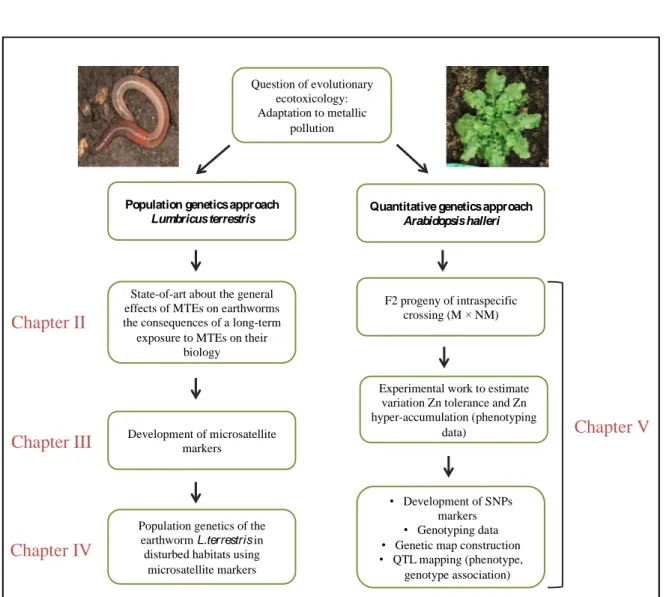
(15) Thèse de Dima Souleman, Lille 1, 2017. [Chapter 1] General Introduction. Table of contents for chapter 1 Chapter I ................................................................................................................................... 7 General Introduction ............................................................................................................... 7 2. Anthropogenic landscape and the consequences on biodiversity .................................. 9. 3 Evolutionary ecotoxicology ............................................................................................. 11 3.1 Background ..................................................................................................................... 11 3.2 Adaptation ....................................................................................................................... 11 3.3 How to study local adaptation in polluted habitats ......................................................... 14 4 Population genetics in anthropogenic landscape .......................................................... 16 4.1 Evolutionary forces ......................................................................................................... 16 4.1.1 Mutation.................................................................................................................... 17 4.1.2 Migration .................................................................................................................. 18 4.1.3 Genetic drift .............................................................................................................. 19 4.1.4 Natural selection....................................................................................................... 20 4.2 Local Adaptation to anthropogenic habitats ................................................................... 22 5 Genetic basis of a quantitative trait ............................................................................... 24 5.1 Generalities ..................................................................................................................... 24 5.2 Genetic architecture for adaptive traits ........................................................................... 25 6 Case study: adaptation to metals .................................................................................... 27 6.1 Metals in the environment............................................................................................... 27 6.2 Adaptation to metals ....................................................................................................... 29 6.2.1 Metals tolerance and hyperaccumulation in plants ................................................. 29 6.2.2 Metals tolerance and hyperaccumulation in soil macro-invertebrate (Earthworms annélides, oligochètes) ......................................................................................................... 33 7 Thesis objectives and studied models ............................................................................. 34 7.1 Population genetics of Lumbricus terrestris ................................................................... 34 7.1.1 Biology of Lumbricus terrestris ................................................................................ 34 7.1.2 Geographical distribution of L. terrestris ................................................................. 35 7.1.3 Approach .................................................................................................................. 36 7.2 Genetic architecture of Zn tolerance and Zn accumulation in Arabidopsis halleri ........ 37 7.2.1 Biology and geographical distribution of A. halleri................................................. 37 7.2.2 Approach .................................................................................................................. 38 8. Thesis objective: ............................................................................................................... 40. 8 © 2017 Tous droits réservés.. lilliad.univ-lille.fr.
(16) Thèse de Dima Souleman, Lille 1, 2017. [Chapter 1] General Introduction. 1. Anthropogenic landscape and the consequences on biodiversity. Anthropogenic activities that have increased with the expansion of cities and the industrial revolution are widely implicated in environmental changes. These changes are gathered under the term “Global Change”. Drivers of Global Change are for example the production and the introduction of contaminants (pesticides, fertilizers, petroleum, metals…) in nature, the overexploitation of resources and the change of land use. About half of the land cover of the planet was subject to land use changes (Vitousek et al., 1997), which consist primarily in transformation of natural habitats into agricultural or urban areas. It is predicted that the total urban area will triple between 2000 and 2030 in accordance with the explosion of human populations and their growing consumption rates of raw materials (McDonnell & Hahs, 2015). Generally land use and the other anthropogenic activities favour fine-scale changes in environmental features, and thus increase spatial environmental heterogeneity, which leads to the transformation of large homogeneous habitat into small habitat fragments isolated from each other. The fragmentation and loss of natural habitats include their replacement by either other habitats or urban structures (buildings, roads, etc.). Ecosystems will be impacted through the destruction, modification and fragmentation of habitat, degradation of the quality of soil, air and water, exploitation of native species and introduction of exotic species. These modifications can affect locally or globally the biodiversity and can lead to the extinction or decline of species (Figure 1). The term of biodiversity means all living species and the communities formed by them in the different types of ecosystems (marine, terrestrial and aquatic). Each ecosystem is based on complex relationships between biotic and abiotic components. The ecological importance of biodiversity is reflected by the mutuality between different species, providing essential services to life, such as production of oxygen and fixing of air carbon dioxide, filtration and purification of water, pollinate plants, waste decomposition and transfer of nutrients in food chains. Biodiversity is therefore a central element to consider in the context of Global Change effect on ecosystems.. 9 © 2017 Tous droits réservés.. lilliad.univ-lille.fr.
(17) Thèse de Dima Souleman, Lille 1, 2017. [Chapter 1] General Introduction. Anthropogenic activities: Pollution Land use Overexploitation. Effects on natural habitats. Habitats loss Habitats fragmentation Changes in Habitats quality. Effects on biodiversity. Ecosystems. Species richness. Species. Populations. Abundance. Genetic diversity/ divergence. Indi viduals. Extinction Migration Adaptation. Figure 1 : Anthropogenic activities and their consequences on biodiversity. Consequences of habitat fragmentation are particularly well documented. At the ecosystem level, species richness within habitats is expected to decrease with the reduction of habitat surface (Krauss et al., 2010). About 40% of species could be lost around the world because of habitat destruction and fragmentation (Seto et al., 2012). For example, 85% of bird species and 86% of mammals are threatened because of their habitats destruction (Baillie et al., 2004). Indeed, a lower number of species in patches of small area has been shown in several studies including plants (Cagnolo et al., 2006), insect parasitoids (Kruess & Tscharntke, 2000), reptiles and mammals (Findlay & Houlahan, 1997). In fact, habitat fragmentation generally results in population fragmentation: ancestral populations are divided in a set of smaller populations separated by unsuitable environments that may act as a barrier to the movement of the individuals and thus limit migration events among populations (Fahrig, 2003). Thus, habitat fragmentation must affect the abundance of local populations (Wilcox & Murphy, 1985). Some studies were conducted to test the effect of fragmentation and isolation in shaping species abundance, for example: (Virgós, 2001) shows that the abundance of 10 © 2017 Tous droits réservés.. lilliad.univ-lille.fr.
(18) Thèse de Dima Souleman, Lille 1, 2017. [Chapter 1] General Introduction. badger populations (Meles meles) decreases with the diminution of the percentage of forest cover. At the genetic level, population fragmentation is expected to affect the distribution of genetic diversity among populations. Fragmented populations are expected to show lower genetic diversity (within populations) and higher genetic differentiation (among populations) (Templeton et al., 1990; Young et al., 1999). Among environmental changes due to anthropogenic activities, decrease of habitat quality due to pollution is a main source of environmental heterogeneity - i.e. spatial and temporal variations of the environment – and stress for living organisms. However, the consequences of pollution on biodiversity have been little documented so far. Therefore, the main interest of this thesis is the evolutionary effects of pollutant in anthropogenic environment.. 2. Evolutionary ecotoxicology. 2.1. Background. In the context of Global Change, ecosystems are frequently and locally impacted by toxic substances (ex. pesticides, metals, polycyclic aromatic hydrocarbons). Evolutionary ecotoxicology is a discipline studying the genetic and evolutionary processes underlying organisms’ reactions in response to environmental toxicants. The main goal of this discipline is to outperform the traditional parameters such as the toxicants effects at the molecular, cellular or physiological levels on individuals, species or populations by understanding the genetic basis of organisms’ response to the toxicants exposure and their evolutionary impact. 2.2. Adaptation. The ways organisms can face drastic and rapid environmental changes that result from anthropogenic activities are: -. Extinction (global of local populations).. -. Permanence through migration to a place with more favourable environmental conditions.. -. Permanence through adaptation to the new environmental conditions.. Migration to the most suitable environments depends on organism’s capacity to move and to cross the barriers between habitats. However, populations might also have locally survived to habitat loss or modification through genetic adaptation to the new environmental conditions (Aitken et al., 2008). The impact of abiotic and biotic environmental changes on the reactions 11 © 2017 Tous droits réservés.. lilliad.univ-lille.fr.
(19) Thèse de Dima Souleman, Lille 1, 2017. [Chapter 1] General Introduction. and adaptations of plants and animals has always been a central issue in evolutionary biology (Møller & Nielsen, 2010). Many definitions were proposed for the word “adaptation” depending on the discipline of study (Futuyma, 1998). Adaptation for physiologists indicates the capacity of individuals to adjust their phenotype to cope with their environment. In this context, the word “adaptation” may be a source of confusion since observed changes are due to the capacity of organisms to modify their physiology or morphology in response to environmental changes. These modifications do not require genetic changes and we will prefer the terms “acclimation” or “phenotypic plasticity”. In evolutionary biology, adaptation corresponds to the selection of favourable phenotypes conferring features allowing reproductive and survival success (i.e. adaptive trait) but requires genetic change. For biodiversity rescue, it is important to understand how organisms can adapt to their modified environmental conditions and the mechanisms underlying this adaptation. In this document, I will use the word “adaptation” in the sense of “genetic changes leading to a higer fitness (i.e. the ability of an individual to reproduce and give descendants) in the new environment”. Adaptation is the result of natural selection (see the definition in the section of evolutionary forces section 3.1.4) that increases the frequency of the most favourable genotypes that have higher fitness (or selective value) in the modified environment (Hendry et al., 2011). In anthropogenic environments, genetic adaptation is a process that requires prolonged and repeated exposure to stress (ex: contaminants) over several generations, which increases the magnitude of selection pressure and thus imposes a quick adaptation of organisms to persist. It can nevertheless be established quickly, in a few years and in a few generations, as observed (Klerks & Levinton, 1989) for a natural population of Limnodrilus hoffmeisteri (oligochaete) which has developed a genetic adaptation to a metal contamination 30 years after establishing pollution. Moreover, adaptation to altered environment is faster in organisms having a short generation time that can be measured by days, months or few years such as microorganisms and insects. However, the probability of adaptation is lower in the organisms with long generation time (ten or hundred years) such as large mammals and trees (McDonnell & Hahs, 2015). Numerous studies revealed the selective effects of pollutants and cases of tolerance were documented, for example: tolerance to metals (Morgan et al., 2007; Bourret et al., 2008; Lévêque et al., 2015) or pesticides (Brausch & Smith, 2009; Pelosi et al., 2013) in natural populations exposed to frequent or chronic industrial sources of pollutants or agrochemicals. 12 © 2017 Tous droits réservés.. lilliad.univ-lille.fr.
(20) Thèse de Dima Souleman, Lille 1, 2017. [Chapter 1] General Introduction. Tolerance is defined as heritable changes in a population, which confer a better ability to survive and reproduce in an environmental condition which was previously lethal for the species to which this population belongs (Antonovics et al., 1971). The contaminant acts as a selective force on the population by reducing the contribution of susceptible genotypes in the next generation by reducing their survival or reproduction (Klerks, 2002; Millward & Klerks, 2002). Thus, tolerant individuals will contribute more to the next generations (Dallinger & Höckner, 2013). Genetic adaptation to contamination results in a change of allele frequencies within the adapted population (Klerks, 2002). This is a microevolutionary process (Ribeiro & Lopes, 2013), since micro-evolution had been defined by Kinnison & Hendry (2001) as the evolution within and between populations. Furthermore, two types of tolerant individuals can be selected: (1) individuals who are constitutively tolerant to pollutants, meaning that genetic mechanisms were already present before environmental pollution, and / or (2) individuals who can develop instantly and effectively defense systems against pollutants. To be selected, the latter mechanism should have genetic bases and be present in high frequency in the population adapted to the environmental pollution (Posthuma & Van Straalen, 1993). The development of tolerance resulting from the selective effect of contaminant may affect other traits, due to genetic correlation between these traits and the trait corresponding to selection (Sgrò & Hoffmann, 2004). These effects may occur because of linkage disequilibrium between genes that control different traits or pleiotropic effects. In particular, selective effect of a contaminant can provide better tolerance toward other contaminants. This is called co-tolerance (Brausch & Smith, 2009) that may due to shared mechanisms of detoxification, such as the increased production of metallothionein in response to cadmium and copper (Morgan et al., 2007). Local adaptation is a special case of adaptation for evolutionary biology, which focuses on populations’ evolution at a local scale. Local adaptation requires the action of spatially heterogeneous selective pressures that are sufficiently strong and long lasting. When populations are found in different (biotic or abiotic) environments, these environments will exert different selection pressures on different populations, then each population may evolve toward optimal local adaptation. Consequently, those populations will be differentiated owing to their different environment. In anthropogenic environments, the establishment of local adaptation depends on several factors including: 1) differentiation in survival and reproduction success among individuals (selective value for a genotype) across many 13 © 2017 Tous droits réservés.. lilliad.univ-lille.fr.
(21) Thèse de Dima Souleman, Lille 1, 2017. [Chapter 1] General Introduction. generations 2) when genetic polymorphisms exists, it provokes changes in allelic or genotype frequencies in population that are under selection pressure compared to geographically closed ones. In a spatial heterogeneous environment, the spatial variation of natural selection pressures led to changes in the structure of genetic diversity of populations connected by genes flow (Kawecki & Ebert, 2004). Local adaptation in the strict sense implies the existence of genotype × environment interaction, i.e. alleles and genes have different effects on the fitness of individuals in different environments. Moreover, individuals have a better selective value in their local environment than immigrants (Figure 2) (Kawecki & Ebert, 2004). Local adaptation is necessary for species to react to changing environments. Nevertheless, this mechanism also plays essential role in species divergence, which leads to the development of new species. All those reasons make the study of local adaptation interesting for evolutionary biology. The concept of local adaptation can be studied through population genetics, describing the evolutionary forces acting on genetic diversity, or using quantitative genetic approaches, investigating the genetic determinism of quantitative traits linked to fitness. 2.3. How to study local adaptation in polluted habitats. The same approaches are currently used for the study of local adaptation and the evolutionary issue in ecotoxicology (Coutellec & Barata, 2011) such as: 1) Population and landscape genetics: is a discipline studying how alleles and genotypes frequency have changed between and within populations. Landscape genetics is an emerging discipline at the interface between landscape ecology, population genetic and the spatial statistics (Storfer et al., 2006). Its objective is to describe and analyze the influence of landscape structures and environmental factors on the spatial structure of genetic variability of populations (Manel et al., 2003; Storfer et al., 2006; Holderegger & Wagner, 2008). The main interest of landscape genetics is to understand the interactions between landscape structures and micro-evolutionary processes such as gene flow, genetic drift or selection. 2) Quantitative genetics: the phenotypic expression of quantitative traits is the result of the influence of both genotype and environmental conditions. This relationship is the basis of quantitative genetics and their application in evolutionary ecotoxicology (Klerks et al., 2011). The main goal of quantitative genetics is to explore the genetic 14 © 2017 Tous droits réservés.. lilliad.univ-lille.fr.
(22) Thèse de Dima Souleman, Lille 1, 2017. [Chapter 1] General Introduction. architecture of the quantitative traits selected in anthropogenic environment. Three approaches are available in ecotoxicology to study the variation of a quantitative trait (ex: contaminant resistance). The first approach aims at comparing the resistance levels among populations originating from polluted sites and non-polluted sites. The second approach aims at determining the relation dose-response of pollutant exposure by applying an artificial selection. The third approach analyses the genetic variation of resistance in a population, such genetic variation being important for selection to operate (Klerks et al., 2011). Genetic variation also helps estimating the heritable part of quantitative traits that can influence the evolution of adaptation.. (I ). (I I ) Genotype a. Genotype b. Genotype b. Fitness. Fitness. Genotype a. Env A. Env B. Env A. Environment. Env B Environment. (I V). (I I I ) Genotype a. Genotype a. Genotype b. Fitness. Fitness. Genotype b. Env A. Env B Environment. Env A. Env B Environment. Figure 2 : Genotype and environment interaction (GEI). Four possible reaction norms are provided, the red line indicate the genotype a while the green line indicate the genotype b. in (I) the genotype b has higher fitness than genotype a in all environments, no (GEI). In (II) both genotypes have the same fitness values in the environment A and have an increased fitness in environment B, but the genotype b shows higher fitness in the environment B. In (III) genotype A shows better fitness in environment A, while both genotypes have the same fitness values in the environment B. In (IV) the reaction norms cross, the genotype a shows better fitness in environment A and the genotype b shows higher fitness in environment B (local adaptation). The three last cases of reaction norms (II, III, IV) suggest a (GEI).. 15 © 2017 Tous droits réservés.. lilliad.univ-lille.fr.
(23) Thèse de Dima Souleman, Lille 1, 2017. [Chapter 1] General Introduction. 3 3.1. Population genetics in anthropogenic landscape Evolutionary forces. It is well known that landscape fragmentation affects the size, connectivity and the quality of habitat. It tends to generate small populations, genetically isolated and characterized by low genetic diversity. In other words, landscape fragmentation can have rapid evolutionary consequences (Hoffmann & Hercus, 2000). In theory, species are expected to disappear wherever environmental conditions became unsuitable and to colonize every area that might have become more suitable. Colonization success depends on the total number of introduced individuals and on both demographic (demographic and environmental stochasticity) and genetic processes (genetic drift, mutation, selection, gene flow and adaptation) (Fauvergue et al., 2012). Demographic stochasticity refers to the deviation between the observed and the expected population size estimated using growth rates such as birth rates, survival, fecundity and sex ratio. The reduction of population density is usually followed by a decrease in population growth rate, which increases the risk of extinction (Allee effect) (Allee et al., 1949). Environmental stochasticity indicates the temporal variations in the habitat conditions caused by anthropic activities and environmental events such as floods, fires and droughts. Both demographic and environmental stochasticity can increase the extinction risk in a small population because of the reduction in population growth rate (Figure 3). Changes in genetic diversity within populations and genetic differentiation among populations may result from the respective action of at least four evolutionary forces (genetic drift and inbreeding, mutation, migration, and selection) (Straalen & Timmermans, 2002) (Figure 2) which interplay with each other to change the structure of genetic diversity. In the next paragraphs, simple common definitions are given for each evolutionary force.. 16 © 2017 Tous droits réservés.. lilliad.univ-lille.fr.
(24) Thèse de Dima Souleman, Lille 1, 2017. [Chapter 1] General Introduction. Figure 3: Summary of the factors that shape genetic diversity of populations. Note that habitat fragmentation has no expected effect on mutation.. 3.1.1 Mutation The term mutation refers to any change or alteration in the genomic material. DNA in living cells is continuously exposed to different types of pressure that could lead to the appearance of mutations. Pressure can be ‘exogenous’ attacks such as radiations or genotoxic compounds or ‘endogenous’ such as DNA replication or recombination error accidents. The chromosomal mutations may be due either to a change in chromosome number, or to a change in their structure (deletion, duplication, inversion, translocation). For example, a deletion removes some parts of the genome, while the inversion mutation causes a change in the order of certain sequences in the genome. Point mutations are sequence variation at the nucleotidic level, often of a single nucleotide leading to “Single Nucleotide Polymorphism" (SNP). Finally, the length mutation corresponds to a variation of the number of repeating units of a DNA strand, as we can observe in microsatellites (SSR for "Simple Sequence Repeat"). To study the genetic diversity in populations, molecular Microsatellites (SSR Simple Sequence Repeat) and SNP (Single Nucleotide Polymorphism) are frequently used as molecular markers because they usually show high level of variation. In this thesis,. 17 © 2017 Tous droits réservés.. lilliad.univ-lille.fr.
(25) Thèse de Dima Souleman, Lille 1, 2017. [Chapter 1] General Introduction. microsatellite markers were used for population genetics study and SNPs were used for quantitative genetic part. Some mutations are neutral even when they occur in the coding region of a gene. For example, substitution of a nucleotide may occur but without any consequence of the amino acid sequence of the coded protein. This kind of mutations has no evolutionary impact because it does not influence the fitness of individuals and thus, is not a subject for selection. However, mutations in coding sequence of a protein inducing functional changes and mutations in a non-coding sequence implied in gene expression regulation or genome organization may have an evolutionary impact because they are subject to selection pressure (Wang & Malcolm, 1999). Mutations are fundamental for evolution because they are a source of genetic diversity between individuals by generating new alleles and new haplotypes (i.e. the pattern of genes and alleles located on the same chromosome that segregate together from one generation to another). Mutation rate is expected to increase in metal polluted environment (Słomka et al., 2011). 3.1.2 Migration Usually, populations from the same species are geographically isolated (i.e. they can not exchange gametes across a landscape) by distance or geographical barriers such as roads, rivers, mountains…but they can stay connected thanks to their capacity to disperse and to move through these barriers (Hamrick et al., 1993). In population genetics, the term migration refers to the exchange of genes (gene flow) due to the migration of fertile individuals or their gametes between populations. Migration tends to homogenize allele frequencies among populations. However, it can reduce the risk of inbreeding and increase genetic diversity within populations which is necessary for future adaptation (Hendry et al., 2011). Genetic studies can address the impact of fragmentation on the movements indirectly. They show that populations in fragmented landscapes are generally more genetically isolated than in unfragmented landscapes (Bergl & Vigilant, 2007; Radespiel & Bruford, 2013) (Figure 3). Increased genetic structure is partly the result of lower gene flow between populations (Coulon et al., 2004).. 18 © 2017 Tous droits réservés.. lilliad.univ-lille.fr.
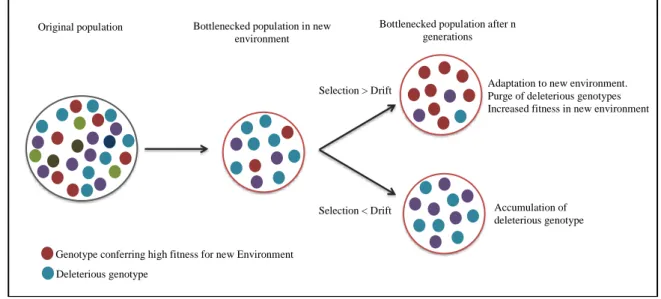
(26) Thèse de Dima Souleman, Lille 1, 2017. [Chapter 1] General Introduction. 3.1.3 Genetic drift Genetic drift is related to demographic stochasticity and refers to a random change in allele frequencies over generations in a population of finite size (Figure 4) (Wright, 1930). In fact, in a population of finite size, as a result of chance, alleles frequencies vary from one generation to another. The effect of genetic drift increases with the reduction of population size because differences of allele frequencies are expected to be more visible in the next generations. Nei et al (1975) show how bottlenecks can be accompanied by strong genetic drift and cause the reduction of genetic diversity owing to i) the loss of the rare alleles ii) the decrease of the number of alleles per locus and iv) the change of the heterozygosity rate iiii) the accumulation of deleterious alleles. Drift can lead to the elimination or the fixing of an allele in the population. The chance of fixing or removal of an allele depends on its frequency in the population. Common alleles are more likely to be fixed while rare alleles have more chance to be eliminated (except rare alleles conferring a selective advantage). Furthermore, genetic drift affects both neutral and selected alleles that are subject to selection in a population. In contrast to mutation and migration, genetic drift tends to reduce the level of genetic diversity. The loss of genetic diversity by genetic drift can be recuperated by either new mutations or by the contribution of new variation by gene flow in the absence of selection. Molecular methods that permit the estimation of genetic drift depend on the neutral genetic diversity that refers to the polymorphism in non-coding regions of the genome. These regions have a priori no impact on the fitness of individuals. Neutral markers are the most used in these studies considering that they are only affected by random genetic drift (ex: Microsatellite markers). Analysis of alleles and genotypes frequencies allow the estimation of genetic diversity indices and genetic parameter of populations such as the expected heterozygosity in the Hardy-Weinberg equilibrium, genetic diversity, allelic richness, the inbreeding coefficient (Fis), the effective population size (Ne) or the genetic population differentiation (Fst). Analysis of the genetic structure is typically based on the estimation of F Wright indices (Fst, Fit, Fis) from a decomposition of the variance in allele frequencies in inter-sample components, intra-sample inter-individual and intra-individual (Weir & Cockerham, 1984). These statistical analyses provide the possibility to detect fragmentation effects through the increased genetic differentiation among populations because of the effect. 19 © 2017 Tous droits réservés.. lilliad.univ-lille.fr.
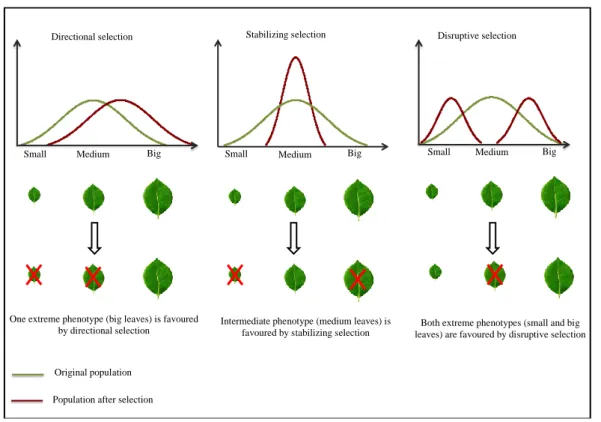
(27) Thèse de Dima Souleman, Lille 1, 2017. [Chapter 1] General Introduction. of genetic drift. Many studies documented the evolutionary impact of pollutants by increasing the effect of genetic drift (Barata et al., 2002; Medina et al., 2007).. Original population. Bottlenecked population in new environment. Bottlenecked population after n generations. Selection > Drift. Selection < Drift. Adaptation to new environment. Purge of deleterious genotypes Increased fitness in new environment. Accumulation of deleterious genotype. Genotype conferring high fitness for new Environment Deleterious genotype. Figure 4 : Summery of the impacts of evolutionary forces in small-introduced populations. Genetic drift and selection cause modification in the structure of genetic diversity of introduced populations in new environments. Two main genotypes are provided in this figure, the red confers high fitness in the new environment and the blue is a deleterious genotype in the new environment.. 3.1.4 Natural selection Natural selection was defined by Darwin (1859) as a mechanism contributing to the evolution of species. It works by sorting the individuals within a population depending on their capacity to survive and reproduce and contribute in the shaping of genetic variation among populations within species. Process of natural selection requires four elements to take place: Variation: Genetic diversity within a population is very important to ensure the maintenance of a sufficient genetic resource that allows a best response to selection (Frankham, 2003, 2005). Inheritance: traits under natural selection should be heritable i.e. able to pass on from parent to offspring. Differential survival and reproduction: Individuals possessing the best selective values will survive and contribute more to the next generation by producing larger offspring. For example: if a population have two alleles B and b for a given gene, selection may occur if there is a difference in fitness for the three possible genotypes BB, Bb, bb. 20 © 2017 Tous droits réservés.. lilliad.univ-lille.fr.
(28) Thèse de Dima Souleman, Lille 1, 2017. [Chapter 1] General Introduction. Different modes of natural selection can be distinguished (Nielsen, 2005) (Figure 5): Directional selection: it favours one extreme phenotype of continuous variation and tends to eliminate variation within populations. Directional selection can be negative (purifying) or positive. Purifying selection removes deleterious mutation. While, positive selection favours advantageous mutations. Positive selection is the most interesting for evolutionary biology because of its relation with adaptation and the evolution of novel traits and functions. Stabilizing selection: tends to increase the intermediate phenotype of a continuous variation, which will be more represented in the next generation. This selection contributes to the decrease of genetic diversity within a population when the population stabilizes on a specific phenotype. Disruptive (syn. diversifying or divergent) selection: a type of selection, which happens when two or more phenotypes are favoured. This selection tends to increase the variability within populations since it favours both extremes phenotypes.. Stabilizing selection. Directional selection. Small. Medium. Big. One extreme phenotype (big leaves) is favoured by directional selection. Small. Medium. Disruptive selection. Big. Intermediate phenotype (medium leaves) is favoured by stabilizing selection. Small. Medium. Big. Both extreme phenotypes (small and big leaves) are favoured by disruptive selection. Original population Population after selection. Figure 5: The three types of natural selection (Directional, Stabilizing, Disruptive) based on leaves size.. 21 © 2017 Tous droits réservés.. lilliad.univ-lille.fr.
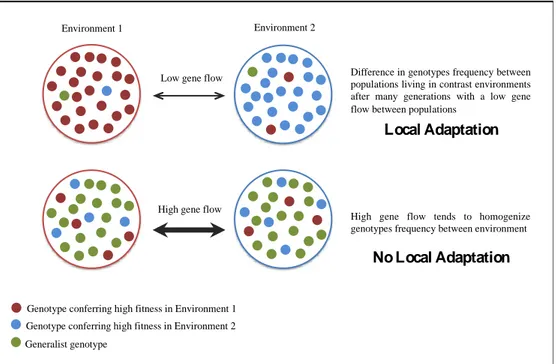
(29) Thèse de Dima Souleman, Lille 1, 2017. [Chapter 1] General Introduction. 3.2. Local Adaptation to anthropogenic habitats. Local adaptation depends on the balance among the major evolutionary forces. It depends especially on the balance between gene flow and natural selection (Yeaman & Otto, 2011; Blanquart et al., 2013). Selection tends to differentiate populations living in different environments, whereas gene flow contributes to homogenize genetic composition (allele frequencies) of populations (Sambatti & Rice, 2006; Savolainen et al., 2007). Therefore, gene flow may represent an obstacle to local adaptation. It can hinder or slow down local adaptation by preventing genetic differentiation between stressed and unstressed populations. This effect is more visible in the case of important gene flow (Figure 6). In particular cases, gene flow can be positive and enhance potential adaptation when it increases the fitness by bringing a new genetic variation more favourable for the new environmental conditions. However, gene flow can also be negative and prevent adaptation when it decreases fitness by bringing individuals with low fitness (outcrossing depression) (Garant et al., 2007; Aitken et al., 2008; Hendry et al., 2011). Inbreeding between relatives in small populations also represents another threat that can reduce genetic diversity (Charlesworth & Willis, 2009). Even though mating occurs in a panmictic way, consanguineous crosses are possible. Inbreeding increases with the relatedness in a small-colonized population (Glémin, 2003) and reduces the rate of heterozygosity through the genome faster than does genetic drift (inbreeding depression in the case of deleterious recessive alleles in homozygote states). Both genetic drift and inbreeding will reduce the genetic diversity in the recolonizing population. In a population with high rate of inbreeding, deleterious mutations will accumulate in homozygote state after few generations. If selection pressure is strong enough, it will accelerate the elimination of these mutations (i.e. Individuals harbouring these mutations either die or do not reproduce) this mechanism refers to purging of the genetic load (Barrett & Schluter, 2008). However, in a very small population, the effect of genetic drift will be greater than selection and deleterious mutations will be present in high frequency and thus hinder local adaptation to occur (Figure 4). The complex interaction between gene flow and local adaptation is changed in fragmented landscape. The existence of habitat patches with various environmental conditions favours the existence of local and divergent selection pressures (Fischer & Lindenmayer, 2007). Moreover, fragmentation increases the genetic isolation of populations, which favour local 22 © 2017 Tous droits réservés.. lilliad.univ-lille.fr.
(30) Thèse de Dima Souleman, Lille 1, 2017. [Chapter 1] General Introduction. adaptation in large populations (Lopez et al., 2009). However, this isolation greatly reduces the fitness of small populations in heterogeneous landscapes. The effect of fragmentation on local adaptation is so hard to predict and empirical studies are needed to better understand this phenomenon. The study of local adaptation in fragmented landscape allows being at the center of interactions between gene flow, landscape fragmentation and local adaptation. Adaptation to environmental modifications may occur through standing genetic variation (the presence of several alleles for one locus in a population) or new mutations. Usually, adaptation seems to be faster from the standing variation than from new mutations because Advantageous alleles are instantly accessible in high frequencies contrarily to beneficial mutations. Beneficial alleles have more chance to be fixed when they exist in multiple copies in the population (standing variation) than if they result from a single new mutation that may be lost through genetic drift. Moreover, since advantageous alleles present as standing variation are older than new mutations, they may have been submitted to previous selective pressures. These alleles might have acquired multiple advantageous genetic changes and may have reached high frequencies (pre-adaptation) (Barrett & Schluter, 2008). The high magnitude of the beneficial effect of an advantageous allele and the high effective size of populations can increase the probability of fixation (Barrett & Schluter, 2008).. Environment 2. Environment 1. Low gene flow. Difference in genotypes frequency between populations living in contrast environments after many generations with a low gene flow between populations. Local Adaptation. High gene flow. High gene flow tends to homogenize genotypes frequency between environment. No Local Adaptation. Genotype conferring high fitness in Environment 1 Genotype conferring high fitness in Environment 2 Generalist genotype. Figure 6 : How gene flow affects local adaptation. In (A), low gene flow between two contrasted environments accompanied by selection pressure facilitates local adaptation. In (B), high gene flow. 23 © 2017 Tous droits réservés.. lilliad.univ-lille.fr.
(31) Thèse de Dima Souleman, Lille 1, 2017. [Chapter 1] General Introduction. tends to homogenize the genetic composition of the two contrasted environments that hinder local adaptation to happen.. 4. Genetic basis of a quantitative trait. The multiple mechanisms and processes affecting local adaptation make its genetic basis complex, different in origins and remain little clear so far. Most characters involved in local adaptation may be polygenic, quantitative, associated with unknown genes or pleiotropic effects (i.e. a gene influences two or more unrelated phenotypic traits). Some approaches have been used to exceed the difficulty in defining some of these cases such as quantitative genetic approach. Thus, some variants having pleiotropic effects and playing adaptive role have been identified, for example, the common mutation EDAR 370A in human populations in east Asia which increases hair thickness, the morphology of the teeth and increases the number of sweat glands (Fujimoto et al., 2008; Kimura et al., 2009; Park et al., 2012). Actually, despite the recent technology that allows the identification of candidate genes involved in adaptive mechanisms, understanding the genetics of quantitative traits requires the identification of the function linking genotypes to phenotypes, which would affect the adaptive value. This identification requires complex experiments in an attempt to identify phenotypic changes associated to a variant. Consequently, most adaptive variants previously characterized have strong and measurable phenotypic impacts. For example, genes involved in the tolerance and hyperaccumulation of heavy metals by plants (Macnair, 1993), or those involved in the tolerance of lactose in adulthood in humans (Bersaglieri et al., 2004). The study of genetic basis of local adaptation thus requires the theoretical background of quantitative genetics. 4.1. Generalities. The main goal of quantitative genetics approach is to understand the response of quantitative traits to selection pressure (environment), to study their inheritance in a segregating population and to describe genetic architecture of quantitative trait. A quantitative trait is a trait with a continuous variation within a population. Molecular basis is often complex, usually multigenic, each gene segregating in Mendelian way. Thus, the observed phenotype (P) is the result of genotype (G), the environment (E) and their interaction (I= G×E) (El-Soda et al., 2014): P=G+E+I 24 © 2017 Tous droits réservés.. lilliad.univ-lille.fr.
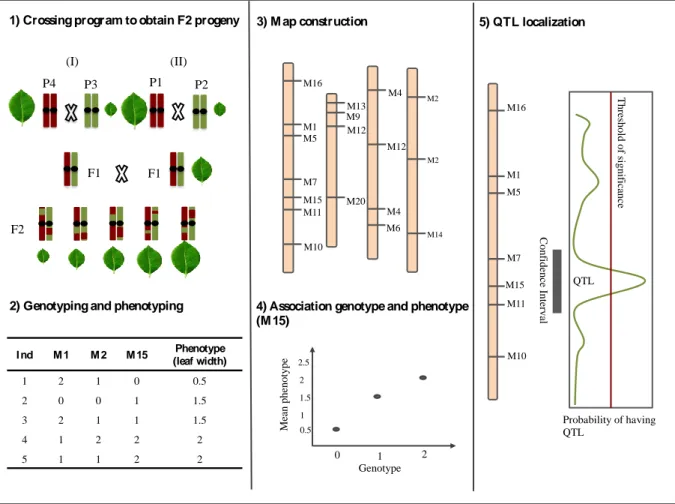
(32) Thèse de Dima Souleman, Lille 1, 2017. [Chapter 1] General Introduction. Most studied traits and especially those involved in the adaptive response are quantitative. The main interest of quantitative genetics is to allow the decomposition of the phenotypic variability of a measured trait in a population or a group of individuals into genetic component (genetic variance VG) and environmental component (environmental variance VE), without knowing the genes involved in this trait. The genetic variance can be decomposed to additive variation (VA refers to the cumulative effect of individual loci) and dominance (VD refers to the interaction between alleles). Genetic variance is in theory directly connected to the polymorphism of the genes encoding the trait. Broad sense heritability determine all potential sources of genetic variation (additive, dominance, epistatic (genes interaction), maternal and paternal effects): h2 = VG/VP The measurement of narrow heritability (h2) of a trait within a population allows to determine the phenotype transmitted by additive genes effects: h2 = VA /VP. This calculation is important to predict how a trait will act to face selection. 4.2. Genetic architecture for adaptive traits. A quantitative trait locus (QTL) refers to a genomic region containing one or many genes that influence the variation in a quantitative trait. This region can be determined by its linkage to polymorphic markers loci, which segregate in Mendelian way. QTL can be mapped either in natural populations (association mapping approach or linkage disequilibrium mapping) or in the segregating offspring where the relativeness among individuals is known (QTL mapping approach). Both approaches aim at uncovering genotypic variation that can explain phenotypic variations among individuals for a quantitative trait (Mackay et al., 2009). Three elements are necessary for QTL Mapping analyses: i) segregating progeny, ii) molecular markers and genotyping data for the segregating progeny in order to build a genetic map iii) phenotyping data for the same progeny. For QTL mapping approach, several types of crosses can help for construction of genetic map including F2 generation. Producing F2 progeny starts by crossing two parental lines, which present contrasted phenotypes for the studied trait to form an F1 generation. Then, it is possible to cross a F1 individual on itself or with another F1 resulting from a second parental cross to create the F2 population (Figure 7). This progeny is a necessary component to realize the genetic map through genotyping data for chosen polymorphic markers. This crossing programme provides the possibility to mix randomly by recombination all parental genes. 25 © 2017 Tous droits réservés.. lilliad.univ-lille.fr.
(33) Thèse de Dima Souleman, Lille 1, 2017. [Chapter 1] General Introduction. coding for studied character, by this way, new allelic combinations will be obtained exhibiting various quantitative effects. To construct a genetic map, a high number of molecular markers is needed to provide the opportunity to cover approximately all the genome. The distance between two markers on the linkage group (considered as a chromosome) is expressed as recombination rate between these markers. When the recombination rate is lower than 50%, the markers are related and may belong to the same linkage group.. 1) Crossing program to obtain F2 progeny (I) P4. 3) M ap construction. 5) QTL localization. (II) P1. P3. M16. P2. M1 M5. M2. Threshold of significance. M4 M13 M9 M12. M16. M12 M2. F1. F1. M1. M7. M5. M15 M11. M20 M4 M6. F2. M7 M15. 2) Genotyping and phenotyping. I nd. M1. M2. M 15. Phenotype (leaf width). 1. 2. 1. 0. 0.5. 2. 0. 0. 1. 1.5. 3. 2. 1. 1. 1.5. 4. 1. 2. 2. 2. 5. 1. 1. 2. 2. Mean phenotype. 4) Association genotype and phenotype (M 15). M11. Confidence Interval. M14. M10. QTL. M10. 2.5 2 1.5 1. Probability of having QTL. 0.5. 0. 1 Genotype. 2. Figure 7: Major steps in QTL mapping approach: First step consists in obtaining a F2 progeny (1). The second step shows both genotyping data with two markers M1, M2 (that should distinguish two parental strains, 0 and 2 indicate homozygous genotypes and 1 indicate heterozygous genotype) and their phenotypes data for a quantitative trait (e.g. leaf width)(2). Phenotypes and genotypes measure are used in the third step for genetic map construction (3). The last step includes the identification of genomic region involved in the phenotypic variation for this quantitative trait. When there is a difference in the mean of phenotypic trait for the three genotypes classes for a marker, then this marker is linked to QTL (4).. 26 © 2017 Tous droits réservés.. lilliad.univ-lille.fr.
(34) Thèse de Dima Souleman, Lille 1, 2017. [Chapter 1] General Introduction. The second step in the realization of a QTL analysis is the assessment for the phenotypic trait of interest. This is what is commonly called phenotyping. Like molecular markers, phenotype is only useful if it is variable among individuals of the mapping population. Association between phenotypic and genotypic variation among F2 progeny will help to localize chromosomal regions involved in this trait (QTLs) (Mackay et al., 2009) (Figure 7). When a QTL is detected, the identification of genes affecting the phenotype variation needs more detailed analysis of the chromosomal region ex: by fine mapping. QTL analyses can also help to highlight genes with minor effect.. 5. Case study: adaptation to metals. Among the toxic substances released into the environment by human activities, metals are present in high quantity in the environment and thus require special attention because the short or long exposure to metallic pollution is known to cause harmful effects on living systems (terrestrial and aquatic ecosystem). These effects are difficult to quantify as they occur with varying levels of vulnerability. Both fauna and flora are affected by the presence of metals in their environment. Metals accumulate in living organisms and disrupt biological mechanisms. 5.1. Metals in the environment. Metals like cadmium (Cd), zinc (Zn), lead (Pb), arsenic (As), nickel (Ni) and copper (Cu) are inorganic substances, non-degradable by microorganisms. The term “heavy metals” has been used in the past especially for non-essential metals such as Pb and Cd, which are characterized by a high density greater than 5 g/cm3. Therefore, actually, the term “metallic trace elements” (MTE) seems more appropriate. The most toxic are cadmium, arsenic, lead and mercury. MTEs exist naturally in all ecosystems and in all living organisms in varying concentrations following environments and organisms. In the earth crust, heavy metals are present in the form of minerals, from which they can be mobilized by natural events such as erosion or volcanic eruptions, but also by human activities. The latter is due to physical releases related to metals and mining activities and to the releases of everyday life products such as batteries. Air emissions are also a major source of metallic pollution. While most organic molecules may be degraded, heavy metals can not and their concentration increases steadily in the soil and water.. 27 © 2017 Tous droits réservés.. lilliad.univ-lille.fr.
(35) Thèse de Dima Souleman, Lille 1, 2017. [Chapter 1] General Introduction. Metals can be divided into two categories: macro elements or essential are necessary for a normal performance of organisms like calcium (Ca), magnesium (Mg) and potassium (K), and micro elements including iron (Fe), copper (Cu), zinc (Zn), nickel (Ni)…are essential for cellular functions but in very small quantity. Some of these metals are involved in molecular processes such as the control of gene expression, protein biosynthesis, growth substances and chlorophyll. Some others metals are toxic for organisms (like Pb, Hg, Cd, ...). All metals may, from a threshold concentration, induce toxicity in organisms. Metals have been and are still extensively used in the global economy. Thus, ore extraction and the use of raw materials such as fossil fuels are common sources of contamination. Nowadays, human activities have led to increase metallic contamination. Main polluting sources are: . Agriculture through the massive use of fertilizers, pesticides, land application of sewage sludge.. . Industry mainly because of dust and smoke emissions, discharges of gas and of liquid effluents.. . Urbanization and its discharges of domestic waste, heavy traffic and massive use of fossil energy.. Two classes of metallic pollution can be distinguished according to origin: . Ancient pollution: due to natural sources of these component such as geological events, rocks erosion, volcanoes and the biological decomposition that explain the presence of metals in some regions named metalliferous sites, where organisms have been exposed to high concentrations of metals for many years.. . Recent pollution: owing to anthropic activities that usually release a great amount of MTEs in aquatic and/or terrestrial ecosystems.. The presence of MTEs in aquatic or terrestrial ecosystems also generates dangerous consequences for the majority of plants and animals directly exposed to metals. However, some species develop effective means of protection against metals. The sites that are highly polluted by MTEs (mainly Zn, Pb, Cd) resulting from anthropic activities are called calamine sites. Generally, calamine sites are characterized by drought because of the loss of vegetation (Macnair, 1987), the deficiency of some nutriments (Macnair, 1987; Becker & Dierschke, 2008), and spatial heterogeneity. These characteristics make the presence of metals in the environment as an important engine of natural selection 28 © 2017 Tous droits réservés.. lilliad.univ-lille.fr.
Figure
Documents relatifs
It is however possible to use our knowledge on stand-level characteristics of a forest stand as rules to build a virtual stand, which will be close to the real stand, and which
markers for genetic diversity and structure analysis of atlantic salmon Salmo salar populations. Nilsson J (1997) Mtdna and microsatellite variation in baltic
D'autre part cette méthode n'est valable, pour estimer la variance additive, que si les variances de dominance et d ’épistasic sont faibles (011 obtient ainsi de
perdu la région riche en acides ami- nés « basiques » interagissant avec la tubuline, la région de liaison avec EB1, une nouvelle protéine de fonc- tion encore inconnue [6] et,
For example, among the conifers occur- ring in Korea, Abies koreana has an extremely restricted geo- graphic range with isolated populations, but it shows a higher level of
Dans de telles conditions, on conçoit aisément que frapper monnaie n’allait absolument pas de soi pour les Argiens et que chaque émission devait, en réalité, répondre à
Comme nous l’avons indiqué en introduction, cet examen de l’accueil réservé aux publications du marchand est effectué sur une période s’étendant jusqu’en
In the present study, we tracked the evolution of allele frequency in two genes associated with pearl millet phenotypic variation in situ.. We sampled 17 populations of cultivated
