Internal
Geophysics
(Applied
Geophysics)
Characterization
of
building
materials
from
the
aqueduct
of
Antioch-on-the-Orontes
(Turkey)
Yacine
Benjelloun
a,*
,
Julia
de
Sigoyer
a,
Julie
Carlut
b,
Aure´lia
Hubert-Ferrari
c,
He´le`ne
Dessales
d,
Hatice
Pamir
e,
Volkan
Karabacak
faUniversite´ GrenobleAlpes,ISTerre,CNRS,BP53,38041Grenoble,France
bE´quipedege´osciencesmarines,InstitutdephysiqueduglobedeParis,SorbonneParisCite´,Universite´ ParisDiderot,UMRCNRS7154,
75005Paris,France
cUniversityofLiege,UnitofPhysicalandQuaternaryGeography,Lie`ge,Belgium dUMR8546,LaboratoireAOROC,ENS,75230Paris,France
eMustafaKemalUniversity,ArchaeologyDepartment,Hatay,Turkey
fEskisehirOsmangaziUniversity,DepartmentofGeology,26040Eskisehir,Turkey
1. Introduction
Themajorprogressaccomplishedinrecentyearsinthe fieldsofgeodesyandseismologyhasmadeitpossibleto clarify seismic hazard in numerous regions around the world.InordertodocumenttheQuaternaryseismicityofa given area,palaeoseismological studiesarenecessaryto characterizetheearthquakecycle,andtoprovide comple-mentary data to the instrumental approach for risk assessment.However,thesestudiesareespeciallycritical
whenthecurrentseismicitydoesnotreflectthelong-term activityofagivenarea,asitisthecaseoftheLevantfault. Thisfaultzonehasquiteanextensiveseismiccatalogue sincethebeginningofourera,whichstronglycontrasts withthemuchweakerseismicityduringthelastcentury (Ambraseys, 2009; Ambraseys and Jackson, 1998). The archaeological wealth of this region is a major assetto documentitsrecentseismicity,concurrently with tradi-tional palaeoseismologicalstudies.Several recent works have studied damaged historical sites in order to find tracesofearthquakesinthebuildingsandtoquantifythe associated deformation (Altunel et al., 2009; Galli and Galadini,2001; Meghraoui et al.,2003; Passchier et al., 2011; Volantetal., 2009). The aqueductsareespecially interesting buildings for archaeoseismic studiesas they
* Correspondingauthor.ISTerre,Domaineuniversitaire,1381,ruedela Piscine,38400Saint-Martin-d’He`res,France.
E-mailaddress:yacini@wanadoo.fr(Y.Benjelloun). ARTICLE INFO
Articlehistory:
Received25February2014
Acceptedafterrevision9December2014 Availableonlinexxx Keywords: Aqueduct Antioch Archaeoseismology Archaeology Brick Romanperiod ABSTRACT
TheRomanaqueductofAntioch-on-the-Orontes(Turkey),acitylocatednearthejunction betweentheactiveDeadSeafaultandtheEastAnatolianfault,hasbeendamagedseveral timesduetohistoricalearthquakes,asmentionedinancienttexts.Thetracesofrepairsare studied in order to identify their potential seismic origin. The deformations of the structure werecharacterisedthankstoaLIDARscan.Severalbricksweresampledon differentpartsofthecity’saqueducts,ontheoriginalstructureandonrepairedparts.The brickswerecharacterizedthroughapetrologicalapproach.14Candarchaeomagnetism
weretestedonthebricksinordertoconstraintheageoftheirproduction.Thesynthesisof allthedatashowedalocaloriginforthebricks,andledtotheidentificationofseveral manufacturing techniques and several types of production, thus, confirming the potentialityofthisapproachtodateandcharacterisepost-seismicrepairs.
!2015PublishedbyElsevierMassonSASonbehalfofAcade´miedessciences.
ContentslistsavailableatScienceDirect
Comptes
Rendus
Geoscience
w ww . sc i e nce d i re ct . co m
http://dx.doi.org/10.1016/j.crte.2014.12.002
commonlypresentasimple,linearpath,andwerequickly andsystematicallyrepairedafterbeingdamagedbecause of their critical role in providing the cities withwater. Ancientsources,suchasStrabo(XII.8.18,cf.Jones,1928,p. 515),alsoshowthattheRomanshadarealawarenessof seismic hazard and took that in consideration when planningtheirconstructions.
Inthisperspective,theRomancityof Antioch-on-the-Orontes (Antakya, Southern Turkey) (Fig. 1) offers the benefitofhavingawell-documentedhistoricalseismicity and information about the restoring phases of the aqueductofthecityafteritsdeteriorationbythe earth-quakes. Such restoring works, financed by the Roman
emperors, are mentioned by the Byzantine chronicler Malalas (243, 275–276,418–422, cf. Dindorf,1831) for threeearthquakesin37,115and526CE.Somepartsofthis aqueductarestillwellpreservednowadays.Theobjective ofthepresentstudyistocharacterisetherestoringphases and to evaluate if they could help us to clarify the earthquakecalendar.Thisstudyaimsatinvestigatingthe possible evolution of Roman materials and building techniques,aswellasitsimpactonthebuildingresistance to earthquakes. This latter issue is addressed by the analysisofbricks,astheyareanthropicmaterials.Looking atdifferentparameters,itispossibletogetaninsightinto the differentmanufacturingsteps.We presenthere the
Fig.1. (Colouronline.)Locationmapofthisstudy.Thethreecolouredcirclesrepresentthedamagedareasofthreehistoricalearthquakes,estimatedfrom thesourcesavailable.ThedatesaregivenCE.ThefaultsweredrawnaccordingtoAkyuzetal.(2006).
Y.Benjellounetal./C.R.Geosciencexxx(2015)xxx–xxx 2
firststepsofthiswork,whichconsistofcharacterizingand datingtheaqueduct’sbuildingmaterials.
2. Geologicalandarchaeologicalcontext 2.1. Localgeology
Thecity ofAntiochis locatedintheKarasuvalley, a depression set between two ranges of mountains, the AmanosonthewesternsideandtheAnatolianrangeon theeasternside.ThisriftisborderedbytwoNE–SWfault systems, which are part of the transition between the
LevantfaultandtheEastAnatolianfault.Atthispoint,the penultimatebigsegmentoftheLevantfaultcrossesthe Amikbasin,attheNorthwestofthecity,andjoinsthelast segmentwithaNE–SWorientation,knownastheKarasu fault(fig. 1)(Karabacakand Altunel,2013; Rojayet al., 2001). The surroundingrocks are seton a pre-Pliocene basement and can be subdivided into two groups: Palaeozoic igneous units topped by an allochthonous Mesozoicophioliticcomplex,andaLowerMiocene–Upper Eocenesedimentarysequencemadeoffoldedsandstones andlimestones(Fig.2)(Boulton,2009;Rojayetal.,2001). Theophioliteincludesserpentinisedperidotites,gabbros,
Fig.2.(Colouronline.)Mapoftheaqueductsandtheirgeologicalcontext.ThewhiteareasarecoveredbyQuaternarysedimentarydeposits.Thelocal lithologywastakenfromAksayetal.(2002).
diorite dykes, various basaltic lavas, boninites and plagiogranites(Robertson,2002).Theserocksarecovered withPlio-QuaternarysedimentsandQuaternaryvolcanic rocks (quartz tholeiite, olivine tholeiites, alkali basalts) (Alicietal.,2001;Bagcietal.,2008;Parlaketal.,2009). 2.2. Archaeologicalbackground
2.2.1. Theancientcityanditsaqueducts
Foundedin300BCbytheSeleucids,thecityofAntioch was famous in ancient times for its sophisticated and efficientsystemofwatersupply(Fig.2)(Kondoleon,2000). Drinkingwatermainlycamefromkarstsoverhangingthe plateauofDaphne,6km southofthecity.Theaqueduct system visible today was described by the Byzantine chroniclerMalalas(243, cf.Dindorf,1831).Followingan earthquakein37AD,Caligulabuiltbathsandanaqueduct supplyingthemwithwaterfromDaphnesprings.Malalas (275–276, cf. Dindorf, 1831) also writes that after the earthquakein115AD,TrajanandHadrianalsobuiltbaths withtheirassociatedaqueduct.Thesubsequentfateofthe aqueductsisunknown,althoughoneofthetwoaqueducts may have been used at the end of the 12th century accordingtoJohannesPhocas’testimony(Wilber,1938). Bothaqueducts(fig.2)wereidentifiedduring archaeolog-icalsurveysinthe1930s.Oneaqueduct(AQ1),supplying theNorthandthecentreofthecity,wasdatedtoCaligula’s reign,whiletheother(AQ2),locatedatahigherelevation and better designed, seemsto date backto Trajan and suppliedthesouthernpartofthecity(Wilber,1938). It shouldbenotedthatthosesurveyswerenotextensiveand havenotbeenupdatedsincethen.Duringafieldmissionin July2012,weidentifiedtwootherportionsofaqueduct (AQ4andAQ5),whichseemtobelongtoathirdsystem, higherthanthetwolinesdescribedabove.
2.2.2. Constructionmaterialssampled
Thankstoanextensive and almostcontinuous docu-mentationsincetheRomanperiod,weknowthatAntioch
anditssurroundingshavebeenrepeatedlystruckbymany earthquakes(Fig.1).Accordingtoancientsources,thecity wasstruckbynomorethanninesignificantearthquakes between0and500CE(Ambraseys,2009;Guidobonietal., 1994). These successiveearthquakes, together withthe effectsoftime,ledtoseveralrepairsthatarestillvisibleon theaqueducts.
Thedifferentbuildingmaterialsanalysedinthisstudy weresampledinJuly2012.Twelvebricksweresampledon fourdifferentportionsofaqueductidentifiedinthecity. AQ1andAQ2belongtothetwosystemsdescribedabove, whileAQ4andAQ5arepartofathirdhighersystem.Nine bricks come from thefirst buildingstages, while three weresampledonrepairedstructures,whichenabledusto comparethematerialsusedindifferentbuildingstages, and to check if the restoring bricks present peculiar features.Thename,location,sizeandbuildingcontextof eachbrickaresummarisedinTable1.
3. Methods
3.1. Constructionsurvey
ALIDARscanwascarriedoutonAQ4inordertohavea detailed topographic map of this portion of aqueduct, preliminarytoamorecomprehensivefieldstudy(fig.3). TheLIDARtechniqueisbasedonthemeasureofthetravel timeofalaserbeambetweenthesourcedeviceandagiven target.Scanningthetargetwithmultiplebeamsallowsone toproducea3Dscatterplotwithamillimetreresolution. AnextensiveLIDARsurveywasdonewiththeOptechILRIS 3Dsystem.Thescatterplotwasthengeneratedwiththe PolyWorks 10.0TM software, and processed with the
TrimbleRealWorks7.1.1TMsoftwareattheUniversityof
Lie`ge (Belgium). Thanks to this processing, several measurements were done on the building: horizontal trackontheaqueduct,thicknessandheightofthedifferent architectural layers, deformations. Finally, the photo-graphstaken onthefield wereprojectedon thescatter
Table1
Names,locationandcontextofthestudiedsamples.AQ2remainsconsistinthreesuccessivepiles,withanorth–southorientation.Pile1,inthemiddle, supportsthesouthernpartofanarchandaportionofchannelabove.Pile2standsjustsouth.Thearchbetweenpiles1and2isnowdestroyed.Forthe locationsofAQ4samples,seealsoFig.3.
Sample Coordinates Context Dimensionsof sample
(length!thickness) incm
AQ1-1 36809.115N–36809.241E Origin,channelwall,justabovetheground 18!4 AQ2-1 36809.121N–36809.267E Origin,outsidewallofchannelabovethearch 30!3 AQ2-2 36809.121N–36809.267E SeeAQ2-1 30!3 AQ2-4 36809.121N–36809.267E SeeAQ2-1 30!3 AQ2-5 36809.121N–36809.267E Origin,arch 40!5.5 AQ2-8 36809.117N–36809.260E Origin,pile1,161mabovetheground 80!5 AQ2-9b 36809.117N–36809.260E Origin,pile1,justaboveAQ2-8 20!5.5 AQ2-9c 36809.117N–36809.260E SeeAQ2-9b 40!4 AQ2-10 36809.114N–36809.258E Origin,pile2,26mabovetheground 35!4.5 AQ4-1 36810.355N–36809.849E Repairstructureonacrack,westside,justsouth
ofabigtravertinedeposit,80cmbelowthechannel’stop
20!3.5 AQ4-4 36810.378N–36809.843E Repairstructureonacrack,westside,northernend
oftheaqueduct,2.6mabovethetheground
25!5.5 AQ5-1 36810.118N–36809.584E Repairstructureonacrack,3mabovetheground ? AQ5-2 36810.092N–36809.500E Origin,3mabovetheground ?!5
Y.Benjellounetal./C.R.Geosciencexxx(2015)xxx–xxx 4
plotandortho-rectifiedtorealiseasketchoftheaqueduct, onwhichthemainstructuresweredrawn.
3.2. Petrologiccharacterisationofthebuildingmaterials 3.2.1. Macroscopicfeatures,texture,andmineralogy
Thedifferentbrickswerefirstcomparedonthebasisof macroscopicfeatures(Fig.4),suchasthesize,colour,and texture. Then, in order to study more precisely their manufacturing process, thin sections were madeat the Laboratory of Geologyof the E´cole Normale Supe´rieure (Paris) and characterized under an optical microscope LeicaDMRXP,equippedwithacameraLeicaDFC420.The natureofdifferentcomponentsobservedwasalsostudied withanFEGZeissSigmascanningelectronicmicroscope (Table2).
3.2.2. 2D-porosityandgranulometry
SEM picture mosaics were realised on most of the bricks, with a magnification of 500 and a resolution of 1024!768pixels.OntheSEMimages,theporesarethe only areas coloured in black, which makes it easy to compute then 2D-porosity using the JMicroVision soft-ware, (Roduit, 2007). To check the reliability of this method,3D-porositymeasurementswerealsocarriedout concurrentlyontwobricks(AQ4-4andAQ5-2),usingthe triple-weightmethod(NFEN1936,2007norm).
For the granulometry study, the brick thin sections AQ1-1,AQ2-4,AQ2-5,AQ2-8,AQ2-9b,AQ4-1,AQ5-1,and AQ5-2werefullyphotographedinpolarisedlightwitha magnification of 1.6 and a resolution of 2592!1944 pixels. The pictures were then processed usingtheJMicroVisionsoftware.Theareaandequivalent circular diameterof the grains arethen estimated. The percentageofareacoveredbythegrainsisthenplottedin diagrams(Figs.5and6).
3.3. Dating
3.3.1. Archaeomagnetism
In order to constrain the age of production of the differentbricks,magneticpalaeointensitiesmeasurements
werecarriedoutoneightsamples(AQ1-1,AQ2-1,AQ2-5, AQ2-9b,AQ2-10,AQ4-1,AQ5-1,andAQ5-2)atthe Saint-Maur-des-Fosse´sobservatory, incollaboration with Yves GalletandMaxime LeGoff(IPGP,Paris).These measure-mentsweredonewithtwotriaxemagnetometers,whose operatingprincipleisdescribedinLeGoffandGallet(2004)
(Table3).Low-fieldthermomagneticcurvesacquiredwitha KLYAgicoequippedwithaCS2ovenupto5808ConAQ1-1, AQ2-5,AQ2-9b,AQ2-10,AQ4-1,AQ4-4,AQ5-1,andAQ5-2 allowedustogaininsightsintothemagneticmineralogy and stability of the magnetic phases during thermal treatments.Inaddition,thecomposition,sizeandtexture offerri/ferromagneticphasesweredescribedusingtheBSE modeduringSEMobservationsonAQ1-1,AQ2-5,AQ2-9b, andAQ2-10thinsections.
3.3.2. Carbon14
Charcoalfragmentswereextractedfromthemortarof samplesAQ1-1,AQ2-9,AQ2-10,andAQ4-4,anddatedby Aeon Laboratories (aeonlaboratories.com) with the 14C
method, to constrain the building age of the different architecturalunits.Theradiocarbonageswereconverted intocalendarageswiththeINTCAL09calibration(Heaton etal.,2009)usingOxcalprogram(Ramsey,2009). 4. Results
4.1. DamagesreportedonAQ4
Fig.3showsasyntheticsketchofthesurveyrealised withtheLIDARscanofAQ4.Theaqueductroughlyfollows anorth–southline,withtwodirectionchangesthatmake it concave toward the west. The first change in the northernparthasbeenmadebythehandofmantojoin theothersideoftheaqueductacrosstheriver.Bycontrast, thechangeinthesouthern part(redarrow inFig.3)is associatedwithacrack,hiddenbyahugeaccumulationof travertinethatprecipitated becauseof aleakage;thisis interpretedastheresultofadeformationsufferedbythe aqueductafteritsconstruction.Thewholesouthernpartof theaqueductsufferedananticlockwiserotationofabout 158, andthelayerindicated by a redline on Fig.3 has
Table2
Nature ofthetempergrains inthebricks.Cpx=clinopyroxene,opx=orthopyroxene,amphi=amphibole,plagio=plagioclase,K–Fd=K-feldspar,ol basalt=olivinebasalt,brlava=brownlava,carbpeb=carbonatepebble.‘‘o’’meansanoccurrenceoftheelement.
AQ1-1 AQ2-1 AQ2-2 AQ2-4 AQ2-5 AQ2-8 AQ2-9b AQ2-9c AQ2-10 AQ4-1 AQ4-4 AQ5-1 AQ5-2
Cpx o o o o o o o o o o o o Opx o o o o o o o o o Amphi o o o o o o o o o o o Olivine o o o o o o o o o o o Plagio o o o o o o o o o o Quartz o o o o o o o o o o K–Fd o o o o o Calcite o o o o o o o o o o Chromite o o o o Olbasalt o o o o o o o o o o o o o Gabbro o o o o o o o o o o o Brlava o o o o o Diorite o o o o o Andesite o o o o o o Granite o o o o o o
sufferedacollapseof10to15cm,southofthetravertine deposit.After thisdamage,water wasno longer ableto
flownorthwardasitdidbefore.Anotherfracturecanbe seenatthenorthernendoftheaqueduct.
4.2. Petrologyofthebricks
4.2.1. Microscopictextureandmineralogy
Allthebricksshowtheirowncharacteristicsintermsof texture, which may reflect different qualities of fabric (Fig.4).AQ2-1,AQ2-2,andAQ4-1,havearather homoge-neousgranulometryofthetemperandshowagoodquality ofclay-tempermixing.Onthecontrary,AQ2-4,AQ2-8and AQ2-10containvarioussizesofgrainsandthemixingwas donelesscareful,asshowedbythepresenceofseveralclay
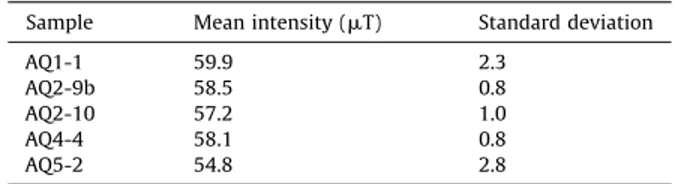
Table3
Magneticpalaeointensities recordedin the bricks. The means were computedonthreefragmentsforeachbrick,exceptAQ2-5thatshowed greatervariabilityandforwhichsixfragmentswereused.
Sample Meanintensity(mT) Standarddeviation
AQ1-1 59.9 2.3
AQ2-9b 58.5 0.8 AQ2-10 57.2 1.0
AQ4-4 58.1 0.8
AQ5-2 54.8 2.8
Fig.3. (Colouronline.)InterpretativesketchesoftheLIDARscanforthesiteAQ4.a:horizontalprofileoftheaqueduct;b:photographoftheeasternsideof theaqueduct;c:schematicsketchoftheeasternsideoftheaqueductprojectedonaverticalplane.Thefeaturesweredigitalisedfromtheortho-rectified photographsoftheaqueductwithArcGISTM.Theimagecorrespondstoanorth–southprojection.Theredandblackbrokenlinesshowtheoriginalposition
ofthesouthernpartoftheaqueductbeforedamage.
Y.Benjellounetal./C.R.Geosciencexxx(2015)xxx–xxx 6
lumpswithouttemper.Theotherbrickspresent interme-diate qualities of fabric. Fig. 5 presents the grain area percentagesestimatedbyimageprocessing.Mostofthe brickshaveavaluecloseto30%,butsomebricks,like AQ1-1, AQ4-1and AQ5-2,exhibit lowervalues, whileAQ2-8 showsremarkablyhighgraincontent,largerthan40%.
ThemineralogyofthetemperisreportedinTable2.Itis composedofvariousfossils,suchasnummulites(fromEocene limestones),andisolatedmineralsandfragmentsof rocks, whichcanbeidentified.Mostofthemcomefrombasaltsand gabbros. All the bricks exhibit quite similar mineralogical contents. The temper includes rounded and angular frag-ments,thelatteroftenhavingveryacuteandreflexangles. 4.2.2. Porositymeasurements
The2D-porosity resultsareshowninFig.5.The 3D-porositymeasurementscarriedoutonAQ4-4andAQ5-2
providedvaluesof28%and16%,respectivelythatconfirm the2D-porosityanalysisdoneonthephotograph.The 2D analysisseemsthereforetogivereliableporosityestimates. The2D-porosityvaluesarequitesimilaramongthebricks. Still,AQ2-4,AQ4-1andAQ5-1exhibithighervalues,closerto 20%,whileAQ2-1andAQ2-2showlowerones,below10%. 4.2.3. Granulometry
TypicalgranulometrydiagramsareshowninFig.6.The curvescanbedividedintotwoparts.Thefirstoneincludes thesmallergrainsthatclearlyfollowaGaussianpattern, whilethebiggestgrainslieabovetheGaussiancurve.Itis noticeablethatthegraindiameterforwhichthegrainarea percentageis thehighestis thesamefor almostallthe bricks, around 40
m
m, except AQ2-9b, which contains more grains of a lower diameter, close to 20m
m. The coarsergrainsinmostofthebricksfollowaregularpatternFig.4.(Colouronline.)Macroscopicphotographsofelevenfragmentsofthebricksamples.Thefragmentswerecutandpolishedduringthepreparationof thethinsections.
thatlookslikeaparabola(e.g.,AQ2-4).Severalpointsdonotfit onthisparabola,between200and700
m
m,andcanrepresent asignificantarea,asinAQ2-9b(fig.6).Theaveragediameterof these outliers is also different between the bricks. The maximumgraindiameterforallthebricksdoesnotexceed 3mm,anditisevenlowerthan1mmforAQ2-9bandAQ4-4. 4.3. Dating4.3.1. Archaeomagnetism
Over the 24 samples measured, 6 did not provide resultsthat fitthe qualitycriteria, suchasdescribed in
Gallet and Le Goff (2006). AQ2-5 and AQ4-1 showed anomalousresultsthatcanbeexplainedbyanunsuitable mineralogy, with an important amountof large titano-magnetites.AllsuitableresultsaredisplayedinTable3.All thesamplesprovidedsimilarintensities,withameanof 57.6"1.7
m
T.Theobtainedintensityvaluesare tooclose, consideringtheassociateduncertainties,toreallydistinguish subgroupsamongthebricks.Thankstothereferencecurveestablishedforceramics from theNishapur site in Iran, at the same latitudeas Antioch(GeneveyandGallet,2013),but1700kmmoreto theeast(Fig.7),themeasuredintensitiescanbeconverted into ages. As the reference curve is not established in Antioch, someerrors may be generated,in particular a systematic time lag due to a westward drift of the geomagnetic secular variation has been recently under discussion(Aubertetal.,2013;Livermoreetal.,2013).The timeintervalthatweobtainwiththiscorrelationranges from the5th centuryBCE tothe1st century CE, which covers the construction age of AQ1 estimated by the archaeologists(see Section2.2.1).Another less probable possibilitywouldbelaterthanthe4thcenturyCE.Asthe brickswerelikelyproducedduringtheRomanperiod,after the 1st century BCE, the production age is mostly constrained by thelowerlimit of theintensityinterval, towardthemid-1stcenturyCE.
4.3.2. 14Cages
Three charcoalsextractedfromthemortarsofAQ2-9 and AQ2-10 providedsimilar ages of 0"50year CE(2
s
uncertainty) that would match a construction during Caligula’sreign.AsecondcharcoalfromAQ2-9mortargives amucholderage,between500and400BCE,whichcouldbe duetotheuseofoldwoodintheconstruction.Thecharcoal fromAQ1-1mortarprovidedanageof800"100year.The lastcharcoal,fromAQ4-4mortar,givesaquasi-modernage, certainlydubiousasthesamplewastoolighttobeanalysed properly.
5. Discussion
5.1. Relevanceofthedifferentparametersobservedonthe bricks
Thecolourofabrickdependsmainlyontheclayandthe firingprocess.Claydepositednearthealterationareawill showaredtobrowncolour,whilepurersedimentaryclay will exhibit white to yellow colours (Velde and Druc, 1999).Thefiringprocesscansignificantlyalterthisoriginal colour:ahigh-temperature,oxidisingfiringwillgiveared colour,whileareducingfiringwillmakethebrickdarker. Thisreducingatmospherecanbeobtainedbyreducingthe temperatureandputtingwetorganicmatterinthekiln. Differences in thecolour intensitymayalsoresultfrom differentpositionsinthefurnace(LeNy,1985).
Themacroscopicormicroscopictexture,aswellasthe porosity,maygiveinformationonthecarewithwhichthe brick maker worked on his paste. For instance, a homogeneousspatialdistributionoftheporesandgrains, with sometimes a preferential orientation of grains,
Fig.5.(Colouronline.)Amountofgrainsandporosityofthebricks.The grains/totalarearatios(greybars)wereestimatedwiththinsection microphotographs,andthe2Dporosities(redbars)withSEMimages.The twoorangeellipsesindicate3D-porosityvalues.ThevaluesforAQ2-9b andAQ4-4mustbeconsideredwithcautionbecauseofthesmallamount ofmaterialonthethinsection.Theuncertaintyis"2%.
Fig.6.Graindistributionofthreerepresentativebricks.Thethreebricks arerepresentativeofthethreetypesidentifiedinthisstudy:typeA (AQ2-4,black),typeB(AQ4-1,grey),andtypeC(AQ2-9b,white).Thescale usedforthediameterislogarithmic.
Y.Benjellounetal./C.R.Geosciencexxx(2015)xxx–xxx 8
indicatesacarefulmixtureoftheclayandthetemper.Itis also possible to study the selection of the temper by lookingatthenature,angularity,andgranulometryofthe grains.AccordingtoVeldeandDruc(1999),theGaussian patternforthefinergrainsinthegrainsizediagrams(fig. 8)correspondstothe‘‘naturaltemper’’,i.e.thegrainsthat wereoriginallypresentintheclayresource.Therefore,the peakoftheGaussiancurve,i.e.thegrainsizecoveringthe biggest area, can be used to characterise and compare differentclayresources.Thecoarsergrainswereaddedby thebrickmakertogivebettermechaniccoherencetothe claypaste. Thosegrainscanalsofollowregularpatterns like a parabola, which corresponds to an uniform distributionof thedifferentgrainsizes, ornot and it is thenpossibletoseeifapeculiarsizerangewaschosenby thebrickmaker.Thefactthatthemaximumgrainsizedoes not exceed 3mm can indicate the use of sieving. The anthropic addition of grains is also evidenced by the coexistenceofnaturallyincompatiblemineralsinthesame brick,likequartzand olivine,and thehighangularityof manygrainsthatcanresultofcrushing.
5.2. Originofthebuildingmaterials
Therockfragmentsusedastemperareverysimilarto the geological outcrops around Antioch, and several identifiedrockscanbecomparedtothedifferentunitsof theophioliticcomplex:basalticlavas,gabbros,diorites.Rare plagiogranitesmayhavebeenused.Thefossilsfoundinthe
bricks match with those found in the local limestones. Limestones were not only used for construction (we observedseveralblocksofsimilarlimestoneinthebuilding), butalsoastemperandfluxingagent.Allthesefactssupport thehypothesisofalocalproductionforthebricks. 5.3. Typologyforthebricks
5.3.1. Selectionofrelevantcomparisonparameters
ThebricksAQ2-1toAQ2-5,sampledinthearchofAQ2, areallverysimilaronmanyaspects.Theywereproduced using the same manufacturing process; they certainly belongtothesameproduction,andwereprobablymade bythesameceramist. Thebricksofthis coherentgroup present variability for some studied parameters, which give an idea of the heterogeneity inside one set. It is noticeable thattheporosity is quiteuneven withinthis group,andthattheirmineralcontentmaynotbestrictly similar.Therefore,theporosityandtheoccurrenceofsome peculiarminerals/rockswillnotbeusedtodiscriminate the different productions. By contrast, the amount of temper, the granulometry, and the colour are very homogeneous within this group, and may certainly be usedasrelevantparameters.
5.3.2. Comparisonandtypology
Afirstgroupofbricks(AQ2-1toAQ2-5)ischaracterised byahighproportion(30%)oftemper,aselectionof middle-sizedgrains(around300
m
m),a3-mmsieving,andarather45 50 55 60 65 70 -500 0 500 1000 1500
57.6
µT
Terminal date
for production
Year
Pa
la
eo
in
te
ns
it
y (
µT
)
AQ2-9AQ2-10 AQ1-1 14C ages
Fig.7.(Colouronline.)ReferencecurveofthevariationsofthemagneticfieldforthesiteofNishapurThepalaeointensitydataandtheirdatingweretaken
from(GeneveyandGallet,2013).Themeanofthedataobtainedfromthebricksisindicatedbythehorizontalredlineandthestandarddeviationbythe
horizontalredband.Thetimeintervalscorrespondingtothoseintensityresultsareshownwithtwoverticalgreybands.Thereliableconstructionage intervalsobtainedfrom14Cdatingoncharcoalsfromthemortarareindicatedbythehorizontalblackbars.
oxidisingfiring(typeA).AQ2-10andprobablyAQ5-1can beaddedtothisgroupA.Asecondgroup(typeB)canbe identified,whichcouldincludeAQ1-1andAQ4-1,andis characterisedbyaverysmallamountoftemper,finegrains (around200
m
m),a3-mmsieving,andanoxidisingfiring. Finally, a third group (typeC) differs from the type A because it presents no grain above 1mm, and could includeAQ2-9band AQ4-4.Theydo notshowa similar distributionoffinegrains,thoughthepeakoftheGaussian curveoccursat40m
mforAQ4-4likefortheotherbricks, against20m
mforAQ2-9b.So,thesetwo bricksseemto havefollowedthesamemanufacturingprocess,butthey differbytheirclayresourceandmaynotbefromthesame workshop,AQ4-4havingasimilarclaytypetotheother bricks contrary toAQ2-9b. There remainthree isolated bricks,AQ2-8,AQ2-9c,andAQ5-2,alldifferent.Thethree brickssharetheparticularityofhavingbeenfiredundera reducingatmosphere,asshownbytheirbrownishcolour, butdoesnotpresentsimilargrainsizedistribution:while AQ2-8hasahugeamount(over40%)ofunsortedtemper, AQ5-2contains coarse temperin very small proportion (20%).5.4. Datingofthebuilding
The archaeomagnetism results suggest that all the brickswereprobablymanufacturedbeforethe2ndcentury CE.This ageisconsistentwiththe14Cageobtainedfor AQ2-10smortar,andwithaconstructionduringCaligula’s reign, as claimed by Malalas (243). However, this age disagrees with the few archaeological data available, which claim that AQ2 was built by Trajan in the 2nd centuryCE.ForAQ1-1,weobtainedamuchlaterageforthe constructionthatcouldmatchwiththelatertimeinterval suggestedbyarchaeomagnetism(from500 to1200CE). Whilethearchaeological dataclaim that AQ1 wasbuilt during Caligula’s reign, the 14C data on AQ1-1 mortar
suggeststhatthisportionofAQ1wasbuiltorrebuiltinthe MiddleAges.
6. Conclusion
Wehaveprovidedafirstworkonthisbuilding,which hasbeenverypoorlystudiedsofar.OurLidarstudyproved thattheaqueductwasdeformedafteritwasbuilt,which resultedinimportantleaksalongthecracks,atiltofthe wholestructure,andareversewaterflowcausingmassive travertineprecipitation.Thebricksstudyhasallowedusto characterise different productionsand toidentify some manufacturing techniques, like the use of sieving. The temperanalysisprovesalocaloriginforthebricks.Mostof theagesobtainedforthebricksdatedby archaeomagnet-ismandthe14Cmethodonmortararecoherent,exceptfor
one very young14C age.Nevertheless, the ages remain
poorlyaccurate.Aslongaswelackasolidtimeframe,it seems difficult to link these repairs and the cracks observedon theaqueducts withhistorical earthquakes. Supplementary data is needed to better constrain the chronology of thebrick production, thebuilding of the differentaqueductsandtheirrepairs.Adetailed archaeo-logical study of the building and thermoluminescence
dating on the bricks could refine the chronology of the constructionandbrick production.Nevertheless,we have developedthroughthisworkpromising methodstostudy ancientbuildingdeformationsandmaterials,whichcouldbe appliedtootherarchaeologicalsitespronetoseismichazard. Acknowledgements
Thisresearchwasmostlyfounded bytheENS(Paris, France),theMistralprojectofINSU,andtheUniversityof Lie`ge(Belgium).WethankHaticePamirforenablingthe samplinginAntioch.ISTerreispartofLabexOSUG@2020 (ANR10LABX56).
References
Aksay,A.,etal.,2002.1:500,000ScaledGeologicalMapsofTurkey,Hatay
Region.In:GeneralDirectorateofMineralResearchandExploration,
Ankara,Turkey.
Akyuz,H.S.,Altunel,E.,Karabacak, V.,Yalciner,C.C.,2006. Historical
earthquakesactivityofthenorthernpartoftheDeadSeafaultzone,
southernTurkey.Tectonophysics426,281–293.
Alici,P.,Temel,A.,Gourgaud,A.,Vidal,P.,Gu¨ndogdu,M.N.,2001.
Quater-narytholeiitictoalkalinevolcanismintheKarasuValley,DeadSea
RiftZone,SoutheastTurkey:Sr-Nd-Pb-Oisotopicandtrace-element
approachestoCrust-MantleInteraction.Int.Geol.Rev.43,120–138.
Altunel,E.,Meghraoui,M.,Karabacak,V.,Akyuz,S.H.,Ferry,M.,Yalciner, C.,Munschy,M.,2009.Archaeologicalsites(TellandRoad)offsetby
theDeadSeaFaultintheAmikBasin,southernTurkey.Geophys.J.Int.
179,1313–1329.
Ambraseys,N.N.,2009.EarthquakesintheMediterraneanand
Middle-East:amultidisciplinarystudyofseismicityupto1900.Cambridge
UniversityPress,Cambridge,UK.
Ambraseys,N.N.,Jackson,J.A.,1998.Faultingassociatedwithhistorical
andrecentearthquakesintheEasternMediterraneanregion.
Geo-phys.J.Int.133,390–406.
Aubert,J.,Finlay,C.C.,Fournier,A.,2013.Bottom-upcontrolof
geomag-neticsecularvariationbytheEarth’sinnercore.Nature502,219–223.
Bagci,U.,Parlak,O.,Hoeck,V.,2008.Geochemistryandtectonic
environ-mentofdiversemagma generationsformingthecrustalunitsof
theKizildag(Hatay)Ophiolite,southernTurkey.Turk.J.EarthSci.
17,43–71.
Boulton,S.J.,2009.RecordofCenozoicsedimentationfromtheAmanos
Mountains, southernTurkey: Implicationsfor the inception and
evolutionoftheArabia-Eurasiacontinentalcollision.Sediment.Geol.
216,29–47.
Dindorf,L.A.,1831.IoannesMalalasChronographia.In:Corpus
Scrip-torumHistoriaeByzantinae32Bonn.1828–1897.
Gallet,Y.,LeGoff,M.,2006.High-temperaturearcheointensity
measure-mentsfromMesopotamia.EarthPlanet.Sci.Lett.241,159–173.
Galli,P.,Galadini,F.,2001.Surfacefaultingofarchaeologicalrelics.A
reviewofcasehistoriesfromtheDeadSeatotheAlps.Tectonophysics
335,291–312.
Genevey,A.,Gallet,Y.,2013.Theexcavationandtheabsolutechronology.
In:Collinet,A.,Rante,R.(Eds.),NishapurRevisited:Stratigraphyand
CeramicsoftheQohandez.OxbowBooks,Oxford,UK, pp.28–38.
Guidoboni,E.,Comastri,A.,Traina,G.,1994.Catalogueofancient
earth-quakesintheMediterraneanareauptothe10thcentury.Istituto
NazionalediGeofisica,Roma,Italy.
Heaton,T.J.,Blackwell,P.G.,Buck,C.E.,2009.ABayesianapproachtothe
estimationofradiocarboncalibrationcurves:theIntCal09
method-ology.Radiocarbon51,1151–1164.
Jones,H.L.,1928.Strabo:Geography.Books10–12.HarvardUniversity
Press,Cambridge,USA.
Karabacak,V.,Altunel,E.,2013.EvolutionofthenorthernDeadSeaFault
ZoneinsouthernTurkey.J.Geodyn.65,282–291.
Kondoleon,C.,2000.Antioch:thelostancientcity.PrincetonUniversity
Press,Princeton,USA.
LeGoff,M.,Gallet,Y.,2004.Anewthree-axisvibratingsample
magne-tometerforcontinuoushigh-temperaturemagnetization
measure-ments:applicationstopalaeo-andarchaeo-intensitydeterminations.
EarthPlanet.Sci.Lett.229,31–43.
LeNy,F.,1985.Lesfoursdetuiliersgallo-romains:me´thodologie,e´tudes
technologiques,typologieetstatistique,chronologie.E´ditiondela
Maisondessciencesdel’homme,Paris,France.
Y.Benjellounetal./C.R.Geosciencexxx(2015)xxx–xxx 10
Livermore,P.W.,Hollerbach,R.,Jackson,A.,2013.Electromagnetically
drivenwestwarddriftandinner-coresuperrotationinEarth’score.
Proc.Natl.Acad.Sci.USA110,15914–15918.
Meghraoui,M.,Gomez,F.,Sbeinati,R.,VanderWoerd,J.,Mouty,M.,Darkal, A.N.,Radwan,Y.,Layyous,I.,AlNajjar,H.,Darawcheh,R.,Hijazi,F., Al-Ghazzi,R.,Barazangi,M.,2003.Evidencefor830yearsofseismic
quies-cencefrompalaeoseismology,archaeoseismology,andhistorical
seismic-ityalongtheDeadSeafaultinSyria.EarthPlanet.Sci.Lett.210,35–52.
Norme,N.F.E.N.,1936.2007.Me´thodes d’essaidespierresnaturelles.
De´terminationdesmassesvolumiquesre´elleetapparente etdes
porosite´souvertesettotales.E´dAFNOR.
Parlak,O.,Rizaoglu,T.,Bagci,U.,Karaoglan,F.,Hoeck,V.,2009.Tectonic
significanceofthegeochemistryandpetrologyofophiolitesin
South-eastAnatolia,Turkey.Tectonophysics473,173–187.
Passchier,C.,Wiplinger,G.,Su¨rmelihindi,G.,Kessener,P.,Gu¨ngo¨r,T., 2011.Romanaqueductsasindicatorsofhistoricalactivefaultsinthe
Mediterraneanbasin.In:2ndINQA-IGCP-567International
Work-shop onActive Tectonics, Earthquake Geology,Archaeology and
Engineering, Corinth,Greece.
Ramsey,C.B.,2009.Bayesiananalysisofradiocarbondates.Radiocarbon
51,337–360.
Robertson,A.H.F.,2002.Overviewofthegenesisandemplacementof
MesozoicophiolitesintheEasternMediterraneanTethyanregion.
Lithos65,1–67.
Roduit,N.,2007.JMicroVision:unlogicield’analysed’images
pe´trogra-phiquespolyvalent(The`sededoctorate`ssciences).Universite´ de
Gene`ve.
Rojay,B.,Heimann,A.,Toprak,V.,2001.Neotectonicandvolcanic
char-acteristicsoftheKarasufaultzone(Anatolia,Turkey):thetransition
zonebetweentheDeadSeatransformandtheEastAnatolianfault
zone.Geodin.Acta14,1–17.
Velde,B.,Druc,I.C.,1999.Archaeologicalceramicmaterials:originand
utilization.Ed.SpringerVerlag.
Volant,P.,Levret,A.,Carbon,D.,Scotti,O.,Combescure,D.,Verdel,T.,Piant, A.,Laurent,P.,2009.Anarchaeo-seismologicalstudyoftheNıˆmes
Romanaqueduct, France: indirect evidencefor an M>6seismic
event? Nat.Hazards49,53–77.
Wilber,D.N.,1938.TheplateauofDaphne.Thespringsandthewater
systemleadingtoAntioch.In:Stillwell,R.(Ed.),
Antioch-on-the-OrontesII:TheExcavationsof1932–1936.PrincetonUniversityPress,