1
Comparison of sensory characteristics of green tea in Thai
Nguyen and Phu Tho, Vietnam
Dang Thi Minh Luyen 1*
, Ha Duyen Tu
1, Philippe Lebailly
2, Nguyen Duy Thinh 1, Tu VietPhu 1
1
Department of Quality Management, School of Biotechnology and Food Technology, Hanoi university of science and technology, Vietnam
2 Department of Agricultural Sciences, University of Liege, Belgium
* Corresponding author: dangluyentpp@yahoo.com
Abstract
Green tea is a popular consumption product in Vietnam. Especially, tea which origins from Tan Cuong, Thai Nguyen has been known for long by its better quality than those coming from other regions on the country. The study aims at comparing and finding out if the difference between tea in Thai Nguyen and Phu Tho can be figured by sensory tasting.
Two products picked from Tan Cuong, Thai Nguyen province and two others from Phu Ho district, Phu Tho are were evaluated by a panel of twelve judges (eleven women and one man) who was set from a group of thirty eight peoples, had completed a general training and sensory tasting on tea. The experiment on dry tea (eleven descriptors) was carried out separately of the experiment on brewed tea (twenty-one descriptors) and brewed leaf (five descriptors). All attributes are made notes on the sensory unstructured intensity scale.
Statistic analyses have shown typical differences by region among all of trees groups of attributes: dry leaf (10/11 attributes), liquor (6/21 attributes) and brewed leaf (5/5 attributes).
Keywords green tea, sensory analysis
1. Introduction
Green tea since the early years, is the most popular beverage in Vietnam, the third largest green tea production in the world (after China and Japan)
Though green tea was just cultivated and exploited in Tan Cuong, Thai Nguyen in the last hundred years, its products were highly appreciated and much favorite [1, 2]. Development of productivity and quality in Tan Cuong tea region these days are derived from local tea variety (Trung Du) and acclimation tea varieties which mainly origin from other regions in the country, except the two - Kim Tuyen tea variety which were imported from Taiwan and LDP1, which is hybrid tea between mother plant Dai Bach Tra (China) and PH1 father plant (India), a product of the Northern mountainous agriculture and forestry science institute.
The goal of study is finding out the regional difference on both varieties Kim Tuyen and LDP1. However, in the context of this article, we showed only the result for Kim Tuyen variety.
2. Material and method
Four Kim Tuyen dry tea products, two of which from Tan Cuong marked as TKH1 (A), TKH2 (B) and two other of which from Phu Ho, marked sequentially as PKH1(A), PKH2 (B) were chose. These are said to be the best of tea products in the research regions. Products are harvested at a regulated level: one bud and two leaves picked at same harvesting time respectively (around Oct.2012).
Tea brewing method took place in compliance with standards of TCVN 5086-90 or ISO 3103-1980. An amount of 2.8g tea leaves was put in to a 140ml brewing cup. Boiled water from instant electric
2
kettle was poured on to tea leaves (water temperature in the infuser is about 93oC), and started
timing. After six minutes, tea liqueur was poured in to tasting cups. Tea liquor temperature in
tasting cup is about 70oC.
Thirty eight people, who enrolled on panel of beginning judges, took two basis tests about smell, taste and color. Twelve people having the best results were chosen to be judges.
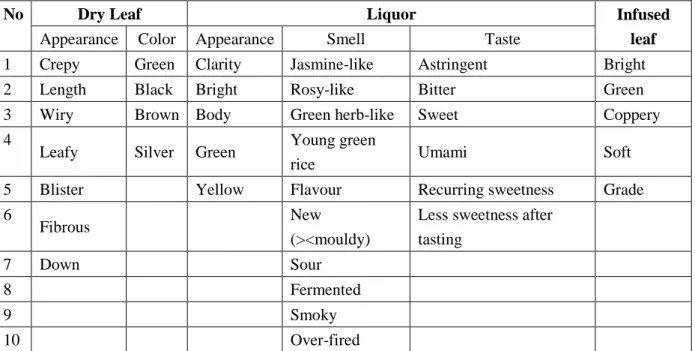
After referred from standards of TCVN 3218-1993, 10 TCN 258 – 96, ISO 6078-1982 and others researchers about green tea attributes such as Ellys H. [3], Lee J. and Chambers D.H. [4] …, the tea attributes were approved by internal judges and final evaluated judges. Table 1 below is collection of final attributes for sensory green tea evaluation which we used.
Table 1: Attributes for sensory green tea evaluation
No Dry Leaf Liquor Infused
leaf
Appearance Color Appearance Smell Taste
1 Crepy Green Clarity Jasmine-like Astringent Bright
2 Length Black Bright Rosy-like Bitter Green
3 Wiry Brown Body Green herb-like Sweet Coppery
4
Leafy Silver Green Young green
rice Umami Soft
5 Blister Yellow Flavour Recurring sweetness Grade
6
Fibrous New
(><mouldy)
Less sweetness after tasting
7 Down Sour
8 Fermented
9 Smoky
10 Over-fired
In training process, panelists were introduced and trained with the products and references for each attributes. After being trained in 20 hours, panelists attended to taste and noted attributes of dry leaf, liquor and infused leaf on 10cm unstructured intensity scale.
Results were Anova analyzed on Statistica software and PCA on SPAD software.
3. Results and discussion
3.1. Dry leafAverage value of dry leaf characteristics and their order of evaluation from low to high were displayed in table 2. Small letters on right top of average numbers shown result of Tukey analysis (α=0.05) under a regulation that products were marked by a letter means belong to a same group.
Table 2: Average value of dry tea attributes
No Attribute TKH1 (A) TKH2 (B) PKH1 (C) PKH2 (D) Order of evaluation
1 Green 5.98b 5.43b 2.23a 1.68a DCBA* 2 Black 6.90b 5.97b 2.43a 2.59a CDBA* 3 Brown 2.38a 3.51b 7.51c 7.85c ABCD* 4 Silver 6.54b 6.24b 3.18a 2.05a DCBA* 5 Down 8.42c 5.53b 3.02a 1.56a DCBA* 6 Fibrous 1.54b 1.93b 8.24a 8.48a ABCD* 7 Leafy 1.59a 3.00b 8.15c 8.28c ABCD*
3
8 Crepy 6.87c 4.67b 2.69a 2.04a DCBA*
9 Wiry 6.78c 5.53b 1.72a 1.68a DCBA*
10 Blister 1.84a 2.97a 6.14b 4.57b ABDC*
11 Length 6.60b 2.87a 8.54c 5.98b BDAC
The table shows clearly differences of ten among eleven attributes: brown, black, green, silver, down, leafy, crepy, wiry and blister. Differences between two product groups of Tan Cuong and Phu Ho (AB is bigger or smaller together in compare to CD) can be seen obviously by observing average value. For example, on Green attribute, Phu Tho tea products have average value at 1.68-2.23, while Tan Cuong tea products have average value at 5.43-5.98. Length average value of products were crisps-crossed, explained by no scheming research about length. In addition, length attribute is easy to change after a transportation process. Length scale was evaluated as 10 equal to 3 cm and 0 equal to 0.5 cm.
Therefore, at a same picking level (one bud and two leaves), Tan Cuong brought back a product which has more silver, greener, blacker, more wiryer, more crepy, more down, but less brown, less leafy, less fibrous, less blister. According to green tea standards (stand green tea is black green, less leafy, less fibrous and more snow (TCVN 3218:1993)), the Tan Cuong tea have more good advantages, which caused by the differences of geography, of climate or also of cultivation plan and transforming method. Some researchers had shows that production material (fertilizer) were invested many more in Tan Cuong tea regions [5, 6].
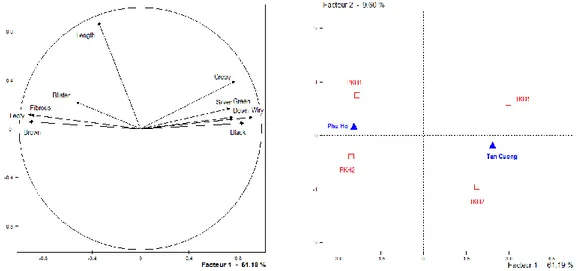
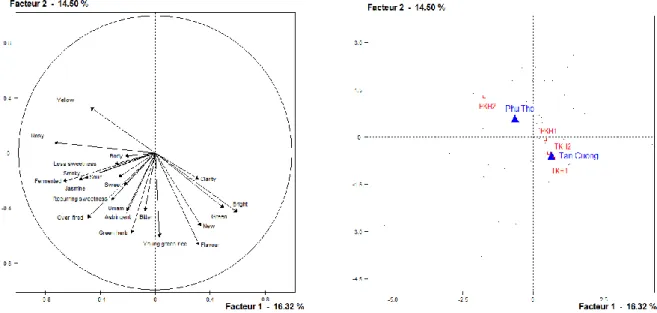
Figure below show results of PCA analysis of dry tea attributes and position of products on axis 1 (61.19% information ratio) and axis 2 (9.6% information ratio). Axis 1 shows attributes such as green, silver, down, crepy, black, brown, fibrous, leafy. Among those, yellow, fibrous, leafy are on opposite directions with others. These are attributes in order to distinguish products of Tan Cuong and Phu Ho. Four products lie on four different quarters. Products of Tan Cuong lie far from Phu Ho, it shows that the differences between two regions lying on attribute such as green, silver, down, crepy, black, brown, fibrous, leafy.
Figure 1: PCA analysis on dry tea
3.2. Brewed tea
4
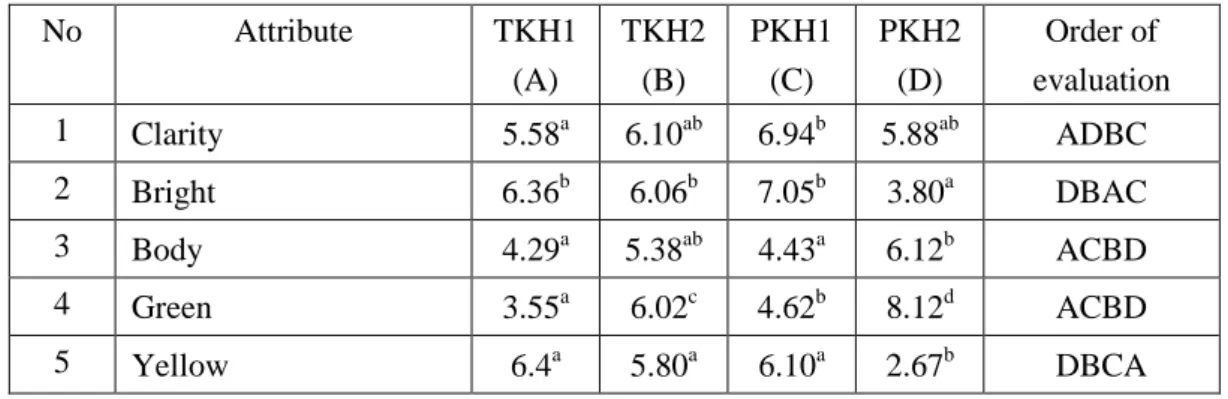
Below the similar structure as table 2, table 3 show the results of ANOVA analysis on attributes of color and appearance of liquor. The result wouldn’t differentiate the tea between Tan Cuong and Phu Tho, even though the difference between products exists.
Table 2: Average values of color and appearance attributes of brewed tea
No Attribute TKH1 (A) TKH2 (B) PKH1 (C) PKH2 (D) Order of evaluation 1 Clarity 5.58a 6.10ab 6.94b 5.88ab ADBC 2 Bright 6.36b 6.06b 7.05b 3.80a DBAC 3 Body 4.29a 5.38ab 4.43a 6.12b ACBD 4 Green 3.55a 6.02c 4.62b 8.12d ACBD 5 Yellow 6.4a 5.80a 6.10a 2.67b DBCA 3.2.2. Arome
Observation ANOVA in table 4, we see only the regional difference on 6 attributes: Sour, Fermented, New, Flavour, Rosy-like and Young green rice.
Table 3: Average values of aroma attributes of brewed tea
No Attribute TKH1 (A) TKH2 (B) PKH1 (C) PKH2 (D) Order of evaluation 1 Sour 3.75ab 2.96a 3.91ab 4.36b BACD* 2 Over-fired 1.89a 2.47a 1.77a 2.36a CADB 3 Smoky 2.95a 2.15a 3.23a 2.85a BDAC
4 New (><mouldy) 5.36ab 5.71b 4.41ab 4.11a DCAB*
5 Flavour 5.07bc 5.58c 3.98ab 3.00a DCAB*
6 Jasmine-like 3.15a 3.16a 2.82a 3.27a CABD
7 Rosy-like 1.69a 1.84ab 2.97b 4.52c ABCD*
8 Young green rice 3.85b 5.50c 2.85ab 2.17a DCAB*
9 Green herb-like 3.5a 3.28b 3.75a 3.25a DBAC
10 Fermented 2.02ab 1.31a 2.71ab 3.12b BACD*
The most different are shown between rose and young green rice scent. Tan Cuong tea’s rose scent are weaker but young green rice scent are stronger. This brought in proposal that Tan Cuong teas are processed at higher temperature in compare to Phu Ho. This processing at high temperature create young green rice scent, but also reduce flowery in tea (and to Kim Tuyen tea, the most specific flower scent is rosy-like)
With the attributes Sour, Fermented, New, and Flavour, products of two regions are distributed on two sides, though media products are not discriminated in term of statistics. For example, new tea aroma, PKH1(4.41) belong to 2 groups a (PKH1:4.11) and b (TKH2: 5.71). Regional differences require more experiments upon increasing number of sample to restring then. However upon those experiments that took place, Tan Cuong has a higher trend about New, Flavour and a lower trend about Sour and Fermented.
5
Thus, in conclusion, theses differentials aroma attributes such as Sour, Fermented, New, Flavour, Rosy-like and Young Green Rice, is the distinguishing characteristics of the tea Tan Cuong, which express the difference in production technology, also in quality intrinsic of tea leaf.
3.2.3. Taste
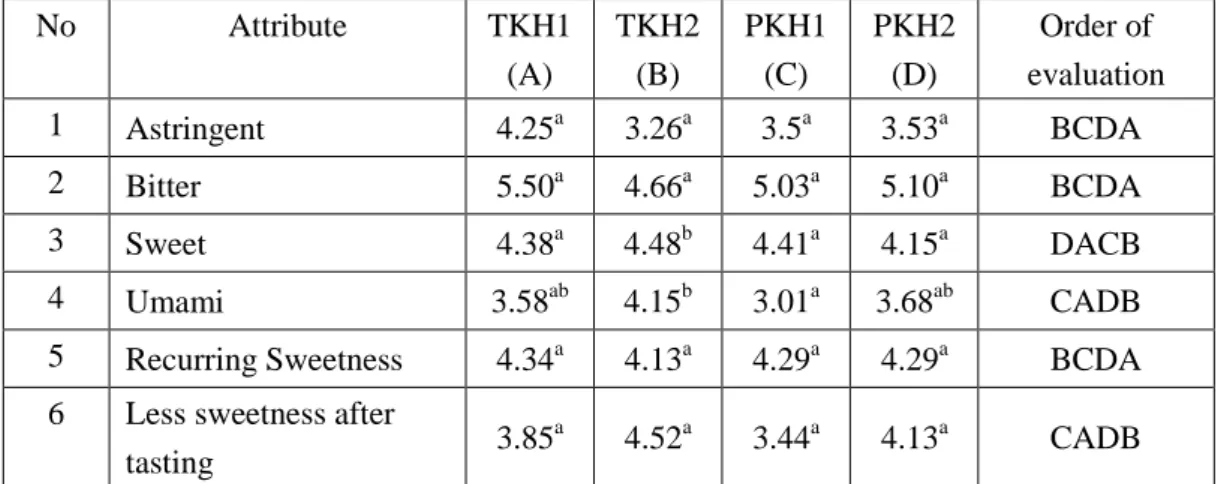
Among taste attributes, the most related to geography origin and tea grade [7] is hardly differentiated by Anova analysis. However, PCA results show that Tan Cuong tea has a higher trend on astringent, bitter and umami (Figure 2). The difficulties of regional differentiation in taste attributes could be caused by polyphenol compounds, causing bitter and astringent (which are not favorable by consumer) in green tea. Indeed, this compound is difficult to evaluate on sensory analysis, especially when number sample are many [8]. This situation allow an understanding for the confusion of origins of tea product in the market, as the regional related attributes is very hard to distinguish, especially to mass consumers.
Table 4: Average values of taste attributes of brewed tea
No Attribute TKH1 (A) TKH2 (B) PKH1 (C) PKH2 (D) Order of evaluation 1 Astringent 4.25a 3.26a 3.5a 3.53a BCDA 2 Bitter 5.50a 4.66a 5.03a 5.10a BCDA 3 Sweet 4.38a 4.48b 4.41a 4.15a DACB 4 Umami 3.58ab 4.15b 3.01a 3.68ab CADB
5 Recurring Sweetness 4.34a 4.13a 4.29a 4.29a BCDA
6 Less sweetness after
tasting 3.85
a
4.52a 3.44a 4.13a CADB
In summary, we do analysis PCA for all characteristics group: color and appearance, aroma and taste. PCA results including all attributes of liqueur are shown on below diagram. Axis 1 shows 16% information ratio is linked with attributes: Rose-like, Over-fired, Fermented, Bright, Sour. Axis 2 with 14% information ratio show information of attributes: Flavour, New, Green herb-like, Young Green Rice, Astringent, Bitter and Umami. Products, thought are not divided in to two different regions, Tan Cuong products are close to each other and tend to be nearly to Axis 2. It means that Tan Cuong tea products have higher intensity of attributes Flavour, New, Green herb-like, Young green rice, Astringent, Bitter and Umami.
6
Figure 2: PCA analysis on brewed tea
PKH2 products lies differentially and was characterized by Yellow, meanwhile other product TKH1, TKH2 and PKH1 are nearer about Green and Bright. Besides, appearance and color of green tea are affected mainly by technology process. PKH1 products have a defining characteristic of color and appearance closer to Tan Cuong products, which gives out a proposal that Phu Tho tea also have a good production procedure to reach a similar quality of Tan Cuong product in terms of color and appearance.
3.3. Brewed leafs
Similarly, we did analysis brewed leaf on the attributes Coppery, Soft, Bright, Green, Grade. Results show Tan Cuong tea has lower intensity of copper color, leaf are smaller however has a higher intensity of bright, green and soft in compare to Phu Tho tea. This result is equal to results of experiments which has been taken place on dry tea of previous parts.
Table 5: Average values of attributes of brewed leaf
No Attribute TKH1 (A) TKH2 (B) PKH1 (C) PKH2 (D) Order of evaluation 1 Coppery 1.52a 1.77a 3.26b 4.47c ABCD* 2 Soft 6.72b 6.90b 3.84a 2.95a DCAB* 3 Bright 6.11a 5.38a 5.23ab 3.90b DCBA* 4 Green 6.86a 6.49a 5.05c 3.07b DCBA* 5 Grade 4.19c 2.69b 7.22a 6.85a BADC*
4. Conclusion and recommendation
Hence upon observation of dry tea, tea infusion and infused leaf, Tan Cuong tea products are different significantly from Phu Ho tea products.
7
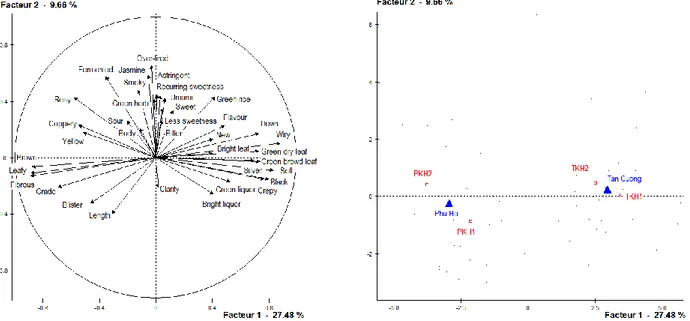
Observation below PCA analysis of all attributes, we see – axis 1 shows 27.48% information ratio, reflect majority of attributes of dry tea and infused leaf, axis 2 shows 9.66 information ratio, replect attributes of aroma and taste.
Figure 3: Synthetic PCA analysis on dry tea, brewed tea and brewed leaf
Experiments shows availability of differentiation of products of Kim Tuyen tea of Tan Cuong and Phu Ho products on almost of attributes of dry tea and brewed leaf. At a same picking level (one bud, two leave), Tan Cuong tea has a better evaluation than Phu Ho one’s. However larger experiments are needed, with a bigger number of products and giving out a great significant affirmation about regional difference.
To tea infusion, Tan Cuong and Phu Ho tea are discriminated on attributes Sour, Fermented, New, Flavour, Rosy-like and Young green rice. Of a same type (one bud, two leave) tea, Tan Cuong tea was well-cultivated in order to give a better flavour. La transportation of fresh tea leaf in Tan Cuong is better so that tea will be less fermented. And in terms of processing, Tan Cuong has a specific way of processing, which is use higher firing in order make a stronger scent of young green rice but weakening scent of rose in compare to Phu Ho tea.
In general, the study has shown difference of processing technological between two regions, but those inherent differences were not shown profoundly. We recommend analysis at professional judges to make a deeper study on these attributes.
Acknowledgements
Thanks to Board of Project 322, Ministry of Education and Training of Vietnam and Project PIC – Kingdom of Belgium for their financial aid to the researcher.
References
[1] Ngô Xuân Cường, Hà Duyên Tư, Nguyễn Duy Thịnh, So sánh một số chỉ tiêu chất lượng nguyên liệu chè giống Trung Du trồng tại Tân Cương Thái Nguyên và trồng tại Thanh Ba Phú Thọ. Tạp chí khoa học và công nghệ, 2009.
[2] Hoàn thiện cơ sở dữ liệu và thủ tục bảo hộ chỉ dẫn địa lý cho chè Tân Cương, Viện quy hoạch và thiết kế nông nghiệp, 2008.
8
[4] L. Jeehyun. and D.H. Chambers, A lexicon for flavor descriptive analysis of green tea, 2006. [5] Nguyễn Hữu Thọ, Nghiên cứu chuỗi giá trị ngành chè nhằm đưa ra các giải pháp nâng cao tính
cạnh tranh của chè Thái Nguyên trên thị trường, 2009.
[6] Trần Công Thắng, the participation of the poor in agricultural value chains: a case study of tea, 2004.
[7] Q. Chen, Z. Jiewen, and S. Vittayapadung, Identification of the green tea grade level using electronic tongue and pattern recognition, 2008.
[8] I. Lesschaeve, and A.C. Noble, Polyphenols: factors influencing their sensory properties and their effects on food and beverage preferences, The American Journal of Clinical Nutrition, 2005.