Journal of Sports Science 4 (2016) 124-131 doi: 10.17265/2332-7839/2016.03.002
A Comparison of 3D Methods for Identifying the Stance
Phase in Treadmill Running for Both Rearfoot and
Forefoot Runners
Dorian Deflandre, Cédric Schwartz, Jean-Pierre Weerts, Jean-Louis Croisier and Thierry Bury
Department of Motricity Sciences, University of Liège, Liège, Liège, 4000, Belgium
Abstract: We compared six 3D methods, OptoGait, and Myotest Run for the determination of contact time for runners with different
foot strike patterns. Twenty male participants were divided into two groups: the heel group, who attack the ground with the heel (n = 12), and the toe group, who attack the ground with the middle/front of the foot (n = 8). They performed trials at speeds of 8 km/h then 16 km/h. To detect foot strike, the use of peak velocity of 3D markers located on the heel, the fifth metatarsal, and the great toe provided the best results for both groups. To detect the toe off, the minimum vertical position of a 3D marker placed in line with the great toe gave the most satisfactory results for both groups. In this way, the values of contact time measured with the 3D methods are consistent. Values measured with OptoGait appear consistent too, while those of the Myotest Run underestimate the contact time for both speeds. 3D analysis provides interesting opportunities for calculation of contact time for both rearfoot and forefoot runners, using specific peak velocities to determine foot strike and marker displacement to determine toe off.
Key words: Contact time, running, 3D, OptoGait, Myotest Run.
1. Introduction
Evaluating performance is a necessary step in the research of excellence in sports, especially in running. This requires the establishment of a scientific and technological approach to follow an athlete and improve their level. Physiological laboratory tests are important in achieving this goal, but they do not provide information on the biomechanical characteristics of the athlete.
When mechanical parameters of running are measured, a critical component is the accurate estimation of foot strike and toe off to determine contact time. Force platforms allow this determination for a single event [1]. However, although highly expensive treadmills and long running tracks with force platforms already exist, if more than one event needs to be measured, it is necessary to use alternative methods of determining stride phase durations. In this
Corresponding author: Deflandre Dorian, Ph.D. candidate,
research field: running economy.
way, new field tools based on optical detection (OptoGait) and accelerometer systems (Myotest Run) represent good alternatives that quickly provide feedback on running gait parameters [2-5]. Indeed, these two tools are usually used for the measure of several parameters of the stride, including contact time [6]. However, they give less information about the foot strike patterns than specific laboratory tools because they do not allow how the foot attacks the ground (forefoot or rearfoot) to be analyzed.
In this context, 3D analysis represents a good way to analyze running movement [7-8]. It provides the exact position in space at any time of each marker used and so of each segment studied. This tool is accurate and reliable, gives us information about movements and joints, and can highlight pathological movement [9].
For 3D analysis in running, different methods for determining contact time (foot strike and toe off) can be used. Methods depend on the position of markers, but also on their velocity and acceleration. For example, there are methods which are based on the time that the
D
distal heel marker reaches a minimum vertical position, and when the vertical velocity of this same marker changes from negative to positive. These methods are valid and reliable for determining foot strike [10]. Similarly, another method detects initial contact using the downward spike in the vertical velocity of a toe marker [11]. Toe off is detected using the rise in the vertical displacement of the toe marker, as well as the upward spike in the vertical velocity of this marker [11]. These different studies only use a population of heel strikers and do not consider the foot strike of their runners. However, high-level athletes have a higher proportion of forefoot strike [12]. Knowing that the 3D evaluation is intended for scientific research and high-level athletes, it is useful to compare methods for every type of foot strike.
Consequently, the purpose of this study was to compare the contact time measured by OptoGait (Microgate Corporation, Italy), Myotest Run (Myotest SA, Switzerland), and six 3D methods (Codamotion, Charnwood Dynamics Limited, UK) for different types of foot strike.
2. Methods
2.1 Subjects
Twenty healthy male runners were recruited from the local population. Subjects were regular runners who ran at least 50 kilometers each week. Subjects were free of chronic musculoskeletal pathologies and had no running related injury within the prior 6 months. The University of Liege School of Medicine Institutional Review Board approved the testing protocol and written informed consent was obtained from each subject before testing. Their physical characteristics are presented in Table 1. The population was divided into two groups, heel strikers (n = 12) or
forefoot strikers (n = 8). The final interpretation of the foot strike was left to the discretion of the investigator. To assist in this task, each participant was filmed (60 Hz) at 8 km/h and 16 km/h and reviewed in slow motion while running.
2.2 Protocol
The experiment was performed at the same time of day for each subject. The test consisted in analyzing the runner’s foot strike. After five minutes of warm-up at 8 km/h, each participant performed three trials of 60 seconds at 8 km/h, followed by three trials of 60 seconds at 16 km/h. Recovery between each trial was three minutes to allow for full recovery. Inside the 60 second trials, a 30 second period of recording was carried out.
Regarding the protocol of the study, we had no choice but to separate it into two parts. We were well aware that the ideal experiment would be for the three measurement tools to operate at the same time. From a practical point of view, this was not possible because of interference occurring between the 3D system and OptoGait. However, results were not influenced by any means, giving the same speed of the treadmill as well as no fatigue being involved in the testing. The literature shows that for either sprinting [13] or distance running [14], fatigue can increase contact time, and may induce a change in all general stride parameters. It has also been demonstrated that the more fatigue is accumulated, the more the runner attacks the ground with the heel [15]. This supports the reason for providing a long enough recovery to avoid any changes in stride purely due to fatigue. The level of the runners (MAS: 18.9 km/h) who participated in the study was an extra precaution to avoid fatigue after each trial at 16 km/h.
Table 1 Anthropometrical and physiological variables from the 20 subjects (MAS = velocity at maximal oxygen consumption).
Age (years) Height (cm) Body mass (kg) Body fat (%) VO2max (ml∙min−1∙kg−1) MAS(km∙h−1)
2.3 Measurements
During the recordings, in each trial and at each velocity, the contact time was measured using three systems: a 3D motion capture system, OptoGait, and Myotest Run. The 3D system uses four optoelectronic cameras and six active markers (three on each foot). The acquisitions were made at 200 Hz. Markers used for the 3D analysis were disposed and held in position on both shoes (neutral Asics shoes (Asics Corporation, Japan) provided to all participants for the entire test) of the participants at the center of the heel (marker 1), the head of the fifth metatarsal (marker 2), and the great toe (marker 3).
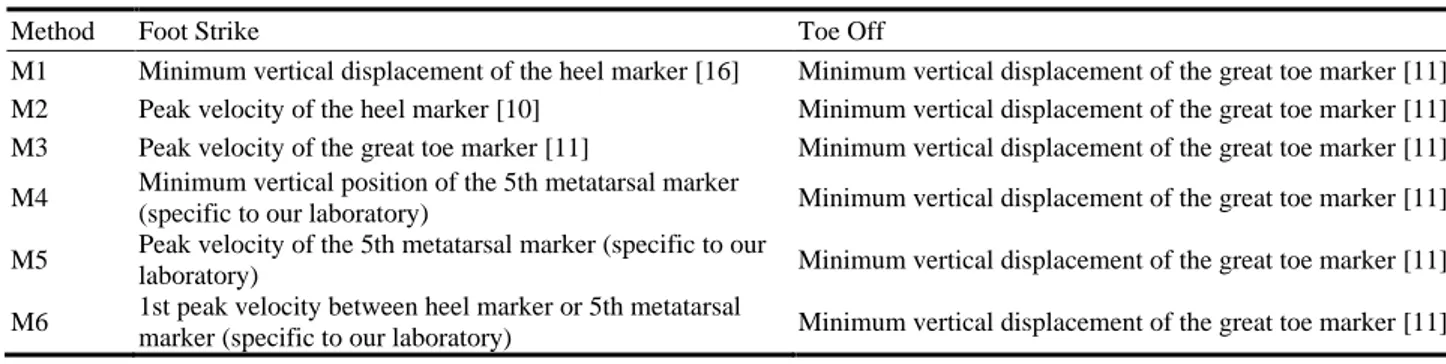
Six gait event detection algorithms (methods M1 to M6) were applied to the raw data. They are based on the time difference between minimum displacement points or between peak velocities in the curves of different markers. Those notable points were a necessary step in order to have a chance computerize algorithms. To determine toe off, the minimum vertical displacement of the great toe marker was used. Because it represented the only possible automatic process to determine toe off, it was therefore used in all of the six methods. This specific toe off detection method was previously validated [11]. To determine foot strike, method M1 uses the minimum vertical displacement of the heel marker [16]. Method M2 uses the peak velocity of the heel marker to determine foot strike [10]. Method M3 uses only the great toe marker to determine both foot strike (peak velocity) and toe off (minimum vertical position) [11]. Method M4 is a new method using the minimum vertical position of the fifth
metatarsal marker. Method M5 is also new and uses the peak velocity of the fifth metatarsal marker. Method M6 uses the peak velocity that would come first, of either the heel marker or the fifth metatarsal marker. In a sense, it combines method M2 and method M5 together.
Methods M4, M5, and M6 are new and specific to our laboratory of motion analysis. A summary of all methods can be seen in Table 2.
Contact time for each of the six methods was simply assessed by calculating the time difference between toe off and foot strike. The different minimum vertical displacements can be seen in Fig. 1, while the peak velocities can be seen in Fig. 2 (for a heel striker) and Fig. 3 (for a forefoot striker).
OptoGait is an optical detection system. The two parallel bars of the device system were placed on the side edges of the treadmill at the same level as the contact surface. This device was connected to a computer controlled by the experimenter. The bars are composed of a transmitter and a receptor slat (96 LEDs). LEDs on the transmitting bar communicate continuously with those of the other one. The system detects any interruptions and therefore measures the contact time and flight with a precision of 1/1000 s. It is often used in field or laboratory analyses and has been validated for various stride parameters including contact time [2, 4, 6].
Myotest Run is a portable device that uses triaxial accelerometry to quantify different stride parameters including contact time [3, 5]. It was placed on the belt of the runner.
Table 2 Summary of the six algorithms applied to the running data.
Method Foot Strike Toe Off
M1 Minimum vertical displacement of the heel marker [16] Minimum vertical displacement of the great toe marker [11] M2 Peak velocity of the heel marker [10] Minimum vertical displacement of the great toe marker [11] M3 Peak velocity of the great toe marker [11] Minimum vertical displacement of the great toe marker [11] M4 Minimum vertical position of the 5th metatarsal marker
(specific to our laboratory) Minimum vertical displacement of the great toe marker [11] M5 Peak velocity of the 5th metatarsal marker (specific to our
laboratory) Minimum vertical displacement of the great toe marker [11] M6 1st peak velocity between heel marker or 5th metatarsal
Fig. 1 Displacement graph of the 3 markers (great toe, heel and fifth metatarsal) over time.
Fig. 2 Graph representing the velocity and displacement of the different markers (great toe, heel and fifth metatarsal) for a heel striker.
Fig. 3 Graph representing the velocity and displacement of the different markers (great toe, heel and fifth metatarsal) for a forefoot striker.
2.4 Statistical Analysis
Each algorithm was compared with the other algorithms, the OptoGait results, and the Myotest Run results. They were expressed with descriptive statistics: means and standard deviations. Statistical analysis included an ANOVA for repeated measures, to compare the values of every method with the OptoGait and Myotest values. The statistical significance was set at P < 0.05. Beyond this value, the differences are considered to be non-significant.
3. Results
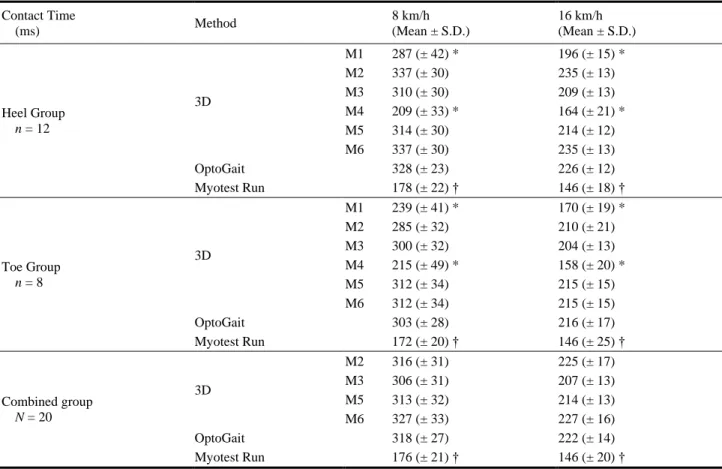
Firstly, the comparison of the six 3D methods used to calculate the contact time is presented in Table 3. For both the heel group (n = 12) and toe group (n = 8) at 8 km/h and 16 km/h, we observed a significant difference between the values calculated by the M1 and M4 methods compared to the four other 3D method values
(M2, M3, M5, M6).
We also observed a significant difference between the values calculated by the M1 and M4 methods compared to the OptoGait values. However, there is no significant difference between the values of methods M2, M3, M5, or M6 compared to the OptoGait values for either the heel group or toe group. For the heel group, compared to the OptoGait values, the closest values come from methods M2 and M6, while methods M5 and M6 provide the closest values for the toe group. For both groups, we observed a significant difference between the values supported by Myotest Run and the values from OptoGait and the 3D methods (methods M1 to M6). With the combined group (n = 20), we observed no significant difference between the values of the M2, M3, M5, and M6 3D methods and the OptoGait values at either 8 km/h or 16 km/h.
Table 3 Contact time (ms) at 8 km/h and 16 km/h (mean ± SD) for the different methods.
Contact Time (ms) Method 8 km/h (Mean ± S.D.) 16 km/h (Mean ± S.D.) Heel Group n = 12 3D M1 287 (± 42) * 196 (± 15) * M2 337 (± 30) 235 (± 13) M3 310 (± 30) 209 (± 13) M4 209 (± 33) * 164 (± 21) * M5 314 (± 30) 214 (± 12) M6 337 (± 30) 235 (± 13) OptoGait 328 (± 23) 226 (± 12) Myotest Run 178 (± 22) † 146 (± 18) † Toe Group n = 8 3D M1 239 (± 41) * 170 (± 19) * M2 285 (± 32) 210 (± 21) M3 300 (± 32) 204 (± 13) M4 215 (± 49) * 158 (± 20) * M5 312 (± 34) 215 (± 15) M6 312 (± 34) 215 (± 15) OptoGait 303 (± 28) 216 (± 17) Myotest Run 172 (± 20) † 146 (± 25) † Combined group N = 20 3D M2 316 (± 31) 225 (± 17) M3 306 (± 31) 207 (± 13) M5 313 (± 32) 214 (± 13) M6 327 (± 33) 227 (± 16) OptoGait 318 (± 27) 222 (± 14) Myotest Run 176 (± 21) † 146 (± 20) †
(* = Significant difference with the OptoGait values and the four other 3D method values; † = Significant difference with the OptoGait and the six 3D methods values.)
4. Discussion
The main objective of this study was to compare different methods of calculating the contact time for different types of runners. A 3D optoelectronic system as well as an OptoGait system and a Myotest Run were compared. We found that 3D methods M2, M3, M5, and M6, and the OptoGait method are all statistically equivalent and can therefore all be used to analyze contact time. However, a few recommendations appear useful to better understand the interest and utility of each system.
In the Heel group, the first of the four markers to record a peak velocity was the heel marker (M2) (Fig. 2). This was expected considering that the marker detecting foot strike is actually located at the heel. This method was already used and validated by Fellin et al. [10] in a population of heel strikers. M2 also gave values closest to the OptoGait values (235 ms (± 13) for M2 versus 226 ms (± 12) for the OptoGait at 16 km/h) compared to M3 and M5. We can therefore assume that method M2 would be the most appropriate method for measuring contact time for an athlete’s heel striking.
In the toe group, we expected that when the runner arrived with the middle or forefoot on the ground, the fifth metatarsal marker would record the first peak velocity related to the foot strike. We observed that the first peak velocity recorded was detected by the marker located at the fifth metatarsal (M5) (Fig. 3). M5 gave also values closest to the OptoGait values (215 ms (± 15) for the M5 versus 216 ms (± 17) for OptoGait at 16 km/h) compared to M2 and M3. Therefore, method M5 seems to be the most appropriate method for measuring the contact time for an athlete’s forefoot striking.
It is also interesting to note that for both groups, method M3 presents no significant difference with the M2, M5, and OptoGait values. The marker placed on the great toe is the last to detect the peak velocity, meaning the values are slightly off, but it presents an advantage to use only one marker located at the great toe to calculate the contact time [11].
We can also observe that whatever type of foot strike a runner has (rearfoot and forefoot runner), method M6, taking the first peak velocities between the heel marker and the fifth metatarsal marker to detect foot strike, seems interesting in some contexts. Indeed, this method would accurately measure the contact time without knowing the foot strike of the runner, or by issuing the hypothesis that the foot strike changes over time (during a long run or with the influence of fatigue, for example) [17-20]. On the other hand, we observed a significant difference between the values of methods M1 and M4 and the values of methods M2, M3, M5, M6, OptoGait and Myotest for both groups of runners. This difference is easily explained given the curve of the heel marker and fifth metatarsal marker coming slowly to a minimum value in vertical displacement, well after the foot strike happened (Fig. 1). The minimum displacement is offset from the time of arrival of the foot in contact with the ground, which invalidates methods M1 and M4 as precise methods for calculating contact time. The hypothesis of why the marker continues its vertical descent following foot strike could not only be from the slight shoe cushioning, but also and especially from the treadmill deformation caused by the subject progressive loading. This observation was confirmed when we put 3D markers on the treadmill for one of the tests. A drop of 2 cm on average was observed because of the treadmill deformation.
Among the different methods used in our work, the values measured by Myotest Run are inconsistent. This could be explained by the fact that Myotest Run determines the support time and not the contact time. The support time, called “effective contact time” by Cavagna et al. [21] is the time during which the force applied by the runner on the ground is higher or equal to its weight. This gives enormous differences ranging from 30%-40% at a speed of 16 km/h and even 40%-50% at a speed of 8km/h between Myotest Run and other methods.
an interesting stride analysis tool for athletes to analyze their performance. The measure of contact time is useful to guide and individualize training [22]. Beside contact time, the 3D tool provides additional biomechanical parameters, such as angulations between segments or asymmetry between the two legs. The implications for the coach in search of a better technique or in injury prevention can therefore be appealing [23]. Furthermore, determining parameters such as contact time with 3D analysis is an essential step toward coupling studies of physiological parameters to biomechanical parameters such as the influence of fatigue on the parameters of stride [17-20].
5. Conclusion
In conclusion, contrary to our initial hypothesis, different methods are consistent for analyzing the contact time for different types of foot strike. Therefore, it is not essential to know or differentiate foot strike to measure contact time in running analysis. Indeed, methods using the minimum vertical position of a marker located near the great toe to detect toe off, and those using the peak negative velocity of 3D markers to detect foot strike can all be used to analyze contact time regardless of foot strike. These methods are methods M2, M3, M5, and M6. No significant difference was observed between the values measured by these methods at the studied speeds. The OptoGait values seem consistent at both speeds too, although this tool analyzes the contact time without giving information about foot strike. Finally, contact time measured by Myotest Run is underestimated because of the detection of foot strike and toe off.
Acknowledgments
The authors would like to acknowledge the support of the French Community of Belgium. The authors would also like to thanks Asics for providing running shoes for the study.
References
[1] Munro, C. F., Miller, D. I., and Fuglevand, A. J. 1987.
“Ground Reaction Forces in Running: A Reexamination.”
Journal of Biomechanics 20 (2): 147-55.
[2] Lee, M. M., Song, C. H., Lee, K. J., Jung, S. W., Shin, D. C., and Shin S. S. 2014. “Concurrent Validity and Test-retest Reliability of the OPTOGait Photoelectric Cell System for the Assessment of Spatio-temporal Parameters of the Gait of Young Adults.” Journal of
Physical Therapy Science 26 (1): 81-5.
[3] Gindre, C., Lussiana, T., Hebert-Losier, K., and Morin, J. B. 2016. “Reliability and Validity of the Myotest® for Measuring Running Stride Kinematics.” Journal of Sports
Sciences 34 (7): 664-70.
[4] Lienhard, K., Schneider, D., and Maffiuletti, N. A. 2013. “Validity of the Optogait Photoelectric System for the Assessment of Spatiotemporal Gait Parameters.” Medical
Engineering & Physics 35 (4): 500-4.
[5] Gouttebarge, V., Wolfard, R., Griek, N., de Ruiter, C., Boschman, J., and van Dieën, J. 2015. “Reproducibility and Validity of the Myotest for Measuring Step Frequency and Ground Contact Time in Recreational Runners.”
Journal of Human Kinetics 45 (1): 19-26.
[6] Blažević, I., Babić, V., and Zagorac, N. 2015. “The Influence of Anthropometric Characteristics on Kinematic Parameters of Children’s Sprinter’s Running.” Collegium
Antropologicum 39 (S1): 57-68.
[7] Schache, A. G., Blanch, P., Rath, D., Wrigley, T., and Bennell, K. 2002. “Three-dimensional Angular Kinematics of the Lumbar Spine and Pelvis during Running.” Human Movement Science 21 (2): 273-93. [8] Thompson, M. A., Lee, S. S., Seegmiller, J., and
McGowan, C. P. 2015. “Kinematic and Kinetic Comparison of Barefoot and Shod Running in Mid/forefoot and Rearfoot Strike Runners.” Gait &
Posture 41 (4): 957-9.
[9] Tubez, F., Forthomme, B., Croisier, J. L., Cordonnier, C., Brüls, O., Denoël, V., Berwart, G., Joris, M., Grosdent, S., and Schwartz, C. 2015. “Biomechanical Analysis of Abdominal Injury in Tennis Serves: A Case Report.”
Journal of Sports Science & Medicine 14 (2): 402-12.
[10] Fellin, R. E., Rose, W. C., Royer, T. D., and Davis, I. S. 2010. “Comparison of Methods for Kinematic Identification of Footstrike and Toe-off during Overground and Treadmill Running.” Journal of Science
and Medicine in Sport 13 (6): 646-50.
[11] Schache A. G., Blanch, P. D., Rath, D. A., Wrigley, T. V., Starr, R., and Bennel, K. L. 2001. “A Comparison of Overground and Treadmill Running for Measuring the Three-dimensional Kinematics of the Lumbo-pelvic-hip Complex.” Clinical Biomechanics (Bristol, Avon) 16 (8): 667-80.
[12] Hasegawa, H., Yamauchi, T., and Kraemer, W. J. 2007. “Foot Strike Patterns of Runners at the 15-km Point during
an Elite-level Half Marathon.” Journal of Strength and
Conditioning Research 21 (3): 888-93.
[13] Sprague, P., and Mann, R. V. 1983. “The Effects of Muscular Fatigue on the Kinetics of Sprint Running.”
Research Quarterly for Exercise and Sport 54 (1): 60-6.
[14] Gazeau, F., Koralsztein, J. P., and Billat, V. 1997. “Biomechanical Events in the Time to Exhaustion at Maximum Aerobic Speed.” Archives of Physiology and
Biochemistry 105 (6): 583-90.
[15] Larson, P., Higgins, E., Kaminski, J., Decker, T., Preble, J., Lyons, D., McIntyre, K., and Normile, A. 2011. “Foot Strike Patterns of Recreational and Sub-elite Runners in a Long-Distance Road Race.” Journal of Sports Sciences 29 (15): 1665-73.
[16] Sheehan, R. C., and Gottschall, J. S. 2012. “A Robust Kinematic Based Event Detection Algorithm that Works for Walking and Running on Both Uphill and Downhill Surfaces.” Presented at 36th Annual Meeting of the American Society of Biomechanics, August 15-18, 2012, Gainesville, FL, USA.
[17] Chan-Roper, M., Hunter, I., Myrer, J. W., Eggett, D. L., and Seeley, M. K. 2012. “Kinematic Changes during a Marathon for Fast and Slow Runners.” Journal of Sports
Science & Medicine 11 (1): 77-82.
[18] Degache, F., Guex, K., Fourchet, F., Morin, J. B., Millet, G. P., Tomazin, K., and Millet, G. Y. 2013. “Changes in Running Mechanics and Spring-mass Behavior Induced by a 5-Hour Hilly Running Bout.” Journal of Sports
Sciences 31 (3): 299-304.
[19] Morin, J., Tomazin, K., Edouard, P., and Millet, G. 2011. “Changes in Running Mechanics and Spring-mass Behavior Induced by a Mountain Ultra-marathon Race.”
Journal of Biomechanics 44 (6): 1104-7.
[20] Siler, W. L., and Martin, P. E. 1991. “Changes in Running Pattern during a Treadmill Run to Volitional Exhaustion: Fast versus Slow Runners.” Journal of Applied
Biomechanics 7 (1): 12-28.
[21] Cavagna, G. A., Franzetti, P., Heglund, N. C., and Willems, P. 1998. “The Determinants of the Step Frequency in Running, Trotting and Hopping in Man and Other Vertebrates.” The Journal of Physiology 399: 81-92. [22] Hreljac, A., and Stergiou, N. 2000. “Phase Determination during Normal Running Using Kinematic Data.” Medical
& Biological Engineering & Computing 38 (5): 503-6.
[23] Dicharry, J. 2010. “Kinematics and Kinetics of Gait: From Lab to Clinic.” Clinics in Sports Medicine 29 (3): 347-64.