Contents lists available atScienceDirect
Geoderma
journal homepage:www.elsevier.com/locate/geoderma
Coupling X-ray computed tomography and freeze-coring for the analysis of
fine-grained low-cohesive soils
Adrien Liernur
a,b,⁎, Andreas Schomburg
c, Pascal Turberg
a, Claire Guenat
a,
Renée-Claire Le Bayon
c, Philip Brunner
baLaboratory ECOS & WSL Institute, Station 2, École Polytechnique Fédérale de Lausanne (EPFL), School of Architecture, Civil and Environmental Engineering (ENAC),
1015 Lausanne, Switzerland
bCenter for Hydrogeology and Geothermics (CHYN), University of Neuchâtel, Rue Emile Argand 11, CH-2000 Neuchâtel, Switzerland cFunctional Ecology Laboratory, Institute of Biology, University of Neuchâtel, Rue Emile Argand 11, CH-2000 Neuchâtel, Switzerland
A R T I C L E I N F O
Editor: Morgan Cristine L.S. Keywords:
Freeze-core
X-ray computed tomography (CT) Soil structure
Soil sampling technique 3D soil model Alluvial soil
A B S T R A C T
This paper presents the coupling of freeze-core sampling with X-ray CT scanning for the analysis of the soil structure offine-grained, low-cohesive soils. We used a medical scanner to image the 3D soil structure of the frozen soil cores, providing X-ray CT data at a millimetric resolution over freeze-cores that are up to 62.5 cm long and 25 cm wide. The obtained data and the changes in gray level values could be successfully used to identify and characterize different soil units with distinctly different physical properties. Traditional measure-ments of soil bulk density, carbon and particle size analyses were conducted within each of the identified soil units. These observations were used to develop a 3D model of soil bulk density and organic matter distribution forfive freeze-cores obtained at a restored floodplain in Switzerland. The millimetric X-ray CT scanning was applied to detect the impact of freeze-coring on the soil structural integrity. This allows identifying undisturbed zones, a critical precondition for any subsequent assessment of soil structure. The proposed coupling is thought to be applicable to a wide range of other low-cohesive soil types and has a large potential for applications in hydrogeology, biology or soil science.
1. Introduction
Soil structure and the associated physical properties are crucial for soil ecosystem services such as habitat for organisms (Voroney, 2007) or soil fertility (Bronick and Lal, 2005). Soil structure formation and aggregation processes are key factors controlling soil stability and erodibility and directly influence the development of the soil as an ecosystem (Barrios, 2007; Bronick and Lal, 2005). The identification of different soil structure types and the quantification of in-situ soil structure characteristics are therefore of critical importance to better understand the complex interactions between soil structure and the associated soil ecosystem services. Detailed observations of the in-situ soil structure additionally provide crucial information to quantify the effects of anthropogenic impacts such as soil compaction. In this regard, the ability to extract soil samples with very low structural disturbances is a prerequisite for the analysis of the soil structure.
Techniques for the extraction of undisturbed soil samples vary de-pending on the scale of the analysis, the sampling environment and the cohesion of the soil (Clayton et al., 1982). Commonly used soil pits and
thin soil layers for macro and micro soil structure analysis are limited to rather cohesive soils and unsaturated environments. In low-cohesive soils such as Fluvisols, Arenosols, Regosols or Histosols classified ac-cording to the World Reference Base (IUSS Working Group WRB, 2014), the conservation of the original soil structure remains a challenging task and, to the best of our knowledge, no sampling technique allows for the undisturbed soil sample extraction for these soil types.
A promising extraction method, although not tested yet in these soils, comes from the freeze-core sampling technique as described inHumpesch and Niederreiter (1993). In this approach, a hollow lance is rammed into the soil, and liquid nitrogen is injected within the lance to freeze the surrounding soil by conduction. The frozen soil core is then pulled out of the soil. This extraction technique was initially developed and used for river and lake sediments analysis (Ryves et al., 2002; Stocker and Williams, 1972). It also found applications in soil science and for the analysis of the hyporheic zone, for example for the identification of the vertical distribution of microbial communities or chemical pollutants (Franchini and Zeyer, 2012; Gan et al., 2006; Moser et al., 2003). In a more recent study,Strasser et al. (2015), used the freeze-cores for the
http://dx.doi.org/10.1016/j.geoderma.2017.08.010
Received 17 March 2017; Received in revised form 25 July 2017; Accepted 4 August 2017
⁎Corresponding author at: Laboratory ECOS & WSL Institute, Station 2, École Polytechnique Fédérale de Lausanne (EPFL), School of Architecture, Civil and Environmental Engineering
(ENAC), 1015 Lausanne, Switzerland.
E-mail address:adrien.liernur@gmail.com(A. Liernur).
0016-7061/ © 2017 Elsevier B.V. All rights reserved.
geohydraulic characterization of river bed sediments.
Freezing the soil before extracting the sample in principle allows obtaining undisturbed samples. However, several aspects can under-mine the integrity of this sampling approach. The freezing and thawing process itself can affect the soil structure. The impact of freezing on the soil structure integrity has been addressed by Singh et al. (1982)in saturated sands and they concluded that the freezing process does not significantly impact the soil structure as long as the pressure around the sample remains constant and the porewater is free to drain during the entire process. In addition to the freezing process, ramming the lance into the soil can also disturb the soil integrity. The insertion of the freezing lance into the soil is leading to an ineluctable process-related structural disturbance due to the displacement and compaction of the soil beneath the lance. This disturbance of the soil structure at the proximity of the freezing lance has already been observed and to avoid biased results, a non-sampling zone around the lance has often been defined (Franchini and Zeyer, 2012; Strasser et al., 2015). In order to sample undisturbed areas within the freeze-core,Strasser et al. (2015) first melted the core and then used a core-cutter to extract subsamples at sufficient distance from the lance and observed that this procedure did not affect the integrity of the soil structure. However, in hetero-geneous soils as studied here, this procedure could potentially lead to structural disturbances related to the thawing and the mechanical ex-traction of subsamples. We therefore suggest tofirst image the whole freeze-core by X-ray Computed Tomography (CT) and subsequently extract subsamples in selected regions for further structural analyses on the still frozen soil cores to avoid potential disturbance of the core.
Recent developments in X-ray CT provide the means to image soils in 3D by non-destructive means. This technology led to significant advances in soil sciences as reviewed inHelliwell et al. (2013). The process of CT image acquisition is described in detail inKetcham and Carlson (2001). CT scans provide a 3D intensity map of the soil where gray level variations are es-sentially related to changes in material density (Rogasik et al., 2003; Sander et al., 2008; Turberg et al., 2014). In the following text, the term radio-density, as a commonly-used term to measure the transparency of a material
to X-rays, will be used to refer to the soil bulk density imaged by X-ray data and expressed by changes in gray level values. The latest scanners used for X-ray CT analysis in soil sciences allow having millimetric to micrometric representations of the soil structure, providing the technical means for soil structure characterization across vastly different spatial scales (Helliwell et al., 2013).
In this paper, we employ X-ray CT scans for freeze-cores to indirectly characterize, without any destructive effect, the detailed structure of the soil. Such a coupling has been proposed in an early article byEscher (1996) who determined the pore-size distribution of freshwater-sediments based on X-ray CT. However, the rapid advances in CT scanning allow for an entirely new level of investigation. Applying the proposed coupling on selected low-cohesive and highly heterogeneous alluvial soils, the aim of this article is twofold. First, the potential of this coupling at evaluating the soil hetero-geneity and identifying soil units with distinctly different soil structure characteristics is evaluated. This allows for a discretization of the soil het-erogeneity into clearly defined soil units characterized by specific soil structure types. Second, the ability to observe and evaluate the impact of the freeze-coring extraction method on the soil structure integrity is assessed. This allows to spatially isolate undisturbed regions of the cores where un-disturbed soil subsamples can be extracted and used for further analyses. To address both parts, millimetric X-ray CT data from a medical scanner were first acquired to image the freeze-core over its entire volume. Micrometric X-ray CT analysis and complementary soil laboratory analyses were then conducted on selected undisturbed soil regions within different soil units to validate the millimetric X-ray CT observations with further precise quanti-tative evaluations. The study was conducted on alluvial soils from a restored alluvialfloodplain area along the Thur River, Switzerland.
2. Material and methods
2.1. Overview of the experimental design
Five freeze-cores were extracted along the Thur River at a distance of about 4 m from the river as illustrated inⒶ inFig. 1and were placed
Fig. 1. Schematic representation of the experimental setup. Thefive extracted freeze-cores are mentioned as FC1, FC2, FC3, FC4 and FC5. The terms “Low”, “Middle” and “High” correspond to the 3 different categories of soil imaged by different radiodensities.
and protected within PVC tubes. The cores were scanned using a medical scanner which provided millimetric resolution X-ray CT data (Ⓑ). Based on these scans, different soil structure categories with varying radiodensities were identified in the five freeze-cores. The limits between these categories were approximately horizontal, as ex-pected in alluvial soils where sediment deposits occur by successive phases. Slices from the still frozen cores could be secured by cutting the cores horizontally at the limits of the identified categories (Ⓒ). From the 5 cores, 6 slices were produced, representing three different categories of radiodensity (Low, Middle and High) as shown inⒹ. Two subsamples (3.7 cm diam. by 5–7 cm height) were drilled per slice (Ⓔ), resulting in 12 undisturbed subsamples for further physical analyses in laboratory (bulk density, particle size and carbon analyses Ⓕ). An additional ex-traction of two slices representing a Low and a High bulk density cate-gories was carried out to perform micrometric X-ray CT analysis and compare the soil structure between these two categories (Ⓖ).
2.2. Freeze-core extraction, preparation and conditioning
2.2.1. Freeze-core extraction
The freeze-cores were extracted in the largest restoredfloodplain of Switzerland, the “Schäffäuli” protected area (47°35′27.93″N, 8°46′21.33″E) located along the Thur River in North-East Switzerland and largely described in several previous studies (Bullinger-Weber et al., 2014; Fournier et al., 2012; Schirmer et al., 2014; Schneider et al., 2011). The pioneer habitat in which the freeze-cores were ex-tracted is characterized by an herbaceous vegetation (Phalaris ar-undinacea). A high sand content (86 ± 16% of the mineral phase) and a low proportion of organic carbon (1.5 ± 0.5% of the total soil) have been measured (Bullinger-Weber et al., 2014). The freeze-core sampling technique used in this study is similar to the one described in detailed in Humpesch and Niederreiter (1993). In short, a metallic hollowed freezing lance is rammed within the soil and some cold liquid nitrogen is poured within the lance to freeze by conduction the surrounding soil and consequently form a solid core. The frozen soil attached to the lance can then be extracted from the soil by using a tripod and a powerful hydraulic pump (Fig. 1Ⓐ). The longer the freezing time the larger the freeze-core diameter. In this study, a 50 cm long and 4.2 cm wide hollow freezing lance was used and pushed within the soil by hand or, when necessary, with a hammer. For each of the extracted freeze-core, about 30 l of liquid nitrogen was poured within a spiral pipe filling the entire lance and freezing the surrounding soil. The liquid nitrogen was injected over a period of 45 min. Extracted from the soil, the freeze-cores were removed from the lance by sawing them vertically in half. Soil parts tightly attached to the freezing lance were gently hammered and separated from the lance. For each freeze-core, all se-parated soil fragments from both halves were then gathered and col-lected within an insulation box. Some frozen CO2was added tofill out the box before the transport and all the fragmented freeze-cores were then stored in a cold room at−25 °C.
2.2.2. Freeze-core preparation and conditioning
Before being scanned, the individual fragments (3–11 per core) of each freeze-core were fixed together by pouring a small amount of water on their edge. The reconstructed entire freeze-cores were then vertically stored infive large PVC tubes (35.5 cm diam., 65 cm height, 0.8 cm thickness). The empty space in between the freeze-core and the internal wall of the PVC tube was filled out and compacted with polystyrene chips to ensure a minimal thermal insulation during the transport to the scanning place and avoid any movement of the freeze-core during the scan (Fig. 2a).
2.3. Milli- and micrometric resolution X-ray CT data acquisition and treatment
2.3.1. Millimetric resolution X-ray CT data acquisition
Millimetric X-ray CT data acquisition was carried out using the LightSpeed VCT (GE Medical Systems) medical scanner of the University Center of Legal Medicine Lausanne– Geneva (CURML) (Fig. 2b). In this scanner, the X-ray source and receptor are rotating around the scanned object which moves longitudinally and provides a sequence of con-secutive scan slices, imaging the entire soil sample volume (Ketcham and Carlson, 2001). This scanner type allows imaging large soil samples in a very short time (about 2 to 5 min). It allows to observe macroscopic features (Wildenschild et al., 2002) and is thus ideal for the analysis of large frozen soil cores. The data acquisition is based on a 64-channel detector with an axial pitch of 0.625 mm. Because of an overlay of the scan slices, the space between consecutive slices was 0.3 mm. The 5 freeze-cores were all scanned with the same parametrization of the scanner, which was specifically developed for geomaterials and already used inTurberg et al. (2014)andAmossé et al. (2015b). X-ray beams emitted from the rotating scanner source were focused on a 1.2 mm focal spot with a peak energy of 120 KeV and a tube current of 500 mA. Each scanned image was defined over a grid of 512 × 512 pixels. The scan was set in a way that the entire freeze-core is encompassed within the transaxial field of view. This led to an average pixel size of 0.65 mm, i.e. a voxel size of 0.65 × 0.65 × 0.3 mm3. The pixel size slightly changed between the freeze-cores due to the variations in freeze-core dimensions and the definition of the corresponding trans-axialfield of view.
Voxel intensities were defined based on the Hounsfield scale com-monly used in X-ray CT analyses to measure the radiodensity of ma-terials (Rogasik et al., 2003). To have more intuitive results, the voxel intensity values initially ranging from−1948 to +2148 (4096 possible gray level values) were normalized between 0 and 100.
2.3.2. Millimetric resolution X-ray CT data treatment
All X-ray CT data treatments and image analyses were conducted
Fig. 2. Freeze-cores and subsamples conditioning before millimetric and micrometric resolution X-ray CT analyses. (a) Conditioning of the freeze-cores in large PVC tubes and filling with protective polystyrene chips. (b) Millimetric resolution X-ray CT analysis of the freeze-cores with a medical scanner. (c and d) Conditioning of the frozen subsamples with hot-melt adhesive within thin PVC tubes.
with Avizo Fire v.9.0 (FEI, 2016) and ImageJ (Schneider et al., 2012). Following a comparative analysis between raw andfiltered scan images (Gaussian and medianfilter), the use of filters was not justified as they did not improve the image quality and contrasts. All the following analyses were therefore directly conducted on the raw scan images. All raw scan datasets were first re-sampled using a circular selection of diameter smaller than the PVC tube to discard all voxels associated to the tubes.
2.3.2.1. Segmentation of the soil into Radiodensity-based Soil Units (RSU). To analyze the soil heterogeneity and observe the spatial distribution of different soil units characterized by distinctly different soil structure types, the total histogram of gray level values was segmented into different categories. One category - mentioned in the following as Void - gathered all gray level values associated to the voids (soil pores and voids left by the freezing lance and the artificial fractures) and to the very light polystyrene chips which couldn't be differentiated from the void. Each other category - mentioned in the following as Radiodensity-based Soil Units (RSU)– represented a soil unit of the soil matrix defined by a specific soil bulk density and soil structure type and visually identifiable on the X-ray CT images by a specific range of gray level values and layering patterns.
To account for these visually observable changes in soil structure forming the basics of the analysis of soil heterogeneity, the segmenta-tion of the histogram was completed following a user-based statistical segmentation method presented in details below and illustrated in Fig. 3.
As afirst step, the number of soil units associated to the soil matrix was established based on a visual observation of the X-ray CT images
and by identifying different zones with distinctly different voxel in-tensity and layering patterns present over the whole voxel population, i.e. over all the extracted cores (Fig. 3a). Each of those identified zones of soil matrix with similar features was used to define the character-istics of a RSU. At the considered millimetric resolution, 5 RSUs were identified over the 5 extracted cores.
The second step consisted of defining and differencing each pre-viously identified category (Void and RSUs) based on their corre-sponding range of gray level value. For that, a stratified sampling as defined in Thompson (2012)was conducted where each category re-presented a single stratum. A random sampling was conducted within each stratum to define its corresponding range of gray level value. Practically, this was done by going through the X-ray images over the 3 dimensions (Fig. 3a) and taking a measure of the voxel intensity in zones where the previously described characteristics of a RSU were observed (Fig. 3b). By randomly measuring 30 gray level values per stratum (Fig. 3b and c), a total of 180 gray level values were collected– 30 for the Void category and 150 for the 5 RSUs. Each gray level value was measured with ImageJ by drawing a circular selection including several pixels belonging to the selected stratum (Fig. 3b) and the mean gray level value over all the included pixels in the selection was kept as the measured gray level value (Fig. 3c).
The average gray level value of each category was then computed (arithmetic mean of the 30 previously measured gray level values) as illustrated inFig. 3c. One average gray level value was therefore ob-tained per category.
In the last step, the corresponding range of gray level values asso-ciated with each category was defined. The threshold values separating each RSU's range were set as the median value between following
Fig. 3. Diagram illustrating the user-based statistical segmentation method developed in this study. (a) Illustration of thefive freeze-cores representing the entire voxel population over which the random sampling was conducted. The red line indicates the location where the XY cross-section in (b) has been extracted as part of the random sampling of gray level values. (b) XY cross-section illustrating the spatial distribution of 3 RSUs, the Void category and the way to measure their corresponding gray level values using a circular selection. (c) Gray level distributions of the pixels included within the 2 gray level measures of RSU2 shown in (b) and their corresponding normal distribution curve. The black dashed line illustrates the gray level distribution of a measure X of RSU2 with X = 3,4…30. The arithmetic mean of RSU2 is computed based on the 30 measured gray level values in that stratum. (d) Division of the histogram between the Void category and the soil matrix and definition of each RSU's gray level interval. In gray, the histogram of the entire voxel population is illustrated and in blue the distribution of the 30 measured gray level values per RSU are presented.
arithmetic means (Fig. 3d). Byfixing the threshold values this way, one could avoid interval overlaps and ensure a maximum of the 30 mea-sured gray level values to fall within the corresponding interval (Fig. 3d). The upper limit of the RSU with the highest gray level values (RSU3 inFig. 3d) wasfixed at the limit where the total histogram meets the X-axis, i.e. at the highest gray level value observed in the soil ma-trix. The obtained threshold values were then applied to the entire voxel population allowing for a complete categorization of the histo-gram.
To validate the performance of this user-based method at seg-menting the Void category from the soil matrix, a comparative analysis with the widely-used and consistent Otsu algorithm (Iassonov et al., 2009; Otsu, 1979) was conducted and illustrated in Appendix A. Forming the core of the analysis on soil heterogeneity, the segmentation of the soil matrix in different RSUs is validated with the complementary soil analysis described below and presented in the Results part.
2.3.2.2. Statistically based profiles. Using the previously described segmentation procedure to separate the Void from the soil matrix, the heterogeneity of the soil matrix was first assessed at the freeze-core scale using two statistical indicators. By computing the mean gray level value and the kurtosis of all voxels associated to the soil matrix at every XY slice, one could draw two profiles along the entire freeze-core depth. While the mean provides indication on the position of a histogram, i.e. on the nature of the material (light VS dense), the kurtosis gives information on the shape of a histogram, i.e. on the heterogeneity of the material (heterogeneous VS homogenous). By drawing such profiles, one could evaluate the evolution of the mean soil radiodensity (mean value profile) and the compositional soil heterogeneity (kurtosis value profile) with depth and observe their variability within and between the freeze-cores. To reduce the noise and only observe the general trends, the profiles were displayed using a median filter and a window size of 10 scan slices.
2.3.2.3. Evaluation of soil disturbance through freeze-coring. The evaluation of the soil structure integrity of the extracted freeze-cores was conducted to evaluate the impact of the freeze-core sampling technique and identify undisturbed zones. Two different soil structure types could be identified. In some locations of the soil, a clear layering pattern was visible, indicating anisotropic structures. In other locations of the core, however, the soil was isotropic, without a clear horizontal layering. In anisotropic structures, vertical X-ray CT cross sections were used to observe vertical soil material displacement caused by ramming the freeze-coring lance into the soil. The horizontal distance between the lance edge and the discontinuity point in initially continuous layer interfaces was defined as the Distance of Disturbance. The curvature of the layer interfaces within the disturbed zone was quantified by the Slope of Disturbance. This corresponds to the linear slope between the discontinuity point and the extremity of the layer interface at the lance edge.
In isotropic structures, the above-cited approach was not applicable because of the lack of visible layering pattern in the soil. In this specific case, the Distance of Disturbance was evaluated using both the“Minimum Intensity Z-projection” and the “Standard Deviation of Intensity Z-projec-tion” functions proposed in ImageJ. By vertically projecting the 3D content of a slice set over a 2D image, information from the 3D re-presentation of the isotropic horizon could be displayed on a 2D image. By following the evolution of the Minimum Intensity and of the Standard Deviation of Intensity with increasing distance from the lance edge on this 2D image, the Distance of Disturbance could be approximated. While the Minimum Intensity representation provides information on the compaction due to the freeze-coring, the Standard Deviation of Intensity informs on the loss of heterogeneity observed at the proximity of the lance.
2.3.3. Micrometric resolution X-ray CT data acquisition
2.3.3.1. Subsample extraction, preparation and conditioning. The micrometric resolution X-ray CT was conducted in the two extreme RSUs, i.e. in the Low and High RSUs, in identified undisturbed zones to have a detailed image of the soil structure and the arrangement of the soil components. A large rotating saw was used to extract and secure two frozen slices containing the identified zones. To enable scanning at high resolution, a 2.5 cm diameter core was drilled in each extracted slice in the previously identified zones.
Each of these two scans at high resolution took approximately 3 h. To avoid any soil structural disturbance due to potential thawing during the long-lasting scan acquisition, a specific preparation of the frozen drilled core was required. For this purpose, each frozen drilled core was inserted within a 4 cm PVC tube and hot-melt adhesive was poured tofill out all the empty space in-between the core and the PVC wall. The fast solidi fi-cation and the solidity of the dried glue allowed preserving the original soil structure (Fig. 2c and d). To avoid any infiltration of the hot-melt adhesive within the soil pores, the core was previously tightly wrapped within a thin layer of plasticfilm. The entire structure was preserved at ambient temperature for at least 42 h before the scan session.
2.3.3.2. Subsample scanning. The micro resolution X-ray CT analyses were conducted at the University of Lausanne (UNIL) with the SkyScan 1173 manufactured by Brucker. The X-rays were emitted with an intensity of 70 KeV and a current of 114μA. The data collection was set with one view for every rotation of 0.225° of the sample, 5 frames captured per view and a time of exposition per frame of 700 ms. The final image resolution of the samples was of 12.1 and 18.1 μm per pixel for the core drilled in the Low and High RSUs respectively. These differences of resolution are explained by the variation of dimensions between the 2 subsamples which has a direct effect on the size of the transaxialfield of view encompassing the entire core. Raw X-ray scan images were reconstructed and further treatment for correction of scanning artifacts (beam hardening and ring artifact (Ketcham and Carlson, 2001)) were completed using the NRecon software. The reconstructed slices were composed of 5′017′600 cubic voxels (2240 × 2240) with an associated intensity value defined on an 8 bits grayscale (256 possible gray level values).
2.3.4. Micrometric resolution X-ray CT data treatment
The raw image dataset was numerically resized with the ImageJ software to get a region of interest free of border artifacts (drilling ef-fect, X-ray CT reconstruction imprecision, beam hardening effect). For that purpose, several layers at the top and bottom of the slice sequence were removed and the entire dataset was re-sampled with a cylindrical shape to discard border voxels. The defined region of interest was re-spectively of 2.5 cm diam. by 3.5 cm height and 1.3 cm diam. by 2.3 cm height for the cores extracted in the High and Low RSUs. Following analyses were conducted on the re-sampled slice sequence.
2.3.4.1. Radiodensity profile. To observe changes in soil structure types between the Low and High RSUs at the micro scale, a similar radiodensity profile as previously drawn for the analysis of the millimetric X-ray CT data was computed. Instead of computing the mean gray level value on voxels associated to the soil matrix only, as previously done, the mean gray level value was computed here by including all voxels of the slice. This allowed accounting for the radiodensity associated to the entire soil (porosity and soil matrix) and not only to the soil matrix.
2.4. Complementary soil analyses
In order to provide ground truth for the variations of physico-che-mical and structural soil properties between the different RSUs identi-fied with millimetric resolution X-ray CT data, complementary physical
analyses were conducted in the laboratory. Following the same proce-dure as the extraction of cores for micro resolution X-ray CT analysis, undisturbed sampling places within each RSU were first spatially identified based on millimetric resolution X-ray CT. Within each of the extracted frozen slice, two 3.7 cm diameter and 5–7 cm high sub-samples were drilled in undisturbed zones to conduct measurements on soil bulk density, particle size distribution and organic and inorganic carbon content. A total of 12 subsamples were extracted within the Low, Middle and High RSUs (Fig. 1).
The soil bulk density of each frozen subsample was measured with the Sand Density method described in detailed inTurberg et al. (2014). A precise metal recipient with known mass and volume (Vcylinder= 196.35 cm3) was initially completely filled with a homo-genous,finely textured sand and weighted to determine the density of the sand. The subsample bulk density (ρsubample) was then determined by inserting the frozen subsample within the recipient, entirelyfilling the remaining volume with the sand and weighing the whole filled recipient. The weight difference with and without the frozen subsample (Msand), the determined sand density (ρsand) and the weight of the frozen subsample (Msubample) were then used to compute the soil bulk density using Eq.(1):
= −
( )
ρ M V subsample subsample cylinder Mρsand sand (1)All frozen subsamples were previously wrapped in a thin plasticfilm to avoid any contact with sand grains. Conscious of the risk of creating air bubbles when wrapping the soil core with the plastic film, the wrapping was carried out with a special care and to the best of our possibilities. Because the density was measured on the frozen sub-samples, the measured density corresponds precisely to the wet (frozen) bulk density. This ensures as well the coherence of the comparison with millimetric X-ray data where the imaged radiodensity corresponds to the same wet (frozen) bulk density.
Sand (2000–200 μm), silt (50–2 μm) and clay (< 2 μm) weight fractions were measured on the dried and sieved (2 mm) soil fraction of each subsample using the Robinson pipet method (Gee and Bauder, 1986). Organic matter destruction was achieved by the addition of H2O2 and particles dispersion was ensured by the addition of 15 ml Na2P2O7 (40 g/l). Carbonates which highly contribute to the soil structuration process were not removed.
The weight fractions of Total Carbon (TC) and Inorganic Carbon (IC) were measured on the dried and grinded soil with the Shimadzu SSM-5000A analyzer. The TC was evaluated following a combustion and catalytic oxidation at 680 °C, while IC was measured by an acidification reaction by addition of liquid hydrochloric acid (HCl). The Total Organic Carbon (TOC) weight fraction was calculated as the difference between TC and IC.
2.5. Statistical analyses
The following statistical analyses were performed with R v. 3.3.2 (R Core Team, 2016) to compare the X-ray CT data, the soil composition and the soil bulk density between the different RSUs.
2.5.1. Analysis of variance (ANOVA)
Two one-way ANOVAs followed by post hoc Tuckey tests were conducted to compare the RSUs based on their associated voxel in-tensity and on their measured soil bulk density and observe if they statistically significantly differ from each other. The first ANOVA was conducted based on the 30 intensity measurements used to describe each RSU and observe the ability to distinguish different soil units based on the changes in voxel intensity. The second analysis was con-ducted to compare the measured wet soil bulk densities in each RSU and observe if they were in line with the variations in voxel intensity and radiodensity.
A multiple regression was conducted to observe the contribution of the different soil components to the variations of the soil bulk density using the lm (fitting of linear model) function proposed in R. This function allows to carry out linear regression with one or many ex-planatory variables and assess their degree of contribution towards the response variable. The statistical significance of the contribution of each variable was assessed by computing the p-value with confidence level at 95%. The simple model included TOC, IC, Sand and Silt as ex-planatory variables and the Soil wet bulk density as response variable.
3. Results
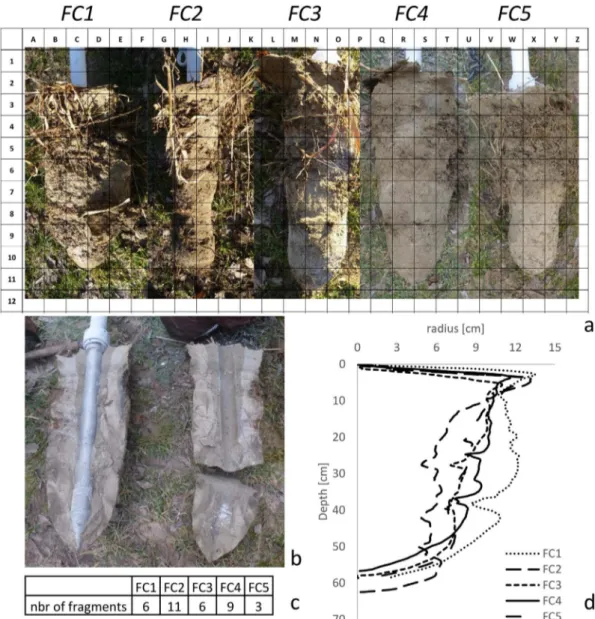
3.1. Freeze-core external descriptive characteristics
Photos (Fig. 4a) as well as data describing the freeze-cores shape and size (Fig. 4b–d) are presented inFig. 4. Over the 5 freeze-cores, their external appearance is characterized by 2 color types of the Munsell code color system and is associated with changes in organic matter amount, nature (leave, root or wood residues) and degree of decomposition. InFig. 4a, a Dark-Grayish Brown (2.5Y 4/2) color is observed in the bottom half of FC3, FC4 and FC5 (M7-Y11) in highly mineral horizons characterized by a low content of organic compo-nents. Organo-mineral horizons with the presence of fragmented or un-fragmented leaves and higher stage of organic matter decomposition are defined by an olive brown color (2.5Y 4/3) and are randomly dis-tributed as layers within the freeze-cores. Examples of this horizon type are visible in Fig. 4a in B4-E5, B9-D9, Q5-T6 and W4-Y5 (non-ex-haustive).
3.2. Freeze-core 3D structure illustration and characterization of soil matrix
3.2.1. Observation of soil heterogeneity based on millimetric resolution X-ray CT images
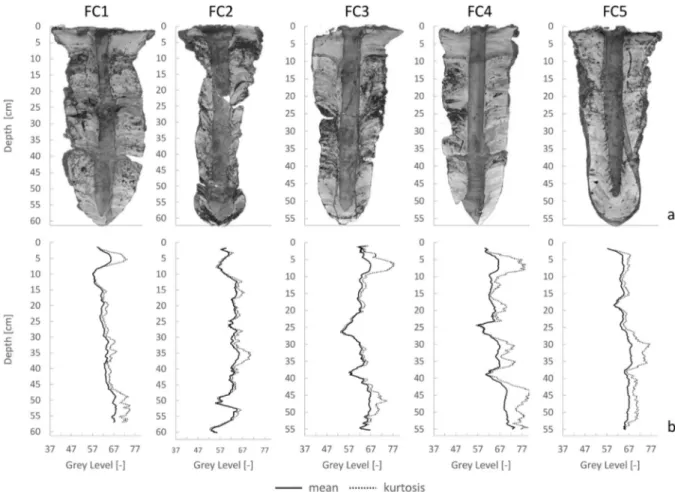
Millimetric resolution X-ray CT images (Fig. 5a) illustrate vertical and horizontal spatial variations of soil structure types within and be-tween the freeze-cores. This soil organizational heterogeneity is based on both changes in soil material density represented by variations in gray level values and soil layering patterns represented by clear vertical changes in gray level values. Mineral zones characterized by Dark-Grayish Brown color inFig. 4a appear inFig. 5a (FC4: 45–50; FC1 & FC3 & FC4: 5–10 cm) with a uniform light gray level value (unicolor appearance) and strong anisotropic soil structures (superposition of mineral grains deposited along the soil layers with a strong horizontal directionality). On the other hand, organic residues and organo-mineral zones defined by an Olive brown color inFig. 4a are associated with a dark or medium gray level value inFig. 5a (FC2: 5–10; FC1: 10–15; FC3: 25–30; FC4: 25–27 cm).
3.2.2. Characterization of the soil matrix based on X-ray CT data After the normalization of the linear Hounsfield grayscale to the gray level value scale of 0–100 and following the segmentation of the histogram with the user-based statistical segmentation method, the soil matrix fraction is defined by the gray level interval ranging from 37 to 80, i.e. 43% of the total available gray level values. Gray level values ranging from 0 to 37 form the Void category. The remaining voxels with gray level values between 80 and 100 represent a negligible fraction of 0.001% of the total available gray level values and are associated to the highest density-based materials.
3.2.3. Description of soil organizational heterogeneity based on the mean and the kurtosis profiles of the voxel intensity
Statistical indicators such as the mean and the kurtosis allow as-sessing the compositional nature and degree of homogeneity of the soil. These statistical indicators based on voxel intensity are illustrated in Fig. 5b. By associating the X-ray images (Fig. 5a) with the obtained profiles (Fig. 5b), it can be observed that the variations of the mean
value are highly related to visual changes in organic and mineral con-tent. While high mean values correspond to dense mineral soil horizons (FC1: 5–10, FC3: 5–10 or FC4: 45–50 cm), low values are associated to lighter organo-mineral horizons rich in organic residues (FC1: 10–15, FC2: 5–10 or FC4: 24–27 cm). Observing changes in the kurtosis values, one can observe that high kurtosis values are associated to composi-tionally homogeneous horizons, while low values express rather het-erogeneous organo-mineral horizons. Additional illustrative informa-tion concerning these observainforma-tions is presented inAppendix B.
Based on quantitative assessments (Fig. 5b), it appears that FC4 is defined by the most heterogeneous soil organization and provides a large span of different possible soil structure types. Highly homo-geneous mineral soil horizons defined by a high kurtosis value and heterogeneous organo-mineral horizons with low kurtosis and mean values are clearly visible inFig. 5b and further detailed inAppendix B. This high stratification of horizons with different soil structure types, typically expected in Fluvisol subject to recurrent flooding events, makes this freeze-core FC4 the most appropriate for further analyses of soil structure heterogeneity.
3.3. Segmentation of the soil into Radiodensity-based Soil Units (RSU) based on X-ray CT data
The identification of the RSUs based on voxel intensity variations (Fig. 5a), changes in layering patterns and on specific signatures of the computed profiles (Fig. 5b) led to the definition of five RSUs, as de-scribed inTable 1.
Fig. 6a illustrates the median gray level value and the variability for thefive RSUs after the measurements of the 30 gray level values per soil unit. The conducted ANOVA and post hoc Tuckey tests indicate that all RSUs are significantly different (p < 0.0029) based on their associated radiodensity. The highest variabilities of measured intensities are ob-served in Low and Low-Middle RSUs, while the variabilities in the High and Middle-High ones are the lowest. The uniform mineral texture of these high RSUs allows a clear visual identification and subsequent segmentation. Low RSUs associated with light organic components of the soil matrix or to a mixture of organic and mineral matter are subject to variations in the mixture composition leading to higher variability in the voxel intensity values. An illustration of the performed segmenta-tion of the soil matrix in different RSUs is presented inAppendix C. In
Fig. 4. Shape, dimension and number of individual fragments of the 5 extracted freeze-cores. (a) Photo of the 5 freeze-cores right after the extraction. (b) Fragmentation of FC4 after longitudinal sawing of the freeze-core in half. (c) Number of artificially made fragments per freeze-core. (d) Computed mean radius profile for each freeze-core based on millimetric resolution X-ray CT data.
the following, only the 2 extreme RSUs (Low and High) and the middle one (Middle) are selected to conduct further analyses in order to only capture the central and extremes of soil structure types.
InFig. 6b, the voxel intensity intervals corresponding to the 3 se-lected RSUs (Low, Middle and High) are displayed over the general voxel intensity histogram including all the matrix-related voxels of the 5 freeze-cores. The Low, Middle and High RSUs integrate 10%, 21% and 31% of all the voxels associated to the soil matrix. Based on this result and the description of the RSUs, only 10% of the soil is composed of coarse untransformed organic residues juxtaposed with mineral parti-cles (Low RSU). Homogeneous organo-mineral or highly dense and homogeneous mineral soils represent 21% and 31% of the total soil (Middle and High RSUs, respectively). The negatively skewed voxel in-tensity distribution and the histogram's modal value of 68.0 confirm that most of the soil is composed of dense mineral components.
Fig. 6c shows an example of the segmentation into the 3 selected RSUs of a vertical cross section of FC4. The distribution of the voxels associated to the 3 selected RSUs leads to a horizontally stratified soil. Based on the segmentation of the millimetric resolution X-ray CT data into the 3 RSUs and the observation of their spatial distribution, 2 Low horizons (FC1: 8–12 and FC4: 23–27 cm (Fig. 5a)), 2 Middle horizons (FC3: 41–46 and FC4: 8–13 cm) and 2 High horizons (FC1: 48–53 and FC4: 42–47 cm) were identified and extracted from the freeze-cores and used for complementary analyses.
3.3.1. Complementary soil analyses
The complementary analyses conducted on 4 replicates per RSU and subsequent post hoc Tuckey tests indicate that the 3 RSUs (Low, Middle and High) are significantly different from each other (p < 0.05) based on their measured wet soil bulk density values (Fig. 6d). This confirms
Fig. 5. X-ray CT images and corresponding quantitative profiles. (a) X-ray CT images of the 5 extracted freeze-cores and corresponding mean and kurtosis profiles of voxel intensity of the soil matrix (b). In (b), the nondimensional kurtosis value is added to the mean value.
Table 1
Name and description of the 5 identified RSUs. The provided soil sample examples refer to theFig. 5a. The mention right/left corresponds to the considered side from the freeze-core center.
RSU name Soil unit description Soil sample example
High Highly dense and homogeneous mineral zone with clearly visible anisotropy in soil layers. Typically present in compacted zones at the bottom of the freeze-cores or close to the freezing lance.
FC4: 45–50 cm Middle-High Dense and homogeneous mineral zone with visible anisotropy in soil layers. Typically present in the freshly deposited horizons at the top of
the freeze-cores.
FC4: 3–7 cm Middle Homogeneous (bioturbated) organo-mineral zone without visible directional soil layer. Typically surrounding biologically made
macro-pores (earthworm burrows).
FC4: 8–10 cm Low-Middle Heterogeneous zone corresponding to a mix of mineral matter with fragmented organic matter without visible directional soil layer.
Typically present at the proximity of organic residues.
FC3: 27–30 cm (left) Low Organic zone associated to coarse untransformed organic residues juxtaposed with mineral particles. Typically originating from leaves or
wood residues.
that variations in voxel intensity on millimetric resolution X-ray CT images are clearly related to changes in wet soil bulk density. The ob-tained wet soil bulk density values are ranging from 1.32 to 1.60 g/cm3. The results from the carbon and particle size analysis as well as from the multiple regression are shown in Table 2 and indicate that the amount of TOC is the only measured parameter which significantly contributes to the wet soil bulk density variations. Both variables are highly negatively correlated (ρ = −0.86) as visible onFig. 6e. A 30% decrease of TOC is observed on average from the Low to the High RSUs. Among the other measured soil parameters, the IC remains stable over the 3 RSUs indicating a rather constant chemical composition of the mineral phase in the soil. The particles size distribution is similar be-tween the Low and Middle RSUs, but is significantly different for the High one. This textural difference does, however, not have a statistically significant effect on the soil bulk density (p > 0.97).
3.4. Evaluation of the freeze-coring method impact on the soil organization and soil structure integrity
The impact of the freeze-core sampling technique on the soil structure integrity is illustrated inFigs. 7 and 8with FC4. The pre-viously demonstrated high organizational and structural heterogeneity of this freeze-core makes it a relevant candidate to evaluate the in flu-ence of the soil texture and structure on the amplitude of the dis-turbance.
3.4.1. Impact on soil structure integrity in anisotropic horizons
Based onFig. 7and the analysis of soil layer discontinuity, one can observe that the freeze-coring leads to the formation of a disturbed zone along the freezing lance. Based on the vertical cross sections images (Fig. 7b–d), it appears that the disturbed zone tends to disappear with increasing distance from the center. While structural disturbances are still visible at a tangential distance of 1.1 cm from the freezing lance edge (Fig. 7c), the continuity of the soil strata at 4.7 cm (Fig. 7d) in-dicates the presence of a rather undisturbed soil structure.
The Distance of Disturbance based on visual identification of dis-continuity in soil strata and marked by red dots inFig. 7b ranges from 1.2 to 5.7 cm from the freezing lance edge with an average of 3.7 ( ± 1.2) cm. The average Slope of Disturbance within the disturbed zone is of 60 ( ± 40) %, while it is of 11 ( ± 10) % at 4.7 cm from the freezing lance edge. The high variability within both measured para-meters reflects the variations of amplitude of disturbance due to the heterogeneity in soil structure types.
3.4.2. Impact on soil structure integrity in isotropic horizons
The impact of the freeze-coring on the soil structure in isotropic structures (marked by a lack of visible soil layer) is illustrated with the structurally heterogeneous horizon highlighted inFig. 7a and detailed inFig. 8a. Two soil structure types are observed within this horizon and are delimited by the Zone 1 (Z1) and the Zone 2 (Z2) as illustrated in
Fig. 6. Segmentation of the freeze-cores into RSUs based on X-ray CT data and comparison with the measured bulk density and the organic content. (a) Voxel intensity distribution for the 5 RSUs based on the measurements of 30 intensity values per RSU (stratified sampling). (b) Total histogram of the whole voxel population and voxel intensity distribution of the 3 selected RSUs (Low (gray), Middle (yellow) and High (red)). (c) Vertical cross section of FC4 at 2 cm from the freezing lance edge and illustration of the spatial distribution of the Low, Middle and High RSUs after segmentation of the histogram with the user-based statistical segmentation method. (d) Measured wet soil bulk density distribution for the 3 selected RSUs based on the 4 frozen subsamples extracted per RSU. (e) Correlation between the soil bulk density and the organic carbon content (TOC) and bestfit linear model.
Table 2
Proportions of soil components for each of the 3 RSUs and p-values resulting from the multiple regression. For each soil component, the mean value based on 4 replicates is given and the associated standard deviation value is written in brackets.
Measured parameters
RSUs p-Value
(multiple regression)
Low Middle High
Soil wet bulk density g/cm3 1.35 ( ± 0.03) 1.44 ( ± 0.06) 1.56 ( ± 0.04) –a TOC % 3.99 ( ± 0.30) 3.16 ( ± 0.68) 2.81 ( ± 0.26) 0.002 IC % 4.07 ( ± 0.12) 3.98 ( ± 0.21) 4.07 ( ± 0.30) 0.414 Clay % 7.57 ( ± 0.92) 7.57 ( ± 1.41) 10.09 ( ± 3.43) –b Silt % 23.69 ( ± 3.54) 24.64 ( ± 4.42) 32.61 ( ± 13.81) 0.977 Sand % 68.74 ( ± 4.45) 67.79 ( ± 5.75) 57.3 ( ± 17.23) 0.991
aThe soil wet bulk density was the answer variable of the multiple regression. bThe Clay proportion was computed based on the proportion of Sand and Silt. The
Fig. 8b. While Z1 is characterized by the presence of tubular porosity structures typically associated with biological activity (mainly earth-worms), Z2 is defined by a uniform interstitial porosity distribution. The representation of the porosity (Fig. 8b) and the resulting 2D images from the“Minimum Intensity Z-projection” (Fig. 8d) and the“Standard Deviation of Intensity Z-projection” (Fig. 8c) functions indicate a com-paction and a homogenization around the freezing lance in both Z1 and Z2. Visually, both effects are observed through a decrease of porosity leading to an increase of the radiodensity and a decrease of the soil heterogeneity at the proximity of the freezing lance.
InFig. 8e, the stabilization of the minimum intensity and the in-tensity standard deviation profiles at 3.9 cm and 2.9 cm in Z1 and Z2 respectively indicate a transition from disturbed to undisturbed zones. In both Z1 and Z2 compaction and homogenization lead to a density increased by a factor of two and a loss of soil heterogeneity within the disturbed zone. The difference in the obtained profiles between Z1 and Z2 as well as the difference in the Distance of Disturbance as visible in Fig. 8e highlight the direct effect of the soil structure type on the am-plitude of the disturbance.
3.5. Micrometric resolution X-ray CT
Fig. 9a indicates the location of the subsamples extracted in FC3 in the Low and High RSUs and scanned at micrometric resolution. The 3D soil structure of the subsample extracted in the High RSU is illustrated in Fig. 9b and shows a highly homogenous soil composition and soil structure (Fig. 9b and d). These visual observations are confirmed by the relatively constant radiodensity profile along the subsample depth (Fig. 9c). The computed radiodensity ranges from 64.5 to 72.8 with an average value of 68.8 ( ± 2.8) over the 255 possible gray level values defining the various soil components. Soil particles are homogeneously distributed over the whole subsample volume and no deformation of the soil structure is observed. At corresponding depth inFig. 5a, this structurally homogenous subsample correlates with a high kurtosis value and confirms the association of this specific signature with a homogenous mineral soil horizon.
The extracted subsample in the Low RSU shows a heterogeneous soil structure and soil composition. The soil composition is made of a juxta-position of organic residues and mineral matter which diversely imbricate and create a heterogeneous inter-particles porosity (Fig. 9e and g). The radiodensity profile illustrated inFig. 9f ranges from 31.3 to 99.0 with an average value of 69.4 ( ± 23.2) %. The existence of inter-component voids and the horizontal deposition of organic residues are indicators of undisturbed soil structure. At corresponding depth inFig. 5a, this struc-turally heterogeneous subsample correlates with a low kurtosis value and validates the association of these specific signatures to a heterogeneous organo-mineral horizon rich in un-transformed organic residues.
4. Discussion
4.1. Extraction and subsequent handling of freeze-cores
The obtained results show the feasibility of the proposed coupling between the freeze-coring and the X-ray CT to study soil material. Measurements of the soil humidity on the day of the freeze-core ex-traction indicate a waterfill pore space varying from 31 ( ± 2) % at 15 cm, 52 ( ± 5) % at 30 cm and 55 ( ± 5) % at 45 cm depth (Luster, Jörg, WSL, personal communication, February 14, 2017). To the best of our knowledge, this is thefirst time that freeze-cores were taken from unsaturated alluvial soils. The soil structure could be preserved during the millimetric resolution X-ray CT scan through developing an ade-quate insulation and protective packaging that allowed maintaining the core in a frozen state. The results from the micrometric resolution X-ray CT show that no structural disturbance was induced during the drilling process of subsamples. Indeed, looking atFig. 9b, d, e and g, no visual indicator of structural disturbance such as an increase of the radio-density due to compaction or a discontinuity in the soil layering is detected, while it could be clearly observed on the millimetric X-ray CT data. This indicates that the preservation of the soil core frozen for mechanical extraction appears as an appropriate solution to analyze the undisturbed in-situ soil structure, especially in structurally hetero-geneous soils.
Fig. 7. Assessment of freeze-core structure integrity in zones with anisotropic structures based on X-ray CT data of FC4. (a) External view. The 3 vertical lines indicate the positions of vertical cross sections at the center (b) and at tangential distances of 1.1 cm (c) and 4.7 cm (d) from the freezing lance edge. In (a), the two horizontal lines delimit a zone with isotropic structures which disturbance effect is detailed inFig. 8. Red dashed lines highlight visible layer interfaces marked by clear changes in gray level values. Red dots illustrate the visual limits of the disturbed zone and correspond to the discontinuity points from initially continuous interface layers.
4.2. Characterization of the soil structure heterogeneity
4.2.1. Identification of soil units
The computation of the mean and kurtosis profiles of the voxel in-tensity associated to the soil matrix for the five freeze-cores as illu-strated inFig. 5was conducted to observe changes in soil organization and composition within and between the extracted freeze-cores. The advantage of such a representation arises from the integrated in-formation over the whole freeze-core volume and provides quantitative, 3D data on the soil organizational heterogeneity. The assimilation of profile specific signatures (plateau, peaks) with corresponding 2D vi-sual soil structure allowed developing keys of interpretation and ob-serve the spatial distribution of soil units based on the different profile signatures (Fig. 5andAppendix B). These changes in profile signatures make the mean intensity value a suitable indicator to assess the soil matrix vertical heterogeneity over the whole freeze-core depth, i.e. to account for the organizational heterogeneity due to sediment deposits in successive phases (Fig. 5). The horizontal heterogeneity, i.e. the heterogeneity due to soil components of different nature, observed over each scan slice is however highly smoothed out by the averaging effect of the mean value, while it is well represented by the kurtosis profile. By providing an indication of the shape of the histogram, the kurtosis
proved to be indeed an effective indicator to assess the homogeneity in soil composition over each scan slice (Fig. 5andAppendix B).
The application of these two statistical parameters is recommended in alluvial soils characterized by inherent high variations in soil composi-tion (variacomposi-tions in sediment texture, organic material coming from dif-ferent origins). For stratified soils with a rather homogeneous soil com-position, it is expected that most of the soil structure variations would already be sufficiently described using the mean intensity profile only. By discarding the voxel associated to the soil porosity in the computation of the different profiles, information related to the soil structure hetero-geneity is lost. In these highly dynamic soils exposed to repeatedflooding events, the porosity is indeed expected to highly vary between the dif-ferent horizons formed by the successive sediment deposits as clearly observed on the micro resolution X-ray CT images (Fig. 9).
4.2.2. Comparison of soil units
Based on the general principles of X-ray CT (Ketcham and Carlson, 2001), changes in voxel intensity are closely related to changes in material density. Studying peat soil structure and various types of loamy and silty soils respectively,Turberg et al. (2014)andRogasik et al. (2003)have shown the potential to observe changes in soil bulk density based on variations in voxel intensity. Based on the visual identification of different soil units from the previously drawn profiles and from the X-ray CT cross sections the direct correlation between the voxel intensity and the frozen wet soil bulk density has also been de-monstrated in the present analysis. This positive result illustrates the significant advantage of the proposed coupling. Indeed, it appears that non-destructive millimetric resolution X-ray CT provides sufficient in-formation to observe and characterize different soil structure types over the whole freeze-core volume which significantly differ based on their soil bulk density. This ability to identify soil units which differ by their soil bulk density (RSUs) and virtually observe their spatial distribution is of great interest to conceptualize the organization of the soil and to better understand the main processes behind the soil structure forma-tion. Modeling of water or pollutants infiltration and gas exchanges processes highly affected by changes in soil structure and soil bulk density (Katuwal et al., 2015; Lepore et al., 2009; Luo et al., 2010; Wildenschild et al., 2002) would also benefit from this coupling as a 3D model of soil bulk density distribution is made possible at the freeze-core scale.
4.2.3. Characterization of soil units
In order to further develop the proposed 3D model of RSUs spatial distribution and relate the changes in soil bulk density to soil compo-sition variations, the soil compocompo-sition of each RSU has been precisely described by measuring the carbon content and the particle size dis-tribution. The results from the conducted analyses indicated that over all the measured parameters, only the organic carbon content does significantly contribute and explain the variations of soil bulk density observed between the different selected RSUs in this specific study. The mineral fraction as well as the chemical composition (measured as the proportion of inorganic carbon) did not have any significant contribu-tion on the variacontribu-tions of soil bulk density. These observacontribu-tions are va-lidated by the micro resolution X-ray results where the presence of organic residues is clearly visible in the Low RSU (Fig. 9e and g), while completely absent in the High RSU (Fig. 9b and d). The measurement of the soil porosity, which appears to represent a high proportion of the soil in the Low RSU (Fig. 9g), would have further improved the model and the characterization of the soil structure. However, such a mea-surement was not carried out for the subsamples as it would have re-quired a thawing of the samples and thus a potential disturbance to the soil structures and subsequently porosity. Note that using a stabilizing agent (as has been done for the micrometric resolution X-ray CT ima-ging (Fig. 2c)) to preserve the soil structure during the thawing phase and measure the particle density and subsequently the porosity was not a solution as the subsample couldn't be extracted from the stabilizing
Fig. 8. Assessment of freeze-core structure integrity in zones with isotropic structures. (a) 3D illustration of the top 20 cm of FC4 and limits of the analyzed isotropic zone (black lines and arrow). (b) Top view of the porosity network in the studied zone and division into tubular (Z1) and uniform (Z2) porosity shape zones. (c and d)“Standard Deviation of Intensity Z-projection” and “Minimum Intensity Z-projection” respectively over the 218 scan layers forming the studied isotropic zone (images are defined based on an 8 bits gray scale). (e) Profiles over the dashed and dotted lines presented in (c) and (d) illustrating the compaction and loss of soil structural heterogeneity around the freezing lance.
agent (hot melt adhesive) without causing significant structural dis-turbances.
Starting from the identification of soil units based on voxel in-tensities, it has been observed that these soil units differ by their wet soil bulk density which is statistically significantly explained by varia-tions in organic carbon content. Thefinal obtained model based on the proposed coupling provides therefore a possible 3D representation of organic matter distribution within the extracted cores. Although the development of such a model is thought to be generally applicable with the proposed coupling, the success of it will highly depend on the studied soils and especially its composition.
4.3. Freeze-coring and structural integrity
The evaluation of the internal soil structure with millimetric re-solution X-ray CT data allows a location-specific assessment of the soil structural integrity related to freeze-coring. The impact of this sampling technique on the soil structure integrity and especially the disturbance related to the insertion of the freezing lance within the soil has already been observed and discussed (Franchini and Zeyer, 2012; Niederreiter and Steiner, 1999; Strasser et al., 2015). However, because of a lack of non-destructive means to observe the 3D internal soil structure, only an approximate estimation of the zone of disturbance could be provided. In previous freeze-coring approaches, a buffer zone surrounding the freezing lance was defined and areas within this buffer zone were not taken into account.Franchini and Zeyer (2012)extracted freeze-cores from saturated wetland soils. They did not use soil within a distance of 1 cm from the freezing lance for their subsequent analysis. Strasser et al. (2015) mentioned that structural disturbances might range be-tween 3 and 6 cm from the freezing lance. While such approximate estimations of the distance of disturbance might be sufficient in textu-rally and structutextu-rally homogeneous soils or sediments, the high varia-bility of the amplitude of the disturbance observed inFigs. 7 and 8 indicates that a location-specific identification of the soil structure
integrity is necessary for heterogeneous soils. This appears especially true in the presence of coarse organic residues of various nature (wood, leaves) where a visual identification of the zone of disturbance is especially difficult.
In anisotropic structures defined by clearly visible layer interfaces, the discontinuity in soil layers was crucial in the estimation of the distance of disturbance to the freezing lance. Based on the X-ray CT images, a distance of disturbance ranging from 1.2 to 5.7 cm with an average of 3.7 ( ± 1.2) cm has been observed. This is in line with the evaluation of the compaction and homogenization observed in more isotropic soil horizons. Such values align with the range mentioned by Strasser et al. (2015). However, a precise determination of the zones of disturbance is obviously more efficient and useful compared to as-suming afixed distance from the lance to separate disturbed from un-disturbed zones. This leads to a twofold advantage. The operator can first precisely identify undisturbed zones and therefore save soil ma-terials and optimize the number of soil structure analyses. In addition, the operator can fully rely on the measured soil characteristics and be confident on having an undisturbed representation of the in-situ soil structure.
4.4. Applications and perspective of the method
Obtaining detailed information and a 3D representation of the in-situ soil structure at the freeze-core scale appear of great interest for various applications such as hydrogeology, and especially surface water - groundwater interactions, as discussed byBrunner et al. (2017). A repeated application of freeze-cores in streambeds or alluvial plains could help to track the high transience of physical properties that occur influvial environments (Gianni et al., 2016; Partington et al., 2017). The 3D representation of soil and the high resolution offered by mi-crometric resolution X-ray CT allows the simulation of infiltration and recharge dynamics on a pore scale, thus providing valuable, process based information related to hydrogeological applications such as the
Fig. 9. Micrometric resolution X-ray CT analysis of undisturbed subsamples within High and Low RSUs. (a) 3D illustration of FC3 with vertical cut at 2.5 cm from the freezing lance edge. The boxes indicate the sampling zones for the High (top) and Low (bottom) RSUs. (b and e) 3D representations of the extracted samples in the High and Low RSUs with (c) and (f), their respective radiodensity profile. (d and g) Horizontal cross sections of (b) and (e) at 5.1 cm and 23.8 cm depth respectively.
management of riverine ecosystems or remediation strategies in con-taminated sites (Zhang et al., 2016).Katuwal et al. (2015)who studied pore network characteristics and focused on simulation of gas ex-changes within the soil developed predictive models for air perme-ability and gas diffusivity in regenerated agricultural soils based on X-ray CT data.
Apart from such modeling approaches, the proposed approach can provide critical information on the impact of biological activity on soil structure formation or rehabilitation.Amossé et al. (2015b), conducting experiments under controlled conditions (microcosms), showed for example the ability to evaluate the effects of earthworm activity on the soil structure formation in alluvial soils using non-destructive X-ray CT. The coupling now allows to extrapolate the experimental design of Amossé et al. (2015b)to thefield.Jégou et al. (2002)andLangmaack et al. (2002) did also successfully use the non-invasive X-ray CT to evaluate the impact of soil compaction on earthworm burrows and the importance of earthworm activity in the rehabilitation of compacted arable soils. The proposed coupling is also thought to be of interest to a better understanding and characterization of heterogeneous urban soils which have been observed to be similar to alluvial soils in many points (Amossé et al., 2015a) but only slightly investigated until now.
The proposed coupling is thought to be applicable to a large span of different soil types. Showing in this paper the success of the method when applied to fine-grained low-cohesive soils, it is expected that coarse soils - more prone to be successfully extracted by the freeze coring technique because of a large inter-poral connectivity – with sufficient humidity could be successfully analyzed using the proposed coupling. Observing rather similar decimetric to pluri-decimetric freeze-core dimensions when extracted in different soil materials (~ 15 cm diameter in wetland soil (Franchini and Zeyer, 2012); 20–50 cm diameter in river bed sediments (Strasser et al., 2015)), the resolution of the X-ray CT scan images directly impacted by the freeze-core dimensions is expected to remain adequate for the analysis of different soil materials and high enough to observe structural changes. Although not falling within the scope of the paper, questioning the upscaling possibility of the proposed 3D model is of main interest for further applications to larger areas. Although quantifying and assessing the soil heterogeneity could be successfully achieved at the considered small-scale, i.e. freeze-core scale, an upscaling of those observations at higher scales and the possibility of developing a 3D model covering larger areas appear highly limited. Small-scale measurements are gen-erally hard to upscale and this is thought to be even more emphasized in spatially heterogeneous soils. However, small-scale observations re-main essential at informing on larger scales (Vereecken et al., 2007; Zhu and Mohanty, 2002).
5. Conclusions
In this paper, we proposed to couple freeze-core sampling with the non-destructive X-ray CT analysis with the aim to analyze the organi-zation and structure of fine-grained low-cohesive soils. In order to evaluate the potential and the limits of the proposed coupling, it was applied in a highly complex and heterogeneous sandy soil of a pioneer habitat of a restoredfloodplain area (Thur River, Switzerland) subject to recurrentflooding events.
The application of the freeze-core sampling technique in low-co-hesive and partially saturated soils could be demonstrated by
successfully extractingfive large conical-shaped freeze-cores. The het-erogeneity in shape and volume between the extracted freeze-cores went along with spatial changes in soil composition.
Soil structure analyses conducted on freeze-cores have until now required melting the soil core to mechanically extract subsamples which may potentially cause soil disturbances. By coupling freeze-core sampling with the non-destructive X-ray CT, we add significant value to the freeze-coring itself. A 3D representation of the undisturbed soil structure over the whole freeze-core volume is made possible and the core preserved in its frozen state can be used for further analyses. Moreover, we could observe and quantify the soil organizational and structural heterogeneity and subsequently quantify the impact of the sampling technique on the soil structure integrity over the whole freeze-core volume. Based on X-ray CT data at millimetric resolution and some physical soil analyses conducted in the laboratory on targeted undisturbed regions within the frozen cores, a 3D model of soil unit distribution could be developed and used to spatially map changes in soil bulk density and soil material composition at the freeze-core scale. The proposed coupling provided in addition a detailed quantitative evaluation of the sampling impact on the soil structure integrity, especially due to the insertion of the freezing lance within the soil. Based on the obtained results and the high variation of the disturbance amplitude, it appears that an a priori evaluation of the structural dis-turbance is a prerequisite to identify undisturbed zones and therefore avoid biased results of measured soil structural properties.
The proposed coupling is thought to significantly enrich further researches of soil structure in low-cohesive soils and might be inter-esting for different fields of investigation. Focusing on the freeze-core scale, the analysis of small-scale transport, adsorption phenomena, development of microbial habitats or sediment deposition and erosion processes would highly benefit from such a coupling. The ability to extract soil cores from low cohesive materials, generate a 3D model of their soil structure over their whole volume and precisely target un-disturbed places where further detailed analysis can be conducted ap-pear as the main advantages of the proposed coupling.
Acknowledgments
The authors would like to thank the CCES RECORD_Catchment project (39-01) and especially Dirk Radny for providing us the au-thorization forfield sampling, the employees of the UWITEC company for the freeze-cores extraction and Laurent Gastaldo (EPFL Laboratory of Experimental Rock Mechanics, LEMR), for the preparation of the subsamples. We would like to also thank the University Center of Legal Medicine Lausanne– Geneva (CURML) and especially Kewin Ducrot for making the millimetric resolution X-ray CT analysis possible as well as Lukas Baumgartner and Benita Putlitz (Faculty of Geoscience and Environment– University of Lausanne) for the realization of the micro resolution X-ray CT analysis. Finally, we would like to thank Jörg Luster for providing the data on soil humidity, Timothée Lottaz and Rodolphe Schlaepfer for their well-appreciated help forfield work and statistical analyses as well as Karine Vernez Thomas and Elena Rossel for their help in laboratory analyses. This study was part of the FloodSTRESS project funded by the Swiss National Science Foundation (SNF; FN 315230_153460). We thank the three reviewers who provided highly constructive and useful comments.
Appendix
Appendix A. Segmentation of the Void category using millimetric X-ray CT images. Initial scan images and segmentation of the soil matrix using the widely-used Otsu automatic segmentation algorithm and the proposed user-based statistical segmentation method are illustrated for 3 different scan slices illustrating different soil compositional heterogeneities. For each scan slice the corresponding gray level value histogram is presented with the locations of the gray level threshold values defined by both segmentation methods.
Appendix B. X-ray CT cross-sections illustrating the minimum, the median and the maximum values of the mean and kurtosis observed over all the 5 freeze-core profiles. Only the voxels associated to the soil matrix are visible, the others are hidden by the blue surface. At the bottom of each cross section, the following information is provided: Computed value of the statistical parameter / Freeze-core number / Depth of the slice. Both graphs at the bottom show the voxel intensity distribution (histogram) of each selected cross section.
Appendix C. Comparison of the original X-ray CT scan image with the segmented Void category and RSUs. (a) Scan slice XZ 183 of FC4. Illustrations of the initial X-ray CT scan, the segmentation of the Void category and the segmentations of the 5 RSUs (Low, Low-Middle, Middle, Middle-High and High) associated to the soil matrix. (b) Percentage of the selected area over the area of the initial image. 100% refers to the area of the initial image and logically equals the sum of all the segmented areas after segmentation.