Geoelectric Monitoring
Current Research and Perspectives for the Future
Book of extended abstracts
International Workshop within the frame of the FWF project TEMPEL
(TRP 175-N21) and the 7
thFP European project SafeLand
November 30
th– December 2
nd, 2011, Vienna
Cover: Geoelectric Monitoring of Permafrost at Mölltaler Glacier with view to the Sonnblick 2010, Picture by Robert Supper.
ISSN 1017-8880
Alle Rechte für In- und Ausland vorbehalten.
Medieninhaber und Verleger: Geologische Bundesanstalt, Neulinggasse 38, A 1030 Wien. www. geologie.ac.at
Redaktion: Robert Supper & Stefanie Kauer Layout: Stefanie Kauer
Lektorat: Christian Cermak Verlagsort: Wien Herstellungsort: Wien
Ziel der „Berichte der Geologischen Bundesanstalt“ ist die Verbreitung wissenschaftlicher Ergebnisse. Satz: Geologische Bundesanstalt
3
Table of Contents
Introductory Foreword ...7
Instrumentation and Data Acquisition Technology ...9
A Data Acquistion System for Geoelectric Monitoring ...11
Development of multi-transmission high speed survey system and the application of geyser monitoring ...17
The GEOMON 4D electrical monitoring system: current state and future developments ...23
Effects of borehole design on complex ...27
electrical resistivity measurements ...27
Applications in Geothermal Monitoring ... 29
An Example of Electrical Resistivity Tomography Monitoring in Geothermal Sites: Balçova-Izmir Case Study ...31
Comparison of temperature estimates from heat transport model and electric resistivity tomography during a shallow heat injection and storage experiment ...43
Applications in Permafrost Monitoring ... 49
Electrical resistivity monitoring for the detection of changes in mountain permafrost at different time scales ...51
Permafrost monitoring at Mölltaler Glacier and Magnetköpfl...57
Applications in CO
2monitoring ... 65
Assessment of borehole resistivity tomography for subsurface CO2 leakage: Lab-scale preliminary study ...67
CO2 injection test in a shallow aquifer- feasibility of geoelectrical monitoring ...72
Monitoring of geological CO2 storage with electrical resistivity tomography (ERT): Results from a field experiment near Ketzin/Germany ...75
Geophysical and soil gas monitoring methods for the characterization of CO2 degassing sites – What can we learn from natural analogues? ...82
Time Lapse/4D Data Inversion ... 89
Timelapse ERT inversion approaches and their applications ...91
Comparison of algorithms of Time-lapse ERT inversion ...98
Inversion of multi-temporal geoelectrical data sets: insights from several case studies ...105
4D inversion of L1 and L2 norm minimizations ...106
Applications in Landslide Monitoring ... 115
Geophysical-geotechnical sensor networks for slope stability monitoring ...117
4
Pluri-annual time lapse survey applied to landslide monitoring: new highlights on short and long term dynamics ... 128 Electrical resistivity tomographies for landslide monitoring: a review ... 129 Stability Analysis of Pyroclastic Covers by a new Geoelectrical-Hydrogeological
Approach ... 135 Electromagnetic Induction (EM) for monitoring of soil-moisture pattern at the hill-slope scale ... 143 The TEMPEL geoelectrical monitoring network for landslides: highlights of recent
monitoring result ... 144
Applications in Engineering ... 153
Electrical resistivity monitoring of simulated piping and hydraulic fracturing within a dam structure ... 155 Resistivity monitoring for the detection of leakage zones in earth fill dams ... 161 Monitoring the Chemical Grouting in Sandy Soil by Electrical Resistivity Tomography (ERT) ... 168 Development of Tunnel Electrical Resistivity Prospecting System and its Applicaton ... 179 Geoelectrical monitoring of the tunnel boring at lot H3-4, section
Kundl/Radfeld-Baumkirchen ... 184
Poster and Company Presentations ... 191
ERT pollution monitoring in areas of olive oil mills' wastes (OOMW): Preliminary results from a disposal site in Crete (Greece) ... 193 Geoelectrical imaging of slope deformations – towards repeated measurements, effective electrode array and limitations ... 198 Monitoring of water content, water displacement and freeze-thaw processes in alpine rock walls using geoelectric survey lines ... 204
Applications in Hydrology ... 213
Resistivity imaging and image analysis for estimating water and solute transport across the capillary fringe in laboratory experiments ... 215 Sensitivity and resolution of ERT for soil moisture monitoring in contour hedgerow
intercropping systems: a methodological analysis ... 221 SP Monitoring at a Sea Dyke ... 228 3D crosshole ERT for aquifer characterization and monitoring of infiltrating river water 232 A salt tracer test monitored with surface ERT to detect preferential flow and transport paths in fractured/karstified limestones ... 233 Monitoring of short term geoelectric tracer experiments to investigate the shallow
interflow in small alpine micro-catchments ... 234 Quantitative assessment of infiltration processes using ERT: more questions than
5
Four-year repeated geoelectrical surveys for the monitoring of temperature and water
content in the unsaturated zone ...247
Applications in Contamination Monitoring ... 253
Monitoring the freshwater/saltwater transition zone on the North Sea Island Borkum using vertical electrode systems ...255
Development of an integrated monitoring concept to detect possible brine migration ...256
Geoelectrical Monitoring for Mapping of Gas and Water Migration in Landfills ...260
Historical Aspects of Geoelectric Monitoring... 265
Geoelectrical Monitoring behind the “Iron Curtain” ...267
Appendix ... 275
7
Introductory Foreword
In the frame of the FWF Translational Brainpower project TEMPEL (Geoelectric properties: temporal change as failure indicator - TRP 175-N21) and the 7th Framework Program European Project SafeLand (Living with landslide risk in Europe), the Austrian Geological Survey hosted the “First International Workshop on
Geoelectric Monitoring - GELMON 2011” - in Vienna. The workshop was held at the Geological Survey of
Austria from the 30th of November to the 2nd of December 2011.
Geoelectrical monitoring has significantly developed over the recent years as an emerging branch in applied geophysics. Several groups have achieved very selective knowledge in this field of geoelectrics.
The intention of the GELMON workshop therefore was to bring the different groups together, to present results and to discuss the way forward. The scope of the workshop was not only focused on the presentation of state-of-the-art results but also on the discussion of special topics of data acquisition, processing, inversion and interpretation.
When the idea of the workshop was born, we were thinking of a small workshop with 20 to 30 participants. Presentations on all related aspects of geoelectrical monitoring were requested, covering the field from technical issues to the presentation of recent case study results. Specialists in the field of geoelectrics and related scientific disciplines were invited to submit their abstracts on diverse topics on geoelectric monitoring. After sending out the invitations we were overwhelmed by the quantity of interested people. Finally, almost 100 scientists from 18 countries registered for participation, whereas more than half of them were willing to contribute to the workshop by oral or poster presentation.
This unexpectedly huge number of participants highlights the importance of geoelectric monitoring all over the world and intensifies the need of cooperation and communication.
All important aspects of geoelectric monitoring, including monitoring of landslides, permafrost, CO2,
geothermal sites and contaminations, applications in hydrology and engineering, but also some contributions on instrumentation, data acquisition and data inversion were discussed during the workshop in Vienna. The discussions after the presentations highlighted the need of innovation and technological progress especially in the area of geoelectrical time-lapse/4D inversion and data quality assessment. Finally it was decided to repeat this successful event in a two years cycle. The majority of participants voted again for Vienna as meeting venue. Therefore the 2nd Workshop on Geoelectrical Monitoring will take place in November 2013 again in Vienna and organised by the staff of the Geophysical Department of the Geological Survey of Austria.
This book contains the collection of extended abstracts summarizing the content of the talks held during this workshop and is intended to be a reference in geoelectric monitoring.
This is also the place to thank all the people from GSA who were involved in the organization of this workshow (especially Birgit Jochum, David Ottowitz, Stefanie Kauer and Anna Zöchbauer) for their enthusiastic help.
Robert Supper Chairman of GELMON 2011 Vice President of the Austrian Geophysical Society
8
This book is dedicated to the memory of Erich Niesner, 31.01.1955 - 22.4.2012,
one of the pioneers of geoelectric monitoring in Austria,
and
to the memory of Knut Seidel, 21.01.1953 - 07.05.2012
9
Instrumentation and Data
Acquisition Technology
11
A Data Acquistion System for Geoelectric Monitoring
T
ORLEIFD
AHLIN1and
P
ETERJ
ONSSON11 Engineering Geology, Lund University, Box 118, S-221 00 Lund, Sweden.
torleif.dahlin@tg.lth.se
Introduction
A data acquisition system has been developed for automatic monitoring of variations in resistivity and induced polarisation (IP) effects, plus self potentials (SP). The system consists of electrodes, electrode cables, resistivity-IP instrument, relay switches, lightning protection, power supply, internet connection, etc. We have migrated through several generations of the system dating back to our first remote installation with automatic daily measurements in 1996. The system(s) have been used for a number of applications. Automated long-term monitoring has been done at 3 embankment dams in northern Sweden, out of which 2 are active at the moment (DAHLIN et al.,
2001; SJÖDAHL et al., 2008, 2009). The purpose is to develop techniques for detecting anomalous
leakage and internal erosion in the embankment dam, where the annual temperature variation is viewed as a natural tracer.
Short-term monitoring with the same objective has been done on embankment dams a couple of times, also with the aim to detect internal defects and anomalous leakage paths (SJÖDAHL et al.,
2010, 2011). Here the monitoring period has been a few days in connection with planned change in reservoir water level.
Short-term monitoring has also been done at 4 different waste sites in southern Sweden, typically for 1-2 weeks, including 4 separate monitoring campaigns on one of the sites (JOHANSSON et al.,
2011; ROSQVIST et al., 2011). The aim has been to detect variation in content and migration of
fluids and gas in waste.
The intention of this article is to outline the main features of the system and summarise the experiences gained of geoelectrical monitoring. Glimpses of different steps in the development are given, from the earliest to the most recent version will be described here.
Before monitoring with permanently installed data acquisition systems started we did a time lapse survey on Lövön embankment dam in Sweden, where we installed and left the electrodes in place but connected the electrode cables and the instrument each time of measuring (JOHANSSON
and DAHLIN, 1996). In this study it became very clear that the type of electrodes consisting of steel
rods that are normally used for geoelectrical imaging surveys were poorly suited for long term measurements as the electrode grounding contact deteriorated seriously from one measurement time to the next. We then switched to buried plate electrode that functioned much better.
Electrodes and Electrode Cables
Stainless steel plates are preferred as electrodes for the resistivity-IP measurements, where we use sizes between 0.125m x 0.125m (short term monitoring) and 0.25m x 0.25m (long term monitoring, see Fig. 1). The plate electrodes are buried at shallow depths, providing much larger contact area than regular cylindrical electrodes. The electrodes are fitted to the electrode cables so that only stainless steel and no other metals are exposed to the environment in order to avoid
12
galvanic elements and corrosion. The electrode cables are specifically made for monitoring installations with no exposed metal surfaces, and hence no exposed parts carrying dangerous currents and potentials. Lightning protection is connected between each incoming electrode and the relay switches and the instrument, and the power supply is also protected against over-voltage.
Fig. 1: Design of electrodes used for permanent installations for geoelectrical monitoring and photo from
field installation in progress on Hällby embankment dam 1996.
At a couple of the embankment dam sites non-polarisable electrodes for SP measurement were included. In those cases every 2nd electrode is a stainless steel plate and every 2nd is
polarisable. Only the steel places have been used for current transmission, while the non-polarisable one have been used for measuring SP as well as potentials for resistivity and IP.
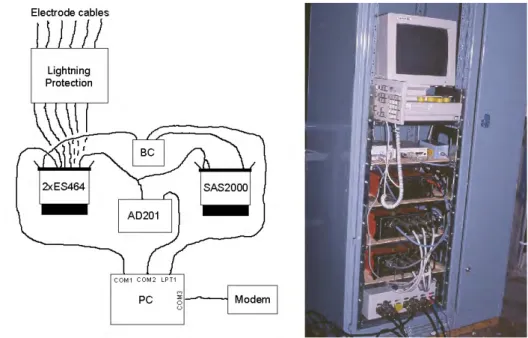
Fig. 2: The first permanently installed data acquisition system on Hällby embankment dam, installed in
1996.
Instrumentation
The first generation of the system installed consisted of a mixture of components, an ABEM Booster SAS2000 was used to transmit current, two units of ABEM Electrode Selector ES464 to
13
switch electrodes, a Lawson Labs AD201 24 bit A/D-converter for measuring potentials, and lightning protection designed and built at Lund University (Fig. 2). The data acquisition was controlled by a standard desktop PC via serial ports and a parallel port interface for controlling the SAS2000.
The second generation of the system installed also used an ABEM Booster SAS2000 to transmit current and 1-2 units (depending on site) of ABEM Electrode Selector ES464 to switch electrodes. Measurements and control of the transmitter was taken over by a Terraohm RIP224 receiver and control unit equipped with 24 bit A/D-converters, which was designed and built at Lund University as the lightning protection. The data acquisition was controlled by a standard desktop PC via serial ports.
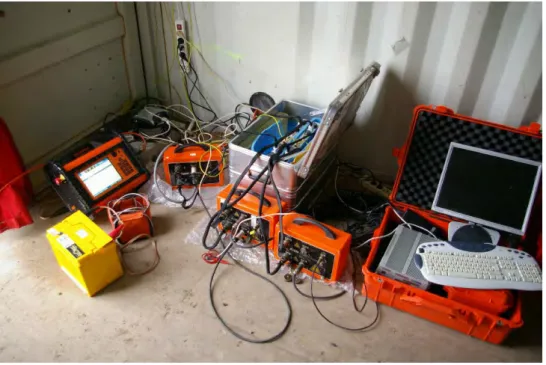
Fig. 3: Temporary installation of the present data acquisition system on a landfill in 2011.
The most recent data acquisition system comprises an ABEM Terrameter LS configured for automatic measuring at pre-selected intervals (Fig. 3). The instrument has a built-in relay switch that handles 64 electrodes, but we have expanded it with a number of Electrode Selector ES10-64C relay switches to allow for more electrodes. The instrument software runs on a Linux platform, and timing of the data acquisition is controlled by cron. Each time it is due cron starts up acquisition software and carries out measurements according to the selected protocol(s). After finishing a measurement round the instrument turns off the software and all data acquisition hardware, which means that the power consumption in stand-by mode is minimised. In this case a PC is not needed to control the data acquisition, but depending on the speed of the Internet it may an advantage with a compact industrial type PC for more stable remote control and data transfer.
Remote Control and Data Transfer
In the early systems remote control and data transfer was done via telephone modem using pcAnywhere. The telephone lines were often poor and communication with the data acquisition system required endless patience and was a source of lots of frustration.
14
Remote control and data transfer is nowadays done via a mobile broadband internet modem with built-in router, etc. The monitoring systems transfer data automatically via SFTP, using a data transfer system design is outlined in Fig. 4. Data archiving has been identified as a field needing a systematic approach, and a standardised data format is also needed.
Fig. 4: Overview of data transfer system principles.
Power Supply
Power supply has so far been provided by the power net grid. In cases where power consumption is provided by batteries or solar panels the latest system can be optimised for minimum power consumption via standby mode between measurements. Adjusting output power and optimising the measuring protocol to reduce the number of current transmissions by using the multi-channel capability are other ways to save energy.
Experiences
The data acquisition systems have mostly operated in a stable way, with occasional breakdowns. The reasons for problems during the period 1996 to 2011 have been (listed in order of frequency): • Modem and Internet connection breakdown and stability at the monitoring site has by far
been the largest problem through the years. In recent years more stable solutions have come. • Transmitter malfunction due to worn out components has occurred a handful times due to
worn out polarity switch relay or transistor. It should be noted that the transmitters used have been SAS2000 which were designed for manual resistivity surveying in the 1970-ties and never were intended for automated imaging many hours every day year after year.
• Relay malfunction in the electrode selectors (3 occasions). • Malfunction of server in Lund due to lightning transient.
15
• Electrode disconnection by animals (short-term monitoring). • Remote cable damage (short-term monitoring).
• Electrode connection corrosion (open take-outs in short-term monitoring), see Fig. 5. • Damaged serial port in a PC due to electric transient (one occasion).
• Damaged input channel of RIP224 due to electric transient (one occasion).
Fig. 5: Photographs showing corrosion, etching and bleaching of electrode cables and connectors resulting
from a few weeks exposure to the atmosphere on a landfill.
Summary and Conclusions
The overall experiences of our geoelectrical monitoring activities can be summarised as follows: • Automatic monitoring has been carried out at a number of sites since 1996.
• Data acquisition and transfer solutions have mostly been stable. • Most trouble has been caused by communication problems.
• Poor ground to electrode contact was reduced by buried plate electrodes. • Corrosion problems were eliminated by insulated pig-tail electrode connections. • Long time series of IP data remain to be analysed.
Acknowledgements
Thord Lundgren has been instrumental in design and construction of instruments used for the monitoring. Sam Johansson and Pontus Sjödahl at HydroResearch have been cooperation partners throughout dam monitoring work. Elforsk, DSIG (Dam Safety Interest Group within CEATI) and the dam owners have funded the work.
The short term monitoring of landfills was carried out within the MaLaGa project (Mapping of
Landfill structures and Gas migration based on geophysical measurements) in co-operation
16
(Avfall Sverige), Swedish Gas Centre (Svenskt Gastekniskt Center AB), Sven Tyréns Stiftelse, NSR AB, SYSAV AB and VETAB AB.
References
DAHLIN, T., SJÖDAHL, P., FRIBORG, J. and JOHANSSON, S., 2001: Resistivity and SP Surveying and Monitoring at the Sädva Embankment Dam, Sweden. – In: MIDTTØMME,G.H.,HONNINGSVÅG,B.,
REPP,K.,VASKINN,K.A.andWESTEREN,T. (Eds): Dams in a European Context, 107-113,
Balkema/Swets & Zeitlinger, Lisse.
JOHANSSON, S. and DAHLIN, T., 1996: Seepage monitoring in an earth embankment dam by repeated
resistivity measurements. – European Journal of Engineering and Environmental Geophysics,
1(3), 229-247.
JOHANSSON, S., ROSQVIST, H., SVENSSON, M., DAHLIN, T. and LEROUX, V., 2011: An alternative
methodology for the analysis of electrical resistivity data from a soil gas study. – Geophysical Journal International, 186, 632-640.
ROSQVIST, H., LEROUX, V., DAHLIN, T., SVENSSON, M., LINDSJÖ, M., MÅNSSON, C-H., and JOHANSSON, S.,
2011: Mapping landfill gas migration using resistivity monitoring. – Waste and Resource Management, 164(1), 3-15.
SJÖDAHL, P., DAHLIN, T., JOHANSSON, S. and LOKE, M.H., 2008: Resistivity monitoring for leakage and
internal erosion detection at Hällby embankment dam. – Journal of Applied Geophysics, 65, 155–164.
SJÖDAHL, P., DAHLIN, T. and JOHANSSON, S., 2009: Estimating seepage flow from resistivity
monitoring data at the Sädva embankment dam. – Near Surface Geophysics, 7, 463-474. SJÖDAHL, P., DAHLIN, T. and JOHANSSON, S., 2010: Using the electrical resistivity method for leakage
detection in a blind test at the Røssvatn embankment dam test facility in Norway. – Bulletin of Engineering Geology and the Environment, 69, 643–658.
SJÖDAHL, P., JOHANSSON, S. and DAHLIN, T., 2011: Investigation of shallow leakage zones in a small
embankment dam using repeated resistivity measurements. Internal erosion in embankment dams and their foundations. – In: FRY,J.-J.,RIHA,J. and JULINEK,T. (Eds.): Proceedings of the
Institute of Water Structures FCE BUT Brno, 26.-29. April 2011, Brno, Czech Republic, 13, 165-172.
17
Development of multi-transmission high speed survey
system and the application of geyser monitoring
M
OTOHARUJ
INGUUJINational Institute of Advanced Industrial Science and Technology AIST Tsukuba Central #7, Tsukuba, Ibaraki 305-8567, Japan.
m.jinguuji@aist.go.jp
Summary
A new resistivity survey system, which is capable of very fast data acquisition compared with conventional DC resistivity system, has been developed in AIST. The key feature to speed up the measurement is that the system transmits multiple currents of different frequencies from different transmitter electrodes simultaneously. The transmitted signals are separated in frequency domain at a receiver electrode is identified by each respective frequency. The receiver electrodes are also multiple and simultaneously measured by using a multiple receiving function. The newly developed system has been tested by measurements at some experiment yards and the result shows success. The new developed system can obtain many datasets of resistivity in short time. Therefore, this system is suitable for the data acquisition using the statistic methods of time series, and the high speed geological monitoring. This paper introduces the outline of this system and the example of application to the monitoring of a geyser.
Introduction
A new resistivity survey system, which is capable of very fast data acquisition compared with conventional DC resistivity system, has been developed in AIST. The key feature is that the system transmits multiple currents of different frequencies from different transmitter electrodes simultaneously.
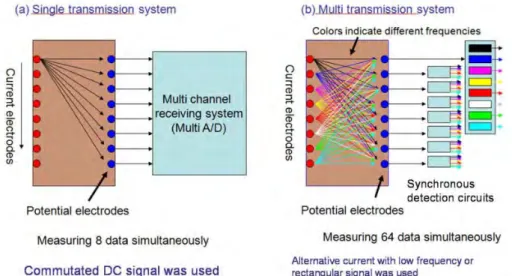
Figure 1 shows a conceptual diagram of the multi-transmission resistivity system and a conventional single transmission system. In the conventional system, a single frequency current is transmitted from an electrode pair.
The new developed system has a multi-channel transmission function, and currents that contain multiple frequencies are transmitted from multiple electrodes pairs. The new multi-transmission system sends electric currents from multiple electrodes simultaneously. Frequency of the current sent from one electrode pair is different from those of the other electrode pairs. Superimposed signals of these frequencies observed at a receiver electrode pair is separated into each frequency using a synchronized detection circuits.
18
Fig. 1: Comparison of conceptual diagrams of the systems.
As in the case of the conventional system, the receiving function of the multi-electrode can be easily incorporated in the new system. As an example, Figure 1b shows a case of eight multiple current electrodes and eight multiple receiver electrodes. The new system can obtain 64 data at one time using 64 synchronized detection circuits, while the conventional system can measure eight data at once. The synchronized detection circuit that uses in the multi-transmission system has a very sharp band pass filter characteristic,in order to separate the frequencies of the signals. As a result, it can remove unwanted environmental noises efficiently. Therefore, the system can be used in the location of noisy environment.
Figure 2 shows the comparison of 2D inversion images between the multi-transmission system and the ordinary system using Pole-Pole method.
19
Almost same images obtain from these instruments. However the multi transmission system is much faster than the ordinary single transmission system. Multi-transmission system can obtain data much faster than that of ordinary system. So, this system is suitable for the high speed monitoring.
Application of geyser monitoring
Multi-transmission system is suitable for high speed monitoring of geological phenomenon, because the system can be enable to the high speed data acquisition. The geyser is the one of the geological phenomenon that changes rapidly. In this section, we show an example of the geyser monitoring that used multi-transmission system.
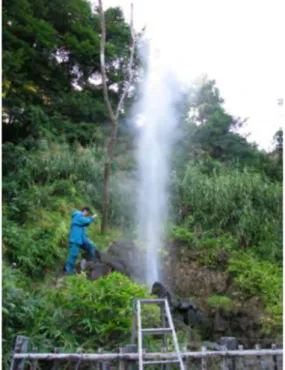
Fig. 3: A location of Onikobe geyser in Japan Fig. 4: A photo of Onikobe geyser.
(Referenced by Google map).
Fig. 5: A photo of multi-transmission resistivity meter. Fig. 6: 3D terrain and superimposed electrodes
20
Onikobe geyser in Yamagata Prefecture, the cycle time of eruption is from 6 minutes to 12 minutes, duration time is from 60 seconds to 90 seconds and erupt up to 15m high degree, is one of the famous tourist destination geyser in Japan (Fig. 3 and Fig. 4). In general, geysers are considered its eruption cycle has a certain period, but the eruption cycle of Onikobe geyser has some other certain variability regularity of duration and cycle of eruption.
Generally speaking, geyser's eruption cycle and duration time are limited in short time, relatively. In order to observe the geyser by using resistivity monitoring, it needs the electrical resistivity meter which is faster than ever. The multi-transmission high-speed resistivity meter developed by AIST can measure much faster than ordinary system (Fig. 5).
This instrument can measure 64 datasets (8x8) at a time. The numbers of electrode of the monitoring of Onikobe geyser are 8 electrodes for the transmission, and 16 electrodes for the receiving. Therefore, the sampling time of the measurement of Onikobe geyser is about 11 seconds including switch of scanner.
Onikobe geyser is located in the dimpled terrain. Figure 6 shows the view of three-dimensional terrain using the non-prism laser survey instrument and superimposed electrodes location.
The Pole-pole method was used for the resistivity measurement. 24 Electrodes were set around geyser (Fig. 7). The electrodes from ch1 to ch8 were used for the current, and the electrodes from ch9 to ch24 were used for the potential. The electrode ch24 was connected to the iron casing pipe of geyser.
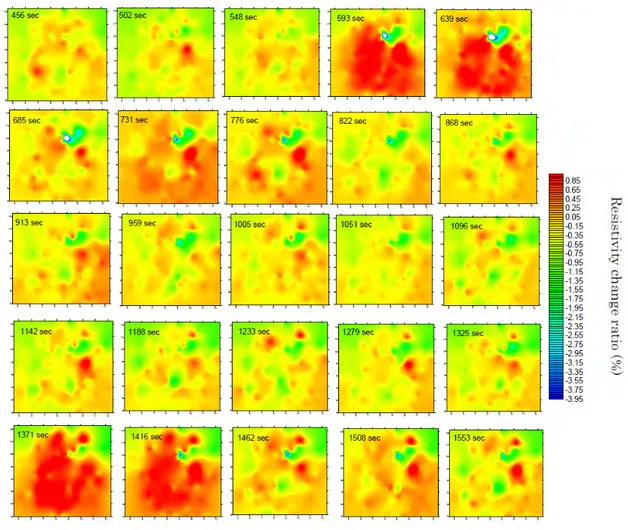
Figure 8 shows the resistivity change with time at the electrode which connected casing pipe of geyser (Current ch1, Potential ch24). The resistivity change reflects the geological status around casing pipe. The clear decrease of resistivity was confirmed during eruption status of geyser. The pattern of resistivity change is almost same pattern observed by MISHIMA et al. (2007). In the
figure, the resistivity change ratio is the normalized with respect to the initial value. The resistivity decrease is almost 6 % at maximum.
Fig. 8: Resistivity change with time at an
electrode which connected casing pipe of geyser.
21
Multi-transmission system can obtain 128 time series data within 11 seconds. So, we tried to the analysis of apparent resistivity using other electrodes data.
Figure 9 shows the plan view of the apparent resistivity during eruption of the geyser. In the figure, the depth information does not use and the only horizontal information uses for the plot. The data position of apparent resistivity is the center of the current electrode and potential electrode.
In the Fig. 9, we can confirm an obvious decrease anomaly of resistivity at the right upper of the location of geyser (ch24). Also, the increase area of resistivity is confirmed obviously around this decrease anomaly. Figure 10 shows resistivity changes at the point of low resistivity anomaly (Current ch5, Potential ch9), increase of resistivity (Current ch2, Potential ch12) and the casing pipe of geyser (Current ch1, Potential ch24), respectively.
Fig. 10: Resistivity changes at the point of
typical changes.
The drops of peek of resistivity at low resistivity anomaly are slightly delayed as compared to the drop of peek at the position of casing pipe. In addition, the resistivity changes at the anomaly late to recover compared with the resistivity change at the position of casing pipe. At the area of resistivity increase, the resistivity increase when the eruption seems to be occurred. But, the change is small. Figure 11 shows plan views of the change of resistivity per 45 seconds.
We can interpret of the eruption mechanism of the geyser from these changes of resistivity. It is estimated that the location of chamber of hot water is the low resistivity anomaly which is 2m away from the geyser. The low resistivity anomaly indicates the existence of flows of hot water to the chamber. This resistivity drop of the low resistivity anomaly has begun to late compare with the resistivity drop at the casing pipe. And then, foaming of hot water occurs due to the reducing of pressure by discharge of the hot water. The eruption of geyser is begun by the foaming. The resistivity increases due to the low water saturation during the foaming. The area of increasing of resistivity is 5m2 surrounding the geyser, but its change is not so large. The change of resistivity (change ratio) is only few percent, too. This shows the foaming of hot water is occurred in the relatively wide area.
Fig. 9: A plan view of the apparent resistivity
22
The resistivity at the low resistivity anomaly recovers slowly and continuously until the next eruption. This shows that the water level of hot water at the chamber drops slowly after eruption has finished.
Conclusion
We developed a new resistivity survey system, which is capable of very fast data acquisition compared with conventional DC resistivity systems and carried out the resistivity monitoring at Onikobe geyser. As a result, the clearly changes of resistivity were observed during eruption of the geyser. These changes do not inconsistent with the eruption mechanism of Onikobe geyser that has been considered so far.
We show that these resistance changes are explained by the eruption mechanism. On the other hand, the area which the foaming has occurred is relatively wide. The comprehensive validation is required using other monitoring method data in future.
Fig. 11: Plan views of the change of resistivity per 45 seconds.
Reference
MISHIMA, S., OGAWA, Y., SABO, K. and TAKAKURA, S., 2007: Observation of resistivity change of
23
The GEOMON 4D electrical monitoring system: current
state and future developments
R
OBERTS
UPPER1,
A
LEXANDERR
ÖMER1,
G
ERHARDK
REUZER2,
B
IRGITJ
OCHUM1,
D
AVIDO
TTOWITZ1,
A
NNAI
TA1and S
TEFANIEK
AUER11 Geological Survey of Austria, Neulinggasse 38, 1030 Wien, Austria. 2 LIFTOFF, Kölblgasse 11/1, 1030 Wien, Austria.
Robert.Supper@geologie.ac.at
Introduction
In 2000, after the Geophysical Department of the Geological Survey of Austria had successfully applied the geoelectric method to investigate the structure of the large landslide of Rindberg near Sibratsgfäll (JARITZ et al., 2004; SUPPER et al., 2009), the Torrent and Avalanche Control Vorarlberg
contracted the Geological Survey of Austria to develop a permanent geoelectrical monitoring system for landslides. At that time it was found that most of the commercially available systems were optimised to perform conventional investigation surveys and at that time none of the systems could fulfil the requirements of permanent geoelectric monitoring (high resolution, high speed of data acquisition, high reliability, recording of full signal samples for noise detection, remote controlled maintenance and automatic data transfer). Therefore, in late 2000 the design of an innovative system was started (SUPPER and RÖMER, 2003). The first 29-electrode prototype
was installed to observe the mudflow of Rindberg near Sibratsgfäll in spring 2002, where it was continuously measuring since that time till the end of 2007 with a few unforeseen interruptions due to lightning strokes. Based on the results gathered during operation of the prototype, the system was redesigned and optimised for monitoring purpose as well as for “conventional” field surveys within the following years and finally reached its maturity state in 2006. At the end of 2007 after 5 years of operation, the maintenance of the system at Sibratsgfäll was abandoned since a significant part of the cables had been cut due to large displacements.
24
The GEOMON 4D System
The GEOMON4D instrument, as it is today, is based on technically mature components and offers a completely open architecture, allowing installation of any number of current or potential electrodes by adding parallel or serial cards (cp. Fig. 1). The principal characteristics are the high speed of data acquisition (approx. 3000 measurements/hour in single channel mode) and recording of the full signal (usually 1000 samples per single configuration) for noise analysis and filtering.
Since the hydrological processes which could lead towards triggering of a landslide could be built up gradually or sudden, our monitoring system for surveillance of these processes is capable of surveying long period changes (within months; e.g. permafrost related phenomena) as well as short sudden impacts (within minutes or hours; e.g. strong rainfalls). It provides a point shot of the current status of the subsurface, which practically means, that data acquisition time has to be much less than the period of expected changes. The instrumentation provides high resolution data, by keeping the error of each single measurement low (e.g. by selecting only measurements with a low noise content for further processing) and by using many different electrode configurations, which visually means to “illuminate” each subsurface block from as many different direction as possible and to sample its ”shadow”. The data set produced shows a high reliability and is used as an additional tool for local authorities to decide about timely warning. The possibility of repeating the measurements at short time intervals allows verifying anomalous trends.
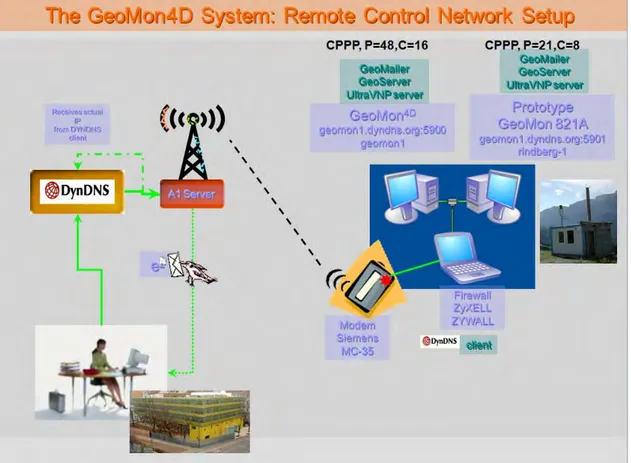
Most areas under observation are usually not easily accessible, but data sets have to be regularly processed. Therefore the possibility of remote maintenance and automatic data delivery by email is essential and consequently GPRS (General Packet Radio Service) data transfer was implemented. Maintenance can be performed fully remote-controlled and data (measurement
25
results, test sequences and log files, containing information about system and GPRS connection status) are sent automatically via email to the data processing centre. Consequently, immediate availability of information for local stakeholders can be guaranteed, which is very important in the case of sudden hazards like mud flows. The general layout of the remote control network is displayed in Figure 2.
Fig. 2: Diagram explaining the setup of the remote control network.
Further Requirements
A big challenge in geoelectric monitoring is the assurance of power supply. To use the local power grid proved to be unreliable and very expensive (500 m cable cost about 14,000 Euro). Therefore, fuel cells were chosen for power supply, being less expensive, mobile (a fuel cell can be transported from an abandoned monitoring site to a new site), and very reliable. The fuel cell is driven by methanol, whereas the respective methanol tanks have to be changed about every 8 months.
Furthermore, the optimum way of installing the arrays (surface, trenches, different kinds of cables and connectors) was tested over years and a lightning protection device for multi-core cables had to be developed. It proved to be useful, in terms of persistence and maintenance, to dig cables and electrodes if this was possible.
The necessity to monitor landslide stability conditions has induced C.S.G. (Centro Servizi di Geoingegneria, Italy) to develop an innovative multiparametric monitoring system of stability called D.M.S. (patent pending and trade mark C.S.G. S.r.l.). This device measures with high accuracy and precision displacements in 2 or 3 directions (both horizontal and vertical at all the prefixed depths), piezometric water levels and soil temperature, thus allowing the complex
26
analysis of dynamics of any landslide, e.g. deformation analysis, movements, sliding surface’s depths or piezometric variations (FOGLINO et. al., 2006). In late 2009, both innovative technologies
(geoelectric monitoring and DMS) were coupled for the first time on the landslide of Gschliefgraben and they are operating since then without any failure.
Future Developments
Currently six Geomon4D instruments are operating simultaneously for monitoring purposes on different landslides in Austria, Italy and France and two instruments are permanently used by the staff of the Geological Survey of Austria for usual tomographic surveys. The results from our monitoring sites have shown that there is a critical lack of inversion routines that could handle permanent monitoring data. Some commercial codes (RES2DINV and AGI EearthImager) were tested but did only partially lead to satisfying results. Therefore future developments will focus on 4D Inversion (in cooperation with Jung-Ho KIM from KIGAM, Korea), data correlation and interpretation. At the end of 2012 a completely redesigned version of the Geomon4D system will be available incorporation all the experience gathered from the operation of the TEMPEL monitoring network between 2009 and 2012.
Acknowledgements
The development of the Geomon4D prototype system was financially supported by the Torrent and Avalanche Control (WLV), Section Vorarlberg, the county of Vorarlberg and internal funds of the Geological Survey of Austria in frame of the Bund-Bundesländer-Kooperation (project VC-07). Further developments were financed by internal funds of the Geological Survey of Austria and by funds coming from the 7th FP project “SafeLand – Living with the landslide risk in Europe” and from the project “TEMPEL - Temporal changes of geoelectrical properties as possible indicator of future failure of high risk landslides”, funded by the Austrian Science Fund (FWF)-TRP 175-N21 in frame of the Translational Brainpower Program. Additional financial support was given by the Central Institute for Meteorology and Geodynamics (ZAMG) for developing the lightning protection. We acknowledge the support of A. Reiterer, Torrent and Avalanche Control (WLV), Section Vorarlberg, who had the idea to apply the geoelectrical technique for landslide monitoring and initiated the funding for the prototype system and G. Hübl, who shared our minds in the pioneer times of the Geomon4D.
References
FOGLINO, L., LOVISOLO, M. and DELLA GIUSTA, A., 2006: Contribution of DMS monitoring systems in
the analysis of slide micro-movements for early warning management, risk assessment and evaluation of mitigating actions. – Geophysical Research Abstracts, Vol. 8, 06122, Vienna. JARITZ, W., REITERER, A. and SUPPER, R., 2004: Landslide Rindberg (Vorarlberg): Multidiscipline
Research. – Proceedings of the 10th Interpraevent Congress, Riva del Garda.
SUPPER, R. and RÖMER, A., 2003: New Achievements in Developing a High Speed Geoelectrical
Monitoring System for Landslide Monitoring. – Proceedings of the Environmental and Engineering Geophysical Society, 9th Meeting Prag, Prag.
SUPPER, R., RÖMER, A. and JOCHUM, B., 2009: Geoelectrical measurements for natural hazard
27
Effects of borehole design on complex
electrical resistivity measurements
A
NDREAT
REICHEL1,
J
OHANA.
H
UISMAN1,
Y
ULONGZ
HAO3,
E
GONZ
IMMERMANN3,
O
DILIAE
SSER1,
A
NDREASK
EMNA2and H
ARRYV
EREECKEN11 Agrosphere, IBG-3, Forschungszentrum Jülich, Germany.
2 Department of Geodynamics and Geophysics, University of Bonn, Germany. 3 Central Institute for Electronics, ZEL, Forschungszentrum Jülich, Germany.
a.treichel@fz-juelich.de
Abstract
Recent studies have shown that electrical resistivity measurement in boreholes can be influenced by the borehole design and the aquifer properties. It was found that large boreholes and aquifers with a large formation factor are particularly prone to erroneous resistivity measurements. However, effects of the borehole casing have not been considered yet. Within the context of the 4DEIT project, we have developed a broadband borehole Electrical Impedance Tomography (EIT) measurement system that enables complex electrical resistivity measurements of unprecedented accuracy. To support the interpretation of these borehole EIT measurements, the aim of this study is to investigate the effect of PVC borehole casing and the complex nature of the electrical conductivity on the EIT measurements. In order to do so, we used a 2D axisymmetrical finite element model that solves the Poisson equation. The borehole is located at the rotational axis and the 2D coordinates are the radius of the cylinder and the depth along the borehole. The finite element discretization consists of triangular elements which are smaller near the borehole. To get realistic values for the complex resistivity, we analyzed spectral induced polarization measurements made on aquifer material from the Krauthausen test site using Debye decomposition. The resulting complex resistivity values were implemented in our model together with an effective representation of the borehole casing that considers the resistivity of PVC and the slotted fraction. This model was then used to investigate the effect of borehole diameters, effective properties of the borehole casing, and the formation factor on the complex resistivity. To validate the simulations, we performed measurements in a water column. For this, a symmetrical rain barrel filled with tap water was used. It was concluded that the properties of the borehole casing have a large impact on the apparent resistivity when two current electrodes are situated in the same borehole.
29
Applications in Geothermal
Monitoring
31
An Example of Electrical Resistivity Tomography
Monitoring in Geothermal Sites: Balçova-Izmir Case Study
M
AHMUTG.
D
RAHOR1,2,
M
ERIÇA.
B
ERGE2,
Ö
ZDEB
AKAK3and C
ANERÖ
ZTÜRK41 Dokuz Eylül University, Center for Near Surface Geophysics and Archeological Prospection
(CNSGAP), Tinaztepe Campus, 35160 Buca-Izmir/Turkey.
2 Dokuz Eylül University, Engineering Faculty, Department of Geophysics, Tinaztepe Campus,
35160 Buca-Izmir/Turkey.
3 Dokuz Eylül University, The Graduate School of Natural and Applied Sciences, Department of
Geothermal Energy, Tinaztepe Campus, 35160 Buca-Izmir/Turkey.
4 GEOIM Engineering, Consulting, Software and Construction Ltd. 35070 Bornova-Izmir/Turkey.
goktug.drahor@deu.edu.tr
Abstract
In this study, the shallow fluid flow changes according to climatic effects on a geothermal site were investigated using electrical resistivity tomography method (ERT). Monitoring studies achieved by time lapse electrical resistivity tomography, which were the key studies to observe the subsurface resistivity distribution of the investigated lines. The studies were performed at Balçova geothermal site, in the city of İzmir-Turkey, which has been operating in house heating since 1990’s. The main source of the groundwater in the area is rainfall. Our ERT monitoring studies were performed between March 2010 and February 2011. We aimed to obtain information on the shallow conductive layers that allow the transport of the fluids. Therefore, the investigations which will be succeeded on shallow aquifer system near the boreholes could be important to characterize the subsurface while the geothermal operations. In conclusion, monitoring studies showed that subsurface characteristics were importantly changed according to borehole operation and seasonality rainfall. Results were also supported with the synthetic forward modeling studies.
Introduction
The geophysical surveys have commonly been applied in the investigation of geothermal sites since 1960’s. These surveys have an important role on the determination of reservoir characteristic and geological properties of the geothermal system. One of the objectives of geophysical surveys is to determine the location of faults carrying hot waters, reservoir characteristic, various physical changes in the system. On the basis of these results, the appropriate drillsite locations are determined and the time-related physical changes around the drillsites are controlled. In recent years, the combinations of geophysical methods have been utilized in the exploration of geothermal systems in the world.
Important information about a geothermal site is obtained by different geophysical investigation techniques such as electrical resistivity, self-potential, electromagnetic, magnetics, seismic, etc. Electrical and electromagnetic prospection of geophysics is the most powerful research techniques in geothermal investigations. Using these techniques, faults and fissures, reservoir
32
characteristics, altered and mineralized zones, the properties of geothermal fluids, the magma chamber locations and entire tectonic structures could be determined.
Recently, geophysical monitoring studies are of great importance in near surface geophysical applications. Many investigators gathered information about the temporal subsurface changes by using geophysical monitoring studies. These are very useful to define the permafrost environment, landslide, engineering, geothermal, hydrology, contamination and CO2 monitoring
investigations. In near surface applications of geophysics, the electrical resistivity tomography (ERT) monitoring studies have been progressively used recently. However, the geothermal application of ERT monitoring is rarely seen. This study aims to manifest the importance of ERT monitoring in near surface investigations of geothermal sites. Therefore we investigated a geothermal site that contains the shallow fluid flow by the ERT technique. Time lapse inversion was a key study to monitor the resistivity distribution under the measuring lines. In the modeling stage, inversion facilities were investigated by the simulation of a synthetic injection model. In the time lapse inversion process, the initial model approach was used to constrain the later time data sets.
Geothermal in Turkey
Neotectonic activity in Anatolia, Turkey, is mostly related to the northerly movement of the Arabian Plate towards the Eurasian Plate. The Anatolian Plate comprises many small fragments between seismically active fracture zones with numerous geothermal hot springs in the active areas (Figure 1a). On the basis of this tectonic framework, Turkey can be divided into four main geothermal regions (along the magmatic belts of western, eastern and central Anatolia and along the north Anatolian fault zone). The Büyük Menderes and Gediz grabens of western Anatolia tend to be important features from the geothermal viewpoint, with many hot water springs located along the fault zones of these grabens (DRAHOR and BERGE, 2006).
Turkey has extensive geothermal resources that have been utilized for heating of residences, power plant, greenhouse heating, and for spas. Since 2005 several new plants have been constructed. Four new binary units of about 8 MW each have been installed, three for exploiting medium enthalpy reservoir (two by Dora – MB group, in Aydın-Salavatlı area, and one by Tuzla – Dardanel Energy, at Çanakkale and one using the separated brine (140 ◦C)) from the Kızıldere plant, before its use for district heating, operated by Bereket. A new 47 MW double flash unit was commissioned in 2009 at Germencik with the possibility of a second 47 MW unit. It is one of the largest plants in Europe, just behind the Italian standard 60 MW units. Several additional areas have been allocated to private companies for further surface and deep exploration. Since 2005 an increase of about 70 MW in installed capacity has been achieved. The target for 2015 is about 200 MW. The geothermal potential of the country is estimated to be about 30,000 MW (MERTOĞLU et
al., 2003; SERPEN et al., 2009).
Balçova Geothermal Site and Geology
ERT monitoring studies were performed on an important geothermal site found in the southern part of İzmir Bay. This area named Balçova geothermal system is about 20 km west of city of İzmir, and operated in heating by Balçova Termal Ltd since 1990’s. Many injection and re-injection holes were drilled in the area during the operational processes. Approximately 50 wells have been drilled by the General Directorate of Mineral Research and Exploration of Turkey (MTA) both for developing and monitoring geothermal energy production (Figure 1b). The depths of the wells
33
vary from 100 m (shallow) to more than 2 km (deep). The first geophysical surveys in Turkey were carried out in this area in the mid of 1960’s. These studies consist of electrical resistivity, self-potential (SP) and drilling. Later on, large scale SP studies (ERCAN et al., 1986) and resistivity and
magnetotelluric soundings (MTA, 2001) were also applied.
Fig. 1: a) Tectonic and geothermal activity map of Turkey (after ŞIMŞEK, 2001) and b) geological map of
Balçova Geothermal Site (modified from YILMAZER, 1989 and AKSOY, 2001).
The area around the Balçova geothermal site consists of Alluvium, talus and Izmir flysch (Fig. 1b). Upper Cretaceous Izmir flysch consists of metasandstones, limestone, granodiorites, serpentinite-diabase, rhyolites and phyllites. Fractured metasandstones and fault zones existing in limestone and granodiorites are permeable. Other zones of the Izmir flysch formation can be thought as impermeable. Flysch formation exceeding 2000 m depth, occupies the most of the volume of the field. This formation has some fissures, fractures and faults and the permeability is appeared in these zones. Limestone and granodiorites have fractures and faults that create secondary
34
permeability. Serpentinite and rhyolites are thought as impermeable zones (SATMAN et al., 2001).
Above the flysch formation alluvium and talus thickness of which change between 0 and 200 m take place. Although alluvium has some permeability, most parts of talus are impermeable. Alluvium existing over the field has good porosity and some permeability. Some shallow wells produce water mainly from this zone. Talus exists in southern part of the field in small amounts compared to area covered by alluvium (POLAT, 2010).
The thermal activity is manifested by hot springs that form mainly along the major fault systems in the area (EŞDER and ŞIMŞEK, 1975). As a result of intense graben tectonics, the aquifer of the
geothermal system is controlled by dipping strike-slip and active normal faults (TEZCAN, 1966;
YILMAZER, 1989).
There are two different aquifer systems in Balçova geothermal site. One of them is the hot water aquifer system found in the allochtonous limestone with Upper Cretaceous Age in the İzmir flysch formation. This formation is impermeable, and the hot waters in the aquifer are discharged by faults. The primary fault zone in the area is the Agamemnon-1 fault that cuts directly the aquifer system. The second aquifer has cold water found in the alluvium with Quaternary Age, and it is charged by surface waters. In the area, there are many water wells in the alluvium, their depths are changed 25-80 m generally. The water table is mostly changed between 11 and 20 m depths in the northern part of the area. Underwater flow direction is mainly from south to north direction (ERDOĞAN, 1990).
Our ERT monitoring studies were performed between March 2010 and February 2011. The investigations were continued along this period. We aimed to obtain the information on the difference of physical changes of shallow parts of aquifer zone in the geothermal system. These consist of fluid changes, environmental characteristics, temperature changing and re-injection process in the site. To reach this goal ERT monitoring study was preferred. ERT investigation was repeated over two lines during the different investigation periods (Figure 1b).
Synthetic Modelling Studies for Injection Model
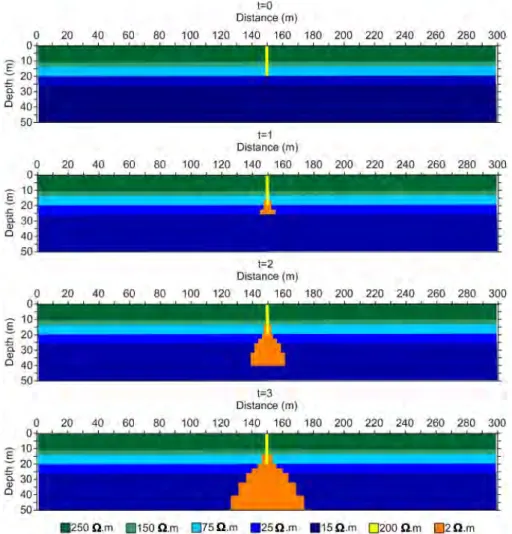
To show the effectiveness of the ERT monitoring studies on geothermal applications, we generated a synthetic injection model using Res2Dmod software (Geotomo software). The forward and inversion modeling studies were performed during this study to determine the changes related with time. In the first stage, we carried out a forward modeling studies for various time scales (t = 0, 1, 2 and 3 unit; unit is equal to month for our problem). At first there is no any injection process in this model (t = 0). Five horizontal layers that show the alluvium in the area are extended to 50 m below. The resistivity and depth of horizontal layers are given in the figure as 250 Ωm-10 m, 150 Ωm-3 m, 75 Ωm-7 m, 25 Ωm-5 m and 15 Ωm-25 m respectively. The borehole resistivity is 200 Ωm and its thickness is 2 m, while the depth of borehole is extended to 20 m. The affected area from injection was considered as a conductive zone, and the resistivity of this zone was given as 2 Ωm in the model. Thus, the resistivity value of adjacent area of the borehole was reduced according to time of injection process (Figure 2). During the forward modeling stage we used 61 electrodes with 5 m interval. Data sets were produced for Wenner and Wenner-Schlumberger arrays. Therefore the synthetic apparent resistivity data were produced for various time periods (for before and after pumping periods; t = 0, 1, 2 and 3 unit). In the second stage, the inversion process was achieved to present the effects of temporal changes for various time slices. This stage was investigated in two different approximations; smoothness inversion and time-lapse smoothness inversion using Res2Dinv software. The time-lapse inversion of the data
35
sets was carried out using a joint inversion technique where the model obtained from the reference data set was used to constrain the inversion of the later time data sets (LOKE, 1999).
Thus, reliability and resolution of the ERT method could be investigated by the modeling stage.
Fig. 2: Synthetic subsurface resistivity models for injection process related with different times (t = 0, 1, 2
and 3 unit; unit is equal to month for our problem).
Inversion results of injection model for different monitoring times are given in Figure 3 for Wenner and Wenner-Schlumberger arrays. These arrays produced close resistivity models to the synthetic injection models after the inversion. We can closely identify the subsurface resistivity values. Besides, after the t = 1 period, reduced resistivity zone clearly appeared on the inverted models. The changes caused by the injection process are appeared at the 20 m depth in both Figures 3a and 3b. Therefore, increasing in conductive zone is clearly seen in the inverted model sections. But, Wenner-Schlumberger array gives more reliable results than Wenner. The resistivity reducing effect is clearer under the borehole. In addition, we did not confirm the important changes between the standard and time lapse inversion models. Finally, we can clearly conclude that ERT is the useful technique to monitor the temporal changes in the subsurface according to the injection scenario. Also Wenner-Schlumberger configuration was given more reliable result than the Wenner array in the synthetic modeling stage.
36
Data Acquisition and Processing
To monitor the shallow changes near the boreholes, we selected two different investigation lines in Balçova site. The lines are represented in Figure 1b as profile 1 and 2. Profile 1 has almost north-south direction, while the profile 2 has almost east-west orientation. The lengths of profiles are 220 and 140 m for line 1 and 2 respectively. Profile 1 is located near the borehole-BD10, which is a re-injection hole. This borehole was used between beginning of October 2010 and the end of April 2011 as a re-injection well. Profile 2 is also located near the borehole BD-7, is a production well. This borehole did not work between April and September 2011. Overall 2D ERT data was collected by Wenner and Wenner-Schlumberger configurations along these two lines. During the measurements electrode intervals were selected as 5 m and data was collected for 8-10 levels. Before the interpretation, measured apparent resistivity data was processed by using 2D inversion technique (LOKE and BARKER, 1996; TRIPP et al., 1984; DEGROOT-HEDLIN and CONSTABLE,
1990; SASAKI, 1992). Res2Dinv software, which tries to optimize a starting subsurface model by
minimizing the differences between the measured and calculated data, was used in this study. Finite-element method was used in the forward modeling to produce the calculated data. In the time lapse inversion scheme, one data set was selected as a base and inversion process was implemented on this data set. Then, obtained resistivity model was used as a starting model in the inversions of the consecutive data sets. The inversion models were obtained after 6 iterations.
37
Fig. 3: 2D model sections obtained from the synthetic injection models; a) Wenner and b)
38
Fig. 4: 2D standard and time-lapse ERT model sections of Profile-1; a) Wenner and b) Wenner-Schlumberger
39
Interpretation
Standard and time-lapse inversion results of profile 1 are given in Figure 4. As can be seen from the figure, Wenner and Wenner-Schlumberger arrays are generally produced similar inversion models after six iterations for standard inversion approach. In all inverted resistivity sections, we can firstly observe resistive layers, which is almost 5m thickness. This layer has an interruption between 60-70 m of the line. This interruption could also be followed to the deeper part of the inversion models for all measuring periods. Therefore, we think that it could be a fault zones (possibly Agamemnon-1 fault given in Figure 1b). According to geologists, this fault has almost vertical angle. We know that this kind of fault zones that have extremely fracture and fissure properties might be recharge passages in the porous and permeable environments. Therefore, the groundwater streaming from the surface or the reservoir can be transported inside these zones. The section obtained from March 2010 data shows that the conductive zone is almost displayed in proximity of borehole-BD10. Overall model sections have closely similarity for standard and time-lapse inversion results. The conductive zones are importantly changed during the monitoring periods. The conductive zone is enlarged in the results of April 2010 data for standard inversion sections. But there is no any important change in time-lapse models of April 2010. This situation depends on the selected initial inversion model in time-lapse approximation. The conductive zone is increased in the results of Wenner-Schlumberger of May 2010 data, while it decreases in the results of Wenner configuration of May 2010 data. In September 2010 result, all sections are very similar to each other (for standard and time-lapse results). After the yearly period, the results obtained February 2011 data are partially resembled again the first model (March 2010). However, the conductive zone in the deeper part of the sections is still enlarged in whole sections both standard and time-lapse inversion. Therefore, we can determine that the important changes are formed by the climatic effects (rainfall, etc.), fault recharges and production process, which is valid the injection operation for this line due to the BD-10 re-injection well.
Profile-2 has almost a flat topography and lie near the borehole-BD7, which is a production well. The production was not made between April and September 2010 due to the moderate and hot weather conditions. All inversion sections show the horizontal layering model, which is used during the synthetic modeling stage (Figure 5). Resistive strata (>150 Ωm) are almost horizontal and extended 10 and 15 m below from the surface. Conductive strata are located under this zone, and their average resistivity is about 15 Ωm. High conductivity in the deeper part of the sections is commonly observed in the results of March and April 2010. The harmony between used configurations is very good in all sections. In addition, the results of standard and time-lapse inversion are very compatible. As a result, we can say that the climatic conditions in this profile could be affected the resistivity changes in the subsurface more than the production process.
40
Fig. 5: 2D standard and time-lapse ERT model sections of Profile-2; a) Wenner and b) Wenner-Schlumberger
arrays.
Conclusion
The results of shallow ERT monitoring studies in Balçova geothermal site indicated that the used method was very useful to investigate the changing of different physical characteristics of shallow
41
parts in a geothermal system. Particularly, the determination of these changes can be very important to determine the liquid runaways during the production stage. Therefore we can say that operational processes make an impact on physical alterations resulting together with the changes on the shallow subsurface characteristics. But, it should not be forgotten that the climatic effects such as rainfall and rapid daily temperature changes could be very important in the changes of resistivity in near surface investigations. Therefore, the rainfall and temperature records should be compared with the inversion results to achieve more interpretive results. Time-lapse inversion results give us more interpretive results than the standard inversion approximation for both synthetic and field studies. But we can determine that the identification of initial model is also important to constrain the later time data sets. In addition, this study showed that the selection of configuration type is essential to obtain more interpretive results. Thus, various configurations should be tested to confirm the suitable configuration for this problem.
Overall results presented that ERT monitoring gives us very informative results on the determination of changes of subsurface characteristics during the operations. Therefore, we can observe the noticeable near surface changes depending on the operation processes in an operated site.
As a result, operating system of geothermal companies could be run more efficiently by the help of geophysical monitoring studies.
References
AKSOY, N., 2001: Balçova-Narlıdere jeotermal sisteminin izleyiciler ile incelenmesi. – PhD Thesis,
Dokuz Eylül University, Izmir, Turkey.
DE GROOT-HEDLIN, C. and CONSTABLE, S., 1990: Occam’s inversion to generate smooth,
two-dimensional models from magnetotelluric data. – Geophysics, 55, 1613-1624.
DRAHOR, M.G. and BERGE, M.A., 2006: Geophysical investigations of the Seferihisar geothermal
area, Western Anatolia, Turkey. – Geothermics, 35, 302-320.
ERCAN, A.Ö., DRAHOR, M.G. and ATASOY, E., 1986: Natural polarization studies at Balçova
geothermal field. – Geophysical Prospecting, 34, 475-491.
ERDOĞAN, B., 1990: İzmir-Ankara Zonu’nun, İzmir ile Seferihisar arasındaki bölgede stratigrafik
özellikleri ve tektonik evrimi. – TJK Bülteni, 2, 1-20.
EŞDER, T. and ŞIMŞEK, Ş., 1975: Izmir Seferihisar alanı Çubukludağ grabeni ile dolayının jeolojisi ve
jeotermal olanakları. – MTA report, Ankara.
LOKE, M.H., 1999: Time-lapse resistivity imaging inversion. – Proceedings of the 5th Meeting of the
Environmental and Engineering Geophysical Society European Section, Em1
.
LOKE, M.H. and BARKER, R.D., 1996: Rapid least-squares inversion of apparent resistivitypseudosections by a quasi-Newton method. – Geophysical Prospecting, 44, 131-152. MERTOĞLU, O., BAKIR, N. and KAYA, T., 2003: Geothermal Application Experiences in Turkey. –
Proceedings of the European Geothermal Conference, Szeged, Hungary.
MTA, 2001: Balçova jeotermal alanı (İzmir Çeşme otobanı kuzeyi) jeoermal enerji arama projesi jeofizik etüdü raporu. Ankara, Turkey.
POLAT, C., 2010: Numerical modeling of Balçova Geothermal Field. – Msc thesis, Middle East
42
SASAKI, Y., 1992: Resolution of resistivity tomography inferred from numerical simulation. –
Geophysical Prospecting, 40, 453-463.
SATMAN, A., SERPEN, U. and ONUR, M., 2001: Reservoir and production performance of Izmir
Balcova-Narlidere geothermal field. – Report for Izmir City Council, Istanbul.
ŞIMŞEK, Ş. 2001: An overview of geothermal developments in Turkey. – Proc. ITIT Symposium on
Geothermal in Asia, Tokyo, Japan, 17-23.
SERPEN, U., AKSOY, N., ONGUR, T., YUCEL, M. and KAYAN, I., 2009: Geoscientific investigations on
north of Balçova geothermal system in Turkey. – International Journal of Geology, 3, 87-96. TEZCAN, K., 1966: İzmir Agamemnon jeofizik etüdlerinin jeotermik enerji bakımından
değerlendirilmesi. – MTA report, İzmir
TRIPP, A.C., HOHMANN, G.W. and SWIFT, C.M. Jr., 1984: Two-dimensional resistivity inversion. –
Geophysics, 49, 1708-1717.
YILMAZER, S., 1989: Geochemical features of Balçova Hot Springs and geothermal energy
43
Comparison of temperature estimates from heat transport
model and electric resistivity tomography during a shallow
heat injection and storage experiment
T
HOMASH
ERMANS1,2,
MOUBARAKD
AOUDI1,
A
LEXANDERV
ANDENBOHEDE3,
T
ANGUYR
OBERT1,
D
AVIDC
ATERINA1,2and
F
RÉDÉRICN
GUYEN11 University of Liège, Belgium, ArGEnCo, GEO³, Applied Geophysics. 2 F.R.S.-FNRS, Belgium.
3 GhentUniversity, Belgium, Department of Geology and Soil Science, Research Unit Groundwater
Modeling.
thomas.hermans@ulg.ac.be
Abstract
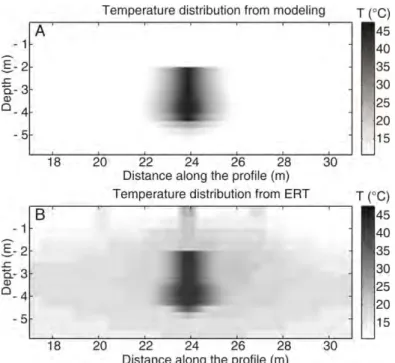
Groundwater resources are increasingly used around the world as geothermal systems. Understanding physical processes and quantification of parameters determining heat transport in porous media is therefore important. Geophysical methods may be useful in order to yield additional information with greater coverage than conventional wells. We report a heat transport study during a shallow heat injection and storage field test. Heated water (about 50°C) was injected for 6 days at the rate of 80 l/h in a 10.5°C aquifer. Since bulk electric resistivity variations can bring important information on temperature changes in aquifers (water electric conductivity increases about 2%/°C around 25°C), we monitored the test with surface electric resistivity tomography and demonstrate its ability to monitor spatially temperature variations. Time-lapse electric images clearly show the decrease and then the increase in bulk electric resistivity of the plume of heated water, during respectively the injection and the storage phase. This information enabled to calibrate the conceptual flow and heat model used to simulate the test. Inverted resistivity values are validated with borehole electromagnetic measurements (EM39) and are in agreement with the temperature logs used to calibrate the parameters of the thermo-hydrogeological model for the injection phase. The short term evolution of the ERT-derived temperature and the temperature logs is coherent for both a qualitative and quantitative use of ERT-derived temperature. However, the mid- and long-term evolution need to account for other phenomena such as variations of TDS content as a function of temperature to quantitatively use ERT estimates as temperature proxy. This field work demonstrates that surface electric resistivity tomography can monitor heat injection and storage experiments in shallow aquifers. These results could potentially lead to a number of practical applications, such as the monitoring or the design of shallow geothermal systems or the use of heated water to replace salt water in tracer tests.
Introduction
The production of geothermal energy is increasingly growing worldwide. Groundwater, through the use of geothermal heat pumps, accounts for a major part in the thermal energy use and installed capacity (LUND, 2010).