HAL Id: dumas-01624834
https://dumas.ccsd.cnrs.fr/dumas-01624834
Submitted on 26 Oct 2017Évaluation des volumes et de la fonction ventriculaires
gauches avec un algorithme automatisé en échographie
tridimensionnelle : comparaison avec l’IRM cardiaque et
implications cliniques
Maud Duval
To cite this version:
Maud Duval. Évaluation des volumes et de la fonction ventriculaires gauches avec un algorithme automatisé en échographie tridimensionnelle : comparaison avec l’IRM cardiaque et implications clin-iques. Médecine humaine et pathologie. 2017. �dumas-01624834�
HAL Id: dumas-01624834
https://dumas.ccsd.cnrs.fr/dumas-01624834
Submitted on 26 Oct 2017Évaluation des volumes et de la fonction ventriculaires
gauches avec un algorithme automatisé en échographie
tridimensionnelle : comparaison avec l’IRM cardiaque et
implications cliniques
Maud Duval
To cite this version:
Maud Duval. Évaluation des volumes et de la fonction ventriculaires gauches avec un algorithme automatisé en échographie tridimensionnelle : comparaison avec l’IRM cardiaque et implications clin-iques. Médecine humaine et pathologie. 2017. <dumas-01624834>
Université de Bordeaux
U.F.R. DES SCIENCES MEDICALES
Année 2017 - Thèse N°3106Thèse pour l’obtention du
DIPLOME d’ETAT de DOCTEUR EN MEDECINE
Discipline : Cardiologie et Maladies vasculaires
Présentée et soutenue publiquement Le 9 octobre 2017
Par Madame Maud DUVAL Née le 7 novembre 1988 à Cherbourg
Évaluation des volumes et de la fonction ventriculaires gauches
avec un algorithme automatisé en échographie tridimensionnelle :
comparaison avec l’IRM cardiaque et implications cliniques.
Thèse dirigée par Monsieur le Docteur Éric ABERGEL
Composition du jury :
Monsieur le Professeur Raymond ROUDAUT, Président Monsieur le Professeur Stéphane LAFITTE, Rapporteur
Remerciements
Monsieur le Professeur Raymond ROUDAUT, Président du jury
Je vous remercie de me faire l’honneur d’accepter de présider le jury de ma thèse. Recevez ici toute ma reconnaissance et l'expression de mon plus profond respect.
Monsieur le Professeur Stéphane LAFITTE, Rapporteur
Je vous remercie pour l’honneur que vous me faites de votre participation à mon jury de thèse. Merci d’avoir dégagé de votre temps pour discuter de mon travail et me conseiller dans sa rédaction.
Monsieur le Docteur Hubert COCHET, Juge
Je vous remercie pour l’honneur que vous me faites en acceptant d’être membre de mon jury de thèse. Je tiens à vous assurer de ma profonde reconnaissance pour l’intérêt que vous portez à ce travail.
Monsieur le Docteur Patrick DEHANT, Juge
Je vous remercie de me faire l’honneur de prendre part à mon jury de thèse. Votre enseignement bienveillant et patient restera gravé dans ma pratique. J’espère garder comme modèle tout au long de ma vie cette capacité d’étonnement et cette envie d’apprendre qui vous animent.
Madame le Docteur Françoise SORAIN, Juge
Je vous remercie de me faire l’honneur d’accepter de juger mon travail de thèse et je suis ravie d’avoir l’opportunité de travailler avec vous à nouveau prochainement.
Remerciements
A Antoine qui a réussi à me supporter au quotidien au cours de toutes ces années d’étude. La vie est douce à tes côtés. Tu es la meilleure personne que je connaisse.
A mes parents pour leur amour et leur soutien depuis le tout premier jour, qui sont le berceau de mon épanouissement personnel. A Marie et à mon ‘petit’ Martin, je vous souhaite profondément d’être heureux.
A Elsa, Gaëtan, Nanou, JB, Clém, Ingrid. Grandir avec votre amitié infaillible est une chance.
A Aude, Charlotte, Sid, Boubou, Cécile, Marie-Lou pour ces belles rencontres transformées en amitié au cours de l’internat.
Aux Docteurs : Bruno Darcy, Yann Pucheu, Ludivine Cailleba, Warren Chasseriaud, Benjamin Fiallon, Lionel Leroux, Benjamin Seguy, Antoine Cremer, Marion Lainé, Nicolas Klotz, Grégoire Massoullié, Pierre Bordachar, Philippe Ritter, Sylvain Ploux, Frédéric Sacher, Marc Simon, Christophe Chauvel, Maria Jimenez, Jean-Marie Perron, Pierre Chevallereau, Jérôme Lefèvre, Hassina Aouchiche, Aurore Flacher, Murielle Han Yee Yu, Adlane Zemmoura, Antoine Deplagne, Alexandre Maillet, Alexis Pibourdin, Sophie Skopinski.
Votre enseignement et votre exercice aura, chacun à sa manière, marqué ma vision et ma pratique de la médecine.
A Camille, Julien, Arnaud, Florent, Stan, Alex, Elodie, Jean, Hugo, Josselin, Julien, Nico, Clément, Pierre, Valentin, Anne-Iris, Sarah.
Je ne garde que de bons moments de nos stages passés ensemble.
Aux équipes soignantes, aux patients et aux externes avec qui j’ai eu des échanges enrichissants.
A Leesa pour la correction de mon anglais. A tous ceux que j’ai pu oublier sur le papier.
Sommaire
1. Avant-propos 5 2. Introduction 9 3. Methods 10 1. Study population 10 2. Acquisitions 10 a) 2D Echocardiography 10 b) 3D HeartModel 10 c) CMR 10 3. Measurements 11 a) 2D Echocardiography 11 b) 3D HeartModel 11 c) CMR 11 4. Reproducibility 11 5. Statistical Analysis 12 4. Results 13 1. Study population 132. Comparison of automated HM with CMR 13
3. Comparison of adjusted HM with CMR 13
4. Comparison of 2DE with HM and CMR 13
5. Classification according to EF 14 6. Subgroups analyses 14 7. Reproducibility 14 5. Discussion 15 6. Conclusion 17 7. References 18 8. Tables 20
1. Avant-propos
L’évaluation de la fonction systolique ventriculaire gauche de son patient est l’une des premières questions qui s’impose au cardiologue et qui guide sa prise en charge en pratique clinique. L’échographie transthoracique est l’outil diagnostic du quotidien par excellence : au lit du patient, sûre, rapide, peu coûteuse, et permettant d’évaluer multitude de paramètres morphologiques couplés à des données hémodynamiques. A l’heure de l’imagerie multi-modalité, l’échographie a de sérieux concurrents mais elle sait se montrer compétitive avec une évolution constante et rapide.
D’une évaluation en monoplan avec le TM, puis en biplan avec le Simpson, elle permet désormais une évaluation tridimensionnelle (3D). Celle-ci est préférable avec un fonctionnement permettant une modélisation cardiaque basée sur les images, au plus proche de la réalité. Pendant la dernière décennie, l’échographie 3D est passée d’une technique a posteriori, basée sur des reconstructions à partir de plans 2D, longue et fastidieuse, à une méthode avec des sondes intégrées et des algorithmes dédiés permettant de s’appliquer en temps réel au cours de l’examen au lit du patient. De nombreuses données de la littérature convergent, confirmant la supériorité du 3D par rapport au 2D pour l’évaluation des volumes et de la fonction ventriculaires gauches. Cependant elle n’est pas encore disponible dans toutes les mains et malgré ses avantages et sa présence dans les recommandations européennes et américaines pour la pratique quotidienne, nous sommes obligés de constater qu’elle est loin d’être actuellement la règle. L’analyse de la fonction cardiaque est encore très souvent principalement basée sur l’évaluation visuelle et le contourage manuel 2D, hautement dépendants de l’opérateur et de son expérience.
Afin d’harmoniser les pratiques, de limiter la part de variabilité humaine et de gagner du temps, quelle pourrait être une meilleure solution qu’une méthode fiable entièrement automatisée, rapide, s’appuyant sur des images 3D acquises et analysées en temps réel ? C’est ce que propose la nouvelle technique HeartModel de Philips, avec des premiers résultats publiés très encourageants.
L’objectif de ce travail était donc d’évaluer cette nouvelle méthode automatisée en termes de faisabilité, de fiabilité et de reproductibilité. En plus de favoriser l’utilisation du 3D en pratique quotidienne par sa rapidité et sa facilité d’utilisation, c’est l’entière automatisation de la mesure qui est ici innovante, nous nous sommes donc interrogés sur les conséquences cliniques potentielles, en terme individuel, d’une confiance aveugle en cette mesure.
Évaluation des volumes et de la fonction ventriculaires gauches
avec un algorithme automatisé en échographie tridimensionnelle :
comparaison avec l’IRM cardiaque et implications cliniques.
Résumé :
ContexteL’échographie tridimensionnelle (3DE) est supérieure à l’échographie bidimensionnelle (2DE) pour la quantification des volumes et de la fonction ventriculaires gauches (VG) mais peu répandue en pratique quotidienne.
L’objectif de cette étude était d’évaluer les performances d’une méthode 3DE entièrement automatisée d’évaluation du ventricule gauche et d’évaluer les enjeux cliniques qui en découlent.
Méthode et résultats
111 patients adressés pour une IRM cardiaque ont également bénéficié d’une échographie
(EPIQ 7C, Philips) dans la même heure avec quantification du VG par plusieurs méthodes :
2DE du Simpson biplan, 3DE automatisée HeartModel (HM) avec et sans ajustements manuels et avec différents réglages de contours, et IRM.
Sur les 104 patients avec une fenêtre ultrasonore adéquate, le volume télédiastolique (VTD), le volume télésystolique (VTS) et la fraction d’éjection (FE) du VG mesuré par HM totalement automatisé avaient une bonne corrélation (r 0.64-0.76) et de vastes limites d’agrément comparés aux résultats de l’IRM. Ces comparaisons devenaient excellentes après ajustements manuels (biais VTD = -2mL, r = 0.87 / biais VTS = -7mL, r = 0.92 / biais FE = 2%, r = 0.89). En établissant une classification des patients par groupe de FE (FE ≥ 50 % / 35-50 % / ≤ 35 %), obtenue en utilisant HM entièrement automatisé avec les meilleurs réglages de contour, 39 patients étaient mal classés par rapport aux résultats de l’IRM, contre seulement 14 patients mal classés après ajustements manuels. Les reproductibilités intra- et inter-observateur étaient bonnes. HM semblait plus fiable pour les VG normaux.
Conclusion
L’évaluation du VG avec HM avait d’excellentes corrélations et agrément comparé au gold standard par IRM après ajustements manuels, qui amélioraient significativement la classification des patients avec des conséquences cliniques évidentes.
Mots-clé : ventricule gauche, échocardiographie tridimensionnelle, automatisation, fraction
Left
ventricular
quantification
with
three-dimensional
transthoracic echocardiography using an automated algorithm:
comparison with cardiac magnetic resonance and clinical
implications.
Abstract:
AimsThree-dimensional echocardiography (3DE) is recommended for assessing left ventricular (LV) quantification but underused in clinical practice. We sought to evaluate the accuracy of an automated 3DE method for LV assessment and the implications for clinical management, as compared to cardiac magnetic resonance (CMR).
Methods and results
111 patients referred for CMR evaluation underwent echocardiography (EPIQ 7C, Philips) within the same hour. LV volumes and ejection fraction (EF) were obtained using various methods: 2DE biplane Simpson’s, automated 3DE software (HeartModel (HM)) with and without manual adjustments and with different automatic border settings, and CMR.
Among 104 patients with an adequate acoustic window, using fully-automated HM LV end-diastolic volume (EDV), end-systolic volume (ESV) and EF had good correlations (r 0.64-0.76) with all borders settings, compared to CMR. CMR correlations and agreement were largely improved and became excellent after manual adjustments (EDV bias = -2 mL, r = 0.87 / ESV bias = -7 mL, r = 0.92 / EF bias = 2 %, r = 0.89). Classifying patients according to the EF group (EF ≥ 50 % / 35-50 % / ≤ 35 %), 39 patients were misclassified using fully-automated HM with best-settings as compared with CMR, and classification was significantly improved after manual adjustments (14 patients misclassified). Intra- and inter-observer variability were low. HM seemed more accurate for patients with normal LV.
Conclusion
Compared to CMR, LV assessment using HM had excellent correlations and agreement after manual adjustments, which significantly improved classification of patients and this has obvious clinical consequences.
Key-words: left ventricle, three-dimensional echocardiography, automation, ejection fraction,
Abbreviations:
2D: Two-dimensional
2DE: Two-dimensional echocardiography 3D: Three-dimensional
3DE: Three-dimensional echocardiography BMI: Body mass index
CMR: Cardiac magnetic resonance EDV: End-diastolic volume
EF: Ejection fraction ESV: End-systolic volume HM: HeartModel
HM(80-20): HeartModel with initial-settings HM(40-30): HeartModel with best-settings HR: Heart Rate
LV: Left ventricle
2. Introduction
Making critical decisions with regard to heart failure treatment, the timing of surgery in cases of regurgitant valve disease or indications for implantable defibrillators1
are based on left ventricular (LV) volumes and function. LV assessment needs to be reliable and reproducible and multiple imaging modalities are now available. Two-dimensional transthoracic echocardiography (2DE) is the method commonly used in daily practice and most echocardiographic laboratories currently evaluate LV systolic function using the modified biplane Simpson technique. However, this method has some well-known weaknesses: the relatively low reproducibility and accuracy of this method, which is attributed to the use of foreshortened views, the blindness of shape distortions not visualized in the apical two- and four- chambers views and the use of geometric assumptions.3
Nowadays, cardiac magnetic resonance (CMR) is considered the most accurate in vivo method to assess LV volumes, especially on account of its high resolution since it allows the
delineation of the compacted myocardium and trabeculae interface, and is accepted as the
standard reference technique for accurate and reproducible evaluation for LV volumes and function.4
Three-dimensional echocardiography (3DE) showed significantly smaller volumes biases with cardiac magnetic resonance (CMR)5
compared to 2DE with better reproducibility. Although its availability is actually less than 2DE, 3DE is a recommended echocardiographic alternative for LV assessment in guidelines.3
Unfortunately, time-consuming workflows have limited its integration into real-life practice.
Recently, new 3DE HeartModel Software (HM) proposed a rapid real-time and fully-automated quantification of LV volumes and function with promising results.6
However, clinical implications of its use have not yet been evaluated.
Therefore, the aims of our study were to:
1) Test the accuracy of a fully automated algorithm (HM) that simultaneously quantifies 3DE-derived LV volumes and ejection fraction against 2DE using CMR as a gold standard;
2) Test the impact of manual adjustments on HM;
3) Evaluate if the use of fully-automated HM as compared to manually-adjusted HM has clinical implications;
3. Methods
1. Study population
We prospectively enrolled 111 unselected patients referred for CMR in St Augustin’s Clinic in Bordeaux (France) from June 2016 to May 2017. Only one patient refused to participate. After the CMR interpreted by a first operator (E.A.), patients underwent a comprehensive transthoracic echocardiography (TTE) of their left ventricle by another operator (M.D.), blind to the result of the CMR analysis. To minimize time-dependent variations of hemodynamic characteristics, TTE began less than 30 min after CMR. We excluded 7 patients (7%) on account of a poor acoustic window, which did not provide an adequate echocardiographic image for 3D analysis. The study complies with the declaration of Helsinki and informed consent was obtained from each participant before TTE.
2. Acquisitions
a) 2D Echocardiography
Echocardiographic acquisitions were performed using the Philips EPIQ 7 ultrasound system with the X5-1 transducer. The patient lay in the left lateral decubitus position and the probe was placed at the apex of the heart, according to the guidelines. The electrocardiogram was connected and the gain was adjusted until a regular waveform appeared at the bottom of the screen. After optimizing gain, compression, and depth, two- and four-chambers datasets in 2DE, center on LV, were acquired.
b) 3D HeartModel
A 3D wide-angled full-volume single-beat data set was acquired, taking care to center on and to include the entire LV and left atrial cavities (cf. Figure 1A p. 24). Depth, width, gain and compression were optimized to improve frame rate and endocardial visualization. The functioning of HM has already been extensively described by Tsang et al.6
. Briefly, HM automatically identifies heart localization. The end-diastolic phase is estimated as the frame corresponding to the R-peak in the ECG waveform, and the end-systolic phase is estimated by motion of the mitral plane and on the smallest cavity area detected. HM creates a preliminary end-diastolic and end-systolic 3D model of the LV cavity. Subsequently, an automatic analytical algorithm consisting of knowledge-based identification (> 1000 3D LV database with a wide range of quality, size and function) of the initial global shape and LV chamber orientation, followed by patient-specific adaptation, traces end-diastolic and end-systolic endocardial borders from which LV volumes are directly measured.
3. Measurements
a) 2D Echocardiography
We measured LV volumes and function using the modified biplane Simpson technique of disk (2D): end-diastolic and end-systolic endocardial borders were manually traced on frozen 2D images obtained from the apical two- and four-chamber views to derive EDV and ESV by geometric assumption. The LVEF was calculated according to the formula EF (%) = ((EDV-ESV)/EDV)x100.
b) 3D HeartModel
-Automated HM border settings
For each phase (EDV and ESV), the HM algorithm detects 2 endocardial borders: the inner border located at the blood-tissue interface (named 0) and the outer border located at the non-compacted/-compacted myocardium interface (named 100). HM software provides a user-adjustable slider. The default slider position can be preset to the user’s preference from 0 to 100 between the inner and outer border, and can be secondarily changed. During the initial acquisition, we used HM(80-20) initial-settings as recommended by the vendor: 80 to determine EDV and 20 to determine ESV. Moreover, we tested 10 others automatic settings for EDV 20-30-40-50-60-70-90-100) and 10 others automatic settings for ESV (0-10-30-40-50-60-70-80-90-100). (cf. Figure 1B p. 24)
-Adjusted HM
HM software also provides a regional editing tool which allows manual adjustments for LV volumes after the work of the automatic analytical algorithm. The adjusted HM is a manually optimized LV delineation at end-diastole and end-systole for each patient via control points placed along the contour. Adjustments were realized in a display of anatomically correct non-foreshortened 2D planes (apical 2-, 3- and 4- chambers views) extracted from the 3D dataset. All HM datasets were adjusted as deemed necessary with this method. (cf. Figure 1C p.24 )
c) CMR
Data were analyzed using commercially available semiautomatic software Argus (Siemens). End-diastolic and end-systolic endocardial borders were automatically traced in every slice and manually adjusted if needed leaving the papillary muscles and the trabeculations within the LV cavity. EDV and ESV were calculated after adding together all sub-volumes of all short-axis slices, and EF was derived from volumes as previously described.
5. Statistical Analysis
Continuous variables were expressed as mean ± standard deviation (SD) and nominal values as percentages. HM volumes and function were compared with the corresponding 2D or CMR value using linear regression with the Pearson correlation coefficient and the Bland-Altman analysis to assess the bias (mean difference) and the 95% limits of agreement (LOA = 2 SD around the mean difference). Intra- and inter-observer variability were assessed using the absolute difference between corresponding repeated measurements expressed as a percentage of their mean measured value of each parameter. To verify the significance of the biases, paired Student t tests were performed. Statistical difference was considered significant when values of p < 0.05. All analysis were performed using XLSTAT.
4. Results
1. Study population
We analyzed data from 104 patients: 75 (72 %) men, mean age 59 ± 16 years and mean BMI 26 ± 4 kg/m2
. The mean 3DE volume rate was 19.8 ± 2.3 Hz (range from 15 to 26 Hz). Image quality was considered good for 76 (73 %) - at most, 1 segment was not well visualized segment in one view - and adequate for 28 (27 %) patients - ≤ 2 of 6 contiguous segments were not well visualized in one view and one or fewer in the other views. Patients were mainly in sinus rhythm (n = 98), the remaining 6 patients were in atrial fibrillation. Cardiac pathologies were as follows: 35 (34 %) patients had ischemic heart disease, 34 (33 %) had non-structural heart diseases, 11 (10 %) had non-ischemic dilated cardiomyopathy, 6 (6 %) had valvular heart-disease, 6 (6 %) had congenital heart disease, 5 (4 %) had myocarditis and 7 (7 %) had other cardiopathies. LV volumes and the LVEF obtained by the different imaging modalities are presented in Table 1 (cf. p. 20).
2. Comparison of automated HM with CMR
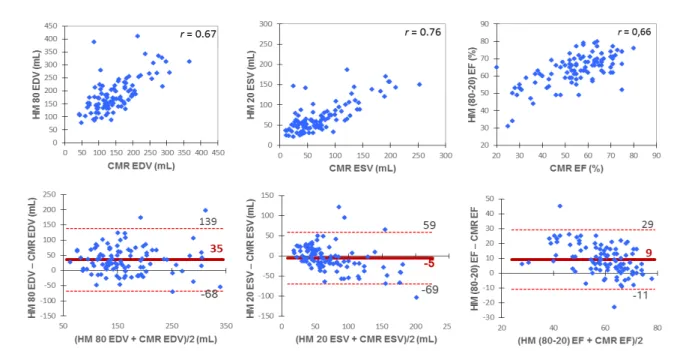
Automated HM with initial recommended settings HM(80-20) overestimated EDV and EF and underestimated ESV with good correlations with CMR. (cf. Figure 2 p. 25)
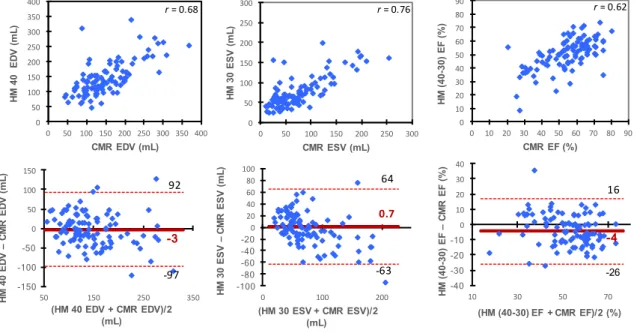
From all automatic border settings tested for HM, all Pearson’s correlation coefficients were quite similar and showed a good correlation compared to CMR for ESV (r range 0.75 to 0.76) and for EDV (r range 0.64 to 0.68). To limit bias in LV volumes assessment, the best settings were HM(40-30) but with relatively low precision and wide limits of inter-technique agreement as presented in Figure 3 (cf. p. 26).
3. Comparison of adjusted HM with CMR
All data-sets were manually adjusted as deemed necessary. Adjusted HM had the best accuracy compared with CMR with minimal biases of -2 mL, -7 mL and 2 % respectively for EDV, ESV and EF, narrower limits of agreement and excellent coefficient correlations above 0.9. (cf. Figure 4 p. 27)
The average differences between adjusted HM and HM(80-20) were as follows: -35 ± 88 mL for EDV, 0.1 ± 53 mL for ESV and -7 ± 18 % for EF ; for adjusted HM versus HM(40-30) the differences were 1 ± 62 mL, -7 ± 48 mL and 6 ± 17 % respectively for EDV, ESV and EF.
4. Comparison of 2DE with HM and CMR
As we can see in Table 2 (cf. p. 21), 2DE significantly underestimated LV volumes as
5. Classification according to EF
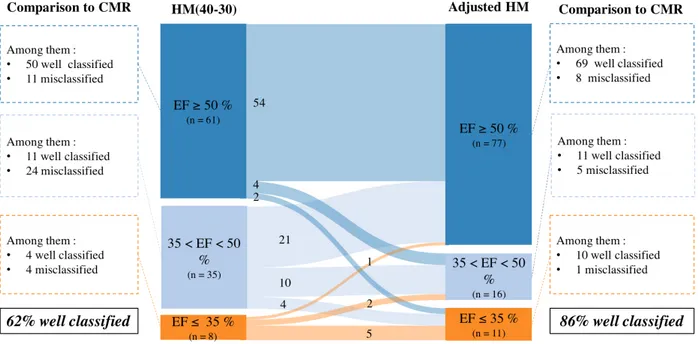
The potential reclassification of patients according to EF was analyzed after manual adjustments. Patients were classified into 3 groups according to EF, and commonly accepted cut-offs for clinical decision making regarding heart failure were used7: EF ≥ 50 %, < 50 and
> 35 %, and ≤ 35 %. We compared the classification of patients using 4 methods: CMR; automated HM with initial-settings HM(80-20); automated HM with our best-settings HM(40-30); and adjusted HM. As compared to CMR, using HM(80-20) 32 patients were misclassified, using HM(40-30) 39 patients were misclassified, and using adjusted HM 14 patients were misclassified.
More precisely, 4 patients with EF ≤ 35 % using HM(40-30) had in fact ≥ 35 % using CMR ; 3 of these 4 patients were correctly classified using adjusted HM. Inversely, 8 patients with EF ≤ 35 % using CMR had EF ≥ 35 % using HM(40-30); 6 of these 8 patients were correctly classified using adjusted HM. With initial-settings HM(80-20), classification of patients with low EF was worse: with the overestimation of EF using these settings, we missed 10 patients out of 12 with EF ≤ 35 % using CMR; 8 of these 10 patients were correctly classified using adjusted HM. Finally, with adjusted HM, we missed only 2 patients out of 12 with EF ≤ 35 % using CMR, and inversely only 1 patient was classified EF ≤ 35 % using adjusted HM and had EF ≥ 35 % using CMR. Detailed results are presented in a Sankey diagram in Figure 5 (Cf. p. 28).
6. Subgroups analyses
To explore the impact of various factors on HM accuracy, using CMR as a reference, biases and SDs between adjusted HM and CMR were also obtained for the following subgroups : sex, BMI > 25 or ≤ 25 kg/m2
, with or without regional wall motion, good or adequate echogenicity, LVEF ≤ 50 % or > 50 % and LVEDV ≥ 150 mL or < 150 mL. Our subgroups analyses suggested that sex (p range 0.58 to 0.95), BMI (p range 0.49 to 0.73) and echogenicity (p range 0.08 to 0.2) had no impact on adjusted HM. Otherwise, factors significantly associated to increase biases were dilated ventricle (EDV > 150mL, p < 0.0001 to 0.004), EF < 50 % (p range 0.006 to 0.03) and the presence of regional wall motion for ESV (p = 0.02) and EF (p = 0.01). The subgroups analyses are available in Table 3 (cf. p.
22).
7. Reproducibility
The exact same result was obtained when repeating the HM analysis on the same dataset without setting modifications or regional adjustments, because of the deterministic convergence response of the fully automated software without human intervention. When manual adjustments were applied to the automatic contours, not surprisingly inter-observer variability was higher than intra-observer variability on the same dataset. Inter-observer variability was highest for EDV (9 ± 12 %) but remained low for all comparisons. All
5. Discussion
The main findings of this prospective study are as follows:
1) Fully-automated HM LVEF and LV volumes had good correlations with 2DE and CMR, with small biases compared to CMR with optimal settings;
2) However, CMR correlations and agreement were largely improved and became excellent after manual adjustments of HM;
3) When considering classification according to the EF pertinent group (EF ≥ 50 %, EF 35-50 % and EF ≤ 35 %), the use of adjusted HM had a significant clinical impact: 62 % of patients were correctly classified using fully-automated best-settings HM(40-30) while 86 % of patients were correctly classified using adjusted HM;
4) HM appeared to be particularly reliable for normal LV (non-dilated, good EF, no regional wall motion).
In recent guidelines,3
LV assessment using 3DE is recommended in clinical practice. However, until recently, 3DE was not often routinely used: dedicated probes were initially needed, with the acquisition of multiple subvolumes during multi-beats. This required an optimal breath-hold, stable probe positioning, and a regular heart rhythm. Moreover, after this long acquisition time, a lengthy off-line analysis was necessary to obtain 3DE LV evaluation: mean time 408 ± 160 sec.8
To perform the measurements, HM recently proposed automated software that rapidly quantifies LV volumes and function in real-time and on a single-beat dataset, with no required input once the 3DE has loaded. First validations were encouraging: on a sample of 65 patients, Tsang et al.6
reported excellent correlations and agreement compared to CMR without any manual adjustment (r range 0.85 to 0.93), with an obvious gain of time (analysis time was 26 ± 2 s for the automated program without adjustment). On a sample of 54 patients, Levy et al.9
also reported excellent correlations and agreement without adjustment (r range 0.91 to 0.93) compared to CMR.
Our results are slightly different: we obtained good correlations and agreement with fully-automated HM (r range 0.62 to 0.76) but significantly lower than previously reported and an important improvement was obtained after manual adjustments (r range 0.87 to 0.92). We could not explain this difference by a lack in our methodology: we prospectively recruited, to our knowledge, the biggest CMR sample size for a comparative study with HM; contrary to other studies that accept a 24h delaybetween exams6,9 special care was taken that TTE commenced < 30 minutes after CMR. This point is crucial, since EF may be a moving target: beat-to-beat variability due to blood pressure variation10, inotropic state, HR. Moreover, because it appeared necessary, manual adjustments have been performed for every patient in our study. In the Tsang et al.6 study, although the conclusion focused on automated quantification, their data showed a significant improvement of LV quantification after manual adjustments on HM: for example, compared to CMR, bias for EDV was 24 mL for HM without adjustment and 10 mL for HM after adjustments. As a matter of fact, manual adjustments act as a safeguard and ensure that the cardiologist needs to keep an eye on the machine functioning. Also for CMR, it has been demonstrated that manual adjustments are
reclassified according to EF, switching 62 % of well-classified patients to 86 % compared to CMR. With best-settings HM(40-30), we missed 8 patients out of 12 with an EF ≤ 35 % and a discussion of an implantable defibrillator, and 10 out of 12 with initial-settings HM(80-20), instead of 2 out of 12 with adjusted HM. These results confirmed the clinical relevance of using manually adjusted HM instead of fully-automated HM: aside from having an excellent correlation, narrow agreement and minimal biases as compared to CMR, it improves the clinical value of this method.
Performant fully-automated HM is of course a priority objective: in the Tsang study,6
reproducibility of LV volumes was perfect with the automated program, with an inter-observer variability of zero. This is the reason why we evaluated different automatic settings in our study, and we found 40-30 as the best settings to minimize biases with CMR results. In other studies, reported best-settings were different: 80-40 for Levy et al.9
, 74-68 for Medvedofsky et al.12
, 75-57 for Tamborini et al.13
and in the Tsang et al. study6
settings were not specified. More data seems necessary to determine optimal initial-settings. Again, optimizing settings seemed important but not sufficient and could not replace manual adjustments.
Patients’ characteristics may also influence results obtained by HM. In our study, HM feasibility was high (93 %) and comparable to previous studies: 94% for Tsang et al.,6 86% for Levy et al.9 and 90% for Medvedofsky et al.14In contrast to a known weakness of 2DE,15
reproducibility was high for HM, even with manual adjustments. This is a major point especially for patients’ longitudinal follow-up16
and could minimize the sample size of patients needed for clinical trials. Here, as well as for others patients, 9,12
biases with CMR were higher for dilated LV, with the significant volume underestimation probably related to a decrease in spatial resolution. As proposed by Thavendiranathan et al.17 for other software, an
automatic higher setting for dilated LV could reduce this volume underestimation. Contrary to Shimada et al.18
whose meta-analysis results suggested that female gender was associated with more underestimation, we found that female gender had no impact on HM accuracy. In the knowledge that we excluded poor quality images, we found that echogenicity made no significant impact on HM, like Medvedofsky et al.14
who reported the same results of accuracy in subgroups of adequate or good echogenicity in an echocardiographic study with no CMR comparison.
Limitations
Our results were derived from a single-center experience. The HM evaluation was blind from CMR but not from the 2D LV assessment which was performed beforehand by the same investigator. We tested intra- and inter-observer reproducibility on the same dataset but we did not measure test-retest variation. We excluded poor echogenicity patients. Unfortunately in our study we could not analyze the possible impact of an arrhythmia on the software because only 6 peoples were in atrial fibrillation.
6. Conclusion
The results of our study indicate that HM is a good 3DE software, with many characteristics in favor of its use in daily practice: it uses the same 2DE-3DE probe, is easy to perform, has no apnea, uses a single-beat, and can be used without off-line analysis to obtain results. However, it can-not be considered a fully-automated software. Indeed, in the present study, manual adjustments were necessary to obtain reliable LV volumes and EF as compared to CMR. These adjustments improve statistical correlations and biases, but above all they are crucial for applying the technique in daily practice. Focusing on the 12 patients with LVEF ≤ 35% with CMR and eligible for an implantable defibrillator is demonstrative: only 2 patients had LVEF ≤ 35% with fully-automated initial-settings HM(80-20), while 10 out of 12 patients were correctly classified after manual adjustments.
7. References
1. Moss A, Zareba W, Hall W, et al. Prophylactic Implantation of a Defibrillator in Patients With Myocardial Infarction and Reduced Ejection Fraction. N Engl J Med. 2002;346(12):877-883.
2. Lang RM, Badano LP, Tsang W, et al. EAE/ASE recommendations for image acquisition and display using three-dimensional echocardiography. J Am Soc
Echocardiogr. 2012;25(1):3-46.
3. Lang RM, Badano LP, Mor-Avi V, et al. Recommendations for cardiac chamber quantification by echocardiography in adults: An update from the American society of echocardiography and the European association of cardiovascular imaging. Eur Heart J
Cardiovasc Imaging. 2015;16(3):233-271.
4. Mor-Avi V, Jenkins C, Kühl HP, et al. Real-Time 3-Dimensional Echocardiographic Quantification of Left Ventricular Volumes. Multicenter Study for Validation With Magnetic Resonance Imaging and Investigation of Sources of Error. JACC Cardiovasc
Imaging. 2008;1(4):413-423.
5. Dorosz JL, Lezotte DC, Weitzenkamp DA, Allen LA, Salcedo EE. Performance of 3-dimensional echocardiography in measuring left ventricular volumes and ejection fraction: A systematic review and meta-analysis. J Am Coll Cardiol. 2012;59(20):1799-1808.
6. Tsang W, Salgo IS, Medvedofsky D, et al. Transthoracic 3D Echocardiographic Left Heart Chamber Quantification Using an Automated Adaptive Analytics Algorithm. JACC Cardiovasc Imaging. 2016;9(7):769-782.
7. Ponikowski P, Voors AA, Anker SD, et al. 2016 ESC Guidelines for the diagnosis and treatment of acute and chronic heart failure. Eur Heart J. 2016;37(27):2129-2200m. 8. Pouleur A-C, le Polain de Waroux J-B, Pasquet A, et al. Assessment of left ventricular
mass and volumes by three-dimensional echocardiography in patients with or without wall motion abnormalities: comparison against cine magnetic resonance imaging.
Heart. 2008;94(8):1050-1057.
9. Levy F, Dan Schouver E, Iacuzio L, et al. Performance of new automated transthoracic three-dimensional echocardiographic software for left ventricular volumes and function assessment in routine clinical practice: Comparison with 3 Tesla cardiac magnetic resonance. Arch Cardiovasc Dis. 2017.
10. Pickering T, Harschfield G, Kleinert H, Blank S, Laragh G. Blood pressure during normal daily activities, sleep, and exercise. Comparison of values in normal and hypertensive subjects. J Am Med Assoc. 1982;247(7):992-996.
11. Luk W, AW A-Y, Lo A, Loke T, Ng T. Comparing left ventricular ejection fraction measurement using cardiovascular magnetic resonance imaging. Radiol Technol. 2014;85(5):949.
12. Medvedofsky D, Mor-Avi V, Amzulescu M, et al. Three-dimensional echocardiographic quantification of the left-heart chambers using an automated adaptive analytics algorithm: multicentre validation study. Eur Hear J -Cardiovascular
14. Medvedofsky D, Mor-Avi V, Byku I, et al. Three-Dimensional Echocardiographic Automated Quantification of Left Heart Chamber Volumes Using an Adaptive Analytics Algorithm: Feasibility and Impact of Image Quality in Nonselected Patients.
J Am Soc Echocardiogr. 2017:1-7.
15. Jenkins C, Bricknell K, Hanekom L, Marwick TH. Reproducibility and accuracy of echocardiographic measurements of left ventricular parameters using real-time three-dimensional echocardiography. J Am Coll Cardiol. 2004;44(4):878-886.
16. Lorenzini C, Lamberti C, Aquilina M, Rocca A, Cortesi P, Corsi C. Reliability of Left Ventricular Ejection Fraction from Three-Dimensional Echocardiography for Cardiotoxicity Onset Detection in Patients with Breast Cancer. J Am Soc
Echocardiogr. 2017:1-8.
17. Thavendiranathan P, Liu S, Verhaert D, et al. Feasibility, accuracy, and reproducibility of real-time full-volume 3D transthoracic echocardiography to measure LV volumes and systolic function: A fully automated endocardial contouring algorithm in sinus rhythm and atrial fibrillation. JACC Cardiovasc Imaging. 2012;5(3):239-251.
18. Shimada YJ, Shiota T. A meta-analysis and investigation for the source of bias of left ventricular volumes and function by three-dimensional echocardiography in comparison with magnetic resonance imaging. Am J Cardiol. 2011;107(1):126-138.
8. Tables
Table 1: Results from left ventricular quantification with different imaging
modalities in all study patients (n = 104)
EDV (mL) ESV (mL) EF (%)
2D echocardiography 117 ± 46 50 ± 35 60 ± 13
Adjusted HM 147 ± 54* 68 ± 42 56 ± 12
HM(80-20) 183 ± 67 69 ± 36* 64 ± 9
CMR 149 ± 64 75 ± 51 54 ± 14
Results are presented as mean ± standard deviation *p-values > 0.05 versus CMR (Student Test)
CMR = cardiac magnetic resonance; EDV = end-diastolic volume; ESV = end-systolic volume; EF = ejection fraction; HM = HeartModel; HM(80-20) = fully-automated HeartModel with initial-settings.
Table 2: Comparison of 2DE results with HM and CMR
* All p-values < 0.0001 (Student test)
2DE = two-dimensional echocardiography; CMR = cardiac magnetic resonance; EDV = end-diastolic volume; ESV = end-systolic volume; EF = ejection fraction; HM = HeartModel; HM(80-20) = fully-automated HeartModel with initial-settings; HM(40-30) = fully-automated HeartModel with bes -settings; LOA = limits of agreement.
EDV (mL) ESV (mL) EF (%) Bias ± LOA r Bias ± LOA r Bias ± LOA r 2DE vs CMR -33 ± 63* 0.8 -25 ± 50* 0.88 3 ± 10* 0.88 2DE vs HM(80-20) -67 ± 94* 0.72 -18 ± 49* 0.77 -4 ± 13* 0.71 2DE vs HM(40-30) -29 ± 77* 0.72 -24 ± 50* 0.77 9 ± 17* 0.67 2DE vs Adjusted HM -30 ± 55* 0.86 -18 ± 32* 0.93 3 ± -9* 0.93
Table 3: Part of results of subgroups analyses
Group HM
mean ± SD
CMR
mean ± SD Bias LOA p-value
Impact of End-diastolic volume (EDV, mL) (< 150 n = 61, ≥ 150 n = 43) EF (%) EDV < 150 61 ± 7 61 ± 10 -0.4 13 0.004 EDV > 150 49 ± 14 45 ± 13 -4 8 EDV (mL) EDV < 150 116 ± 25 106 ± 26 -9 48 < 0.0001 EDV > 150 191 ± 53 210 ± 50 19 66 ESV (mL) EDV < 150 45 ± 13 43 ± 17 -2 26 < 0.0001 EDV > 150 101 ± 46 121 ± 47 19 44 Impact of ejection fraction (EF, %) (≤ 50% n = 30, >50% n = 74) EF (%) EF < 50% 41 ± 9 38 ± 8 -4 10 0.03 EF > 50% 62 ± 5 62 ± 8 -1 12 EDV (mL) EF < 50% 193 ± 57 205 ± 63 13 76 0.03 EF > 50% 128 ± 40 126 ± 48 -2 54 ESV (mL) EF < 50% 117 ± 44 132 ± 50 15 46 0.006 EF > 50% 48 ± 18 52 ± 27 3 36 Impact of regional wall motion (RWM) (with RWM n=26, without RWM n=78): EF (%) without RWM 58 ± 10 57 ± 12 -1 12 0.01 with RWM 49 ± 15 45 ± 13 -4 10 EDV (mL) without RWM 139 ± 52 140 ± 64 1 60 0.34 with RWM 170 ± 55 177 ± 57 7 66 ESV (mL) without RWM 61 ± 36 65 ± 46 4 37 0.02 with RWM 91 ± 50 105 ± 51 15 47
CMR = cardiac magnetic resonance; EDV = end-diastolic volume; ESV = end-systolic volume; EF = ejection fraction; HM = HeartModel; RWM = regional wall motion.
Table 4: Intra- and inter-observer reproducibility data (n = 20)
EF EDV ESV Variability (%) Intra-observer 5 ± 4 6 ± 5 6 ± 7 Inter-observer 8 ± 6 9 ± 12 7 ± 109. Figures
Figure 1: Automated 3D echocardiography for left ventricular
quantification with HeartModel
The program also displays the left atrial cast, but this is not considered in the present study.
EDV 0
EDV 100
ESV EDV
A) High-frame rate single-beat 3DE dataset with fully-automated detection of left ventricle
endocardial surface
B) Global settings editing
Figure 2: Correlations and Bland-Altman analysis of left ventricular
volumes and function with HM(80-20) compared with CMR
CMR = cardiac magnetic resonance; EDV = end-diastolic volume; ESV = end-systolic volume; EF = ejection fraction; HM = HeartModel; HM(80-20) = fully-automated HeartModel with initial-settings.
Figure 3: Correlations and Bland-Altman analysis of left ventricular
volumes and function with HM(40-30) compared with CMR
CMR = cardiac magnetic resonance; EDV = end-diastolic volume; ESV = end-systolic volume; EF = ejection fraction; HM = HeartModel; HM(40-30) = fully-automated HeartModel with best-settings.
0.7 -63 64 -100 -80 -60 -40 -20 0 20 40 60 80 100 0 100 200 HM 30 ESV – CMR E S V ( mL ) (HM 30 ESV + CMR ESV)/2 (mL) -3 -97 92 -150 -100 -50 0 50 100 150 50 150 250 350 HM 40 ED V – CMR ED V (mL ) (HM 40 EDV + CMR EDV)/2 (mL) 0 50 100 150 200 250 300 0 50 100 150 200 250 300 HM 30 E S V ( mL ) CMR ESV (mL) 0 50 100 150 200 250 300 350 400 0 50 100 150 200 250 300 350 400 HM 40 ED V (mL ) CMR EDV (mL) 0 10 20 30 40 50 60 70 80 90 0 10 20 30 40 50 60 70 80 90 HM (4 0-30) EF (%) CMR EF (%) -4 -26 16 -40 -30 -20 -10 0 10 20 30 40 10 30 50 70 HM (4 0-30) EF – CMR E F (%) (HM (40-30) EF + CMR EF)/2 (%) r = 0.62 r = 0.68 r = 0.76
Figure 4: Correlations and Bland-Altman analysis of left ventricular
volumes and function with adjusted HM compared with CMR
CMR = cardiac magnetic resonance; EDV = end-diastolic volume; ESV = end-systolic volume; EF = ejection fraction; HM = HeartModel.
0 50 100 150 200 250 300 0 50 100 150 200 250 300 Adus te d HM E S V ( mL ) CMR ESV (mL) -7 -46 33 -100 -80 -60 -40 -20 0 20 40 60 80 100 0 100 200 Adj us te d HM E S V -CMR E S V (mL )
(Adjusted HM ESV + CMR ESV)/2 (mL) 0 50 100 150 200 250 300 350 400 0 50 100 150 200 250 300 350 400 Adj us te d HM ED V (mL ) CMR EDV (mL) -2 -64 58 -150 -100 -50 0 50 100 150 50 150 250 350 Adj us te d HM ED V -CMR E DV (mL )
(Adjusted HM EDV + CMR EDV)/2 (mL) 20 30 40 50 60 70 80 90 20 30 40 50 60 70 80 90 Adj us te d HM EF (% ) CMR EF (%) 2 -10 14 -40 -30 -20 -10 0 10 20 30 40 20 40 60 80 Adj us te d HM EF -CMR E F (%) (Adjusted HM EF + CMR EF)/2 (%) r = 0.92 r = 0.87 r = 0.89
Figure 5: Classification of patients according to left ventricular ejection
fraction after manual adjustments of HM, based on clinically relevant
cut-off values
CMR = cardiac magnetic resonance; EF = ejection fraction; HM = HeartModel; HM(40-30) = fully-automated HeartModel with best-settings.
Serment d’Hippocrate
Au moment d’être admise à exercer la médecine, je promets et je jure d’être fidèle aux lois de l’honneur et de la probité.
Mon premier souci sera de rétablir, de préserver ou de promouvoir la santé dans tous ses éléments, physiques et mentaux, individuels et sociaux.
Je respecterai toutes les personnes, leur autonomie et leur volonté, sans aucune discrimination selon leur état ou leurs convictions. J’interviendrai pour les protéger si elles sont affaiblies,
vulnérables ou menacées dans leur intégrité ou leur dignité. Même sous la contrainte, je ne ferai pas usage de mes connaissances contre les lois de l’humanité.
J’informerai les patients des décisions envisagées, de leurs raisons et de leurs conséquences. Je ne tromperai jamais leur confiance et n’exploiterai pas le pouvoir hérité des circonstances
pour forcer les consciences.
Je donnerai mes soins à l’indigent et à quiconque me les demandera. Je ne me laisserai pas influencer par la soif du gain ou la recherche de la gloire.
Admise dans l’intimité des personnes, je tairai les secrets qui me seront confiés. Reçue à l’intérieur des maisons, je respecterai les secrets des foyers et ma conduite ne servira pas à
corrompre les mœurs.
Je ferai tout pour soulager les souffrances. Je ne prolongerai pas abusivement les agonies. Je ne provoquerai jamais la mort délibérément.
Je préserverai l’indépendance nécessaire à l’accomplissement de ma mission. Je n’entreprendrai rien qui dépasse mes compétences. Je les entretiendrai et les perfectionnerai
pour assurer au mieux les services qui me seront demandés.
J’apporterai mon aide à mes confrères ainsi qu’à leurs familles dans l’adversité. Que les hommes et mes confrères m’accordent leur estime si je suis fidèle à mes promesses ;
Evaluation des volumes et de la fonction ventriculaires gauches avec un algorithme automatisé en échographie tridimensionnelle : comparaison avec l’IRM cardiaque et implications cliniques.
Contexte - L’échographie tridimensionnelle (3DE) est supérieure à l’échographie bidimensionnelle
(2DE) pour la quantification des volumes et de la fonction ventriculaires gauches (VG) mais peu répandue en pratique quotidienne.
L’objectif de cette étude était d’évaluer les performances d’une méthode 3DE entièrement automatisée de quantification du ventricule gauche et d’évaluer les enjeux cliniques qui en découlent.
Méthode et résultats - 111 patients adressés pour une IRM cardiaque ont également bénéficié d’une
échographie (EPIQ 7C, Philips) dans la même heure avec quantification du VG par plusieurs méthodes : 2DE du Simpson biplan, 3DE automatisée HeartModel (HM) avec et sans ajustements manuels et avec différents réglages de contours, et IRM.
Sur les 104 patients avec une fenêtre ultrasonore adéquate, le volume télédiastolique (VTD), le volume télésystolique (VTS) et la fraction d’éjection (FE) du VG mesuré par HM totalement automatisé avaient une bonne corrélation (r 0.64-0.76) et de vastes limites d’agrément comparés aux résultats de l’IRM. Ces comparaisons devenaient excellentes après ajustements manuels (biais VTD = -2mL, r = 0.87 / biais VTS = -7mL, r = 0.92 / biais FE = 2%, r = 0.89). En établissant une classification des patients par groupe de FE (FE ≥ 50 % / 35-50 % / ≤ 35 %), obtenue en utilisant HM entièrement automatisé avec les meilleurs réglages de contour, 39 patients étaient mal classés par rapport aux résultats de l’IRM, contre seulement 14 patients mal classés après ajustements manuels. Les reproductibilités intra- et inter-observateur étaient bonnes. HM semblait plus fiable pour les VG normaux.
Conclusion - L’évaluation du VG en utilisant HM avait d’excellentes corrélations et agrément
comparé au gold standard par IRM après ajustements manuels, qui amélioraient significativement la classification des patients avec des conséquences cliniques évidentes.
Left ventricular quantification with three-dimensional transthoracic echocardiography using an automated algorithm: comparison with cardiac magnetic resonance and clinical implications.
Aims - Three-dimensional echocardiography (3DE) is recommended for assessing left ventricular
(LV) quantification but underused in clinical practice. We sought to evaluate the accuracy of an automated 3DE method for LV assessment and the implications for clinical management, as compared to cardiac magnetic resonance (CMR).
Methods and results - 111 patients referred for CMR evaluation underwent echocardiography (EPIQ
7C, Philips) within the same hour. LV volumes and ejection fraction (EF) were obtained using various
methods: 2DE biplane Simpson’s, automated 3DE software (HeartModel (HM)) with and without manual adjustments and with different automatic border settings, and CMR.
Among 104 patients with an adequate acoustic window, using fully-automated HM LV end-diastolic volume (EDV), end-systolic volume (ESV) and EF had good correlations (r 0.64-0.76) with all borders settings, compared to CMR. CMR correlations and agreement were largely improved and became excellent after manual adjustments (EDV bias = -2 mL, r = 0.87 / ESV bias = -7 mL, r = 0.92 / EF bias = 2 %, r = 0.89). Classifying patients according to the EF group (EF ≥ 50 % / 35-50 % / ≤ 35 %), 39 patients were misclassified using fully-automated HM with best-settings as compared with CMR, and classification was significantly improved after manual adjustments (14 patients misclassified). Intra- and inter-observer variability were low. HM seemed more accurate for patients with normal LV.
Conclusion - Compared to CMR, LV assessment using HM had excellent correlations and agreement
after manual adjustments, which significantly improved classification of patients and this has obvious clinical consequences.