Science Arts & Métiers (SAM)
is an open access repository that collects the work of Arts et Métiers Institute of
Technology researchers and makes it freely available over the web where possible.
This is an author-deposited version published in: https://sam.ensam.eu
Handle ID: .http://hdl.handle.net/10985/19178
To cite this version :
Zaid BOUSSATTINE, Nicolas RANC, Thierry PALIN-LUC - About the heat sources generated
during fatigue crack growth: What consequences on the stress intensity factor? - Theoretical and
Applied Fracture Mechanics - Vol. 109, p.1-13 - 2020
Any correspondence concerning this service should be sent to the repository
Administrator : [email protected]
About the heat sources generated during fatigue crack growth: What
consequences on the stress intensity factor?
Zaid Boussattine
a, Nicolas Ranc
a,⁎, Thierry Palin-Luc
baLaboratoire PIMM, Arts et Metiers Institute of Technology, CNRS, CNAM, HESAM Université, 151 boulevard de l’Hôpital, 75013 Paris, France
bArts et Metiers Institute of Technology, University of Bordeaux, CNRS, Bordeaux INP, INRAE, I2M Bordeaux, Esplanade des Arts et Métiers, 33400 Talence, France
A R T I C L E I N F O
Keywords: Stress intensity factor Crack tip cyclic plasticity Thermoelastic coupling Intrinsic dissipation Microplasticity
A B S T R A C T
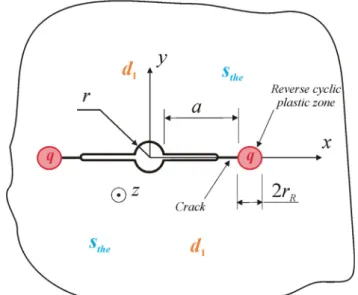
During cyclic loading of a cracked metallic alloy at room temperature, heat sources are generated and produce a heterogeneous temperaturefield around the crack tip. Those heat sources are: (i) the thermo-elastic coupling source, (ii) the intrinsic dissipation due to microplasticity in the material, and (iii) the cyclic plasticity dissipated into heat in the reverse cyclic plastic zone (RCPZ) ahead of the crack tip. The thermoelastic source is computed byfinite element analysis in agreement with classic linear thermoelasticity theory. The intrinsic dissipation due to microplasticity is experimentally estimated by carrying out self-heating fatigue tests on uncracked specimens, and then approximating its values in the cracked specimens by using self-heating curves. The cyclic plastic strain energy dissipated into heat in the RCPZ is also experimentally quantified by carrying out fatigue crack growth tests and using infrared measurements. The temperaturefields, generated by the three types of heat sources, are separately computed by using the linearity of the heat diffusion equation. Afterward, the stress fields, associated with each thermal effect and induced by the material thermal expansion, are computed by considering the hypothesis of the linear elastic fracture mechanics (LEFM). Thus, the mode I stress intensity factor is calculated by taking into account the thermal effect associated with each heat source. The consequences on K, ΔK and
=
RK Kmin/Kmaxare discussed. It is shown that the heat sources do not modify significantly KΔ , but the
mod-ification of RKcan be significant since the effects are proportional to the loading frequency.
1. Introduction
In recent decades, the development of fatigue machines has led to an increase in the loading frequency in order to characterize the fatigue behavior of materials more quickly. These frequencies can nowadays reach 1000 Hz for hydraulic fatigue testing machines and several tens of kilohertz for ultrasonic ones. Moreover, it is rather common tofind structures (turbine blade in a turbojet engine, turbopump in a rocket engine…) which are loaded at very high frequencies. The increase in the frequency generates self-heating of the loaded material which can be significant and can influence the fatigue behavior of the material and in particular the crack propagation.
The stress intensity factor (SIF) plays a major role in studying crack propagation. It was developed in the mid-1950s by Irwin[13]. Based on Westergaard’s plane problem solution for the stress field surrounding the tip of afinite crack in an infinite medium[35], Irwin defined the
SIF, denoted by K, as a mechanical parameter characterizing the state of the stressfield at the crack tip. Several methods have been developed to
calculate the SIF for various geometries of specimens, such as asymp-totic approximations [17,12,32], weight functions [6,30], Green’s functions[23,3], J-integral method[29,8], andfinite element methods
[16,31]. However, one basic assumption to calculate the SIF needs to be held, it is the small scale yielding assumption [23,14,28]. Indeed, a plastic zone develops at the tip of the crack during crack loading, and as the applied load increases, the size of this plastic zone increases too until the crack grows and the elastically loaded material behind the crack tip unloads. When this plastic zone at the crack tip is very small compared with both the region where the material remains elastic and the crack length, the situation is called small scale yielding. Rice showed [27]that unloading a crack after a loading phase creates a reversedflow plastic zone at the crack tip which is included in the plastic zone created after the first loading phase. Consequently, the plastic loading and unloading cycle at the crack tip leads to a reverse cyclic plastic zone (RCPZ) where the cyclic plasticity is mostly con-verted into heat[11,33]. Stüwe and Pippan showed in[24]that the plastic work dissipated into heat in the RCPZ verifies a fourth power
⁎Corresponding author.
E-mail address:[email protected](N. Ranc). URL:https://pimm.artsetmetiers.fr/user/57(N. Ranc).
law with the applied SIF range, KΔ . However, their study did not cover the consequences of the dissipated cyclic plastic work at the crack tip, on the SIF, K.
The classical fatigue crack growth tests carried out at room tem-perature have always been considered as isothermal, which means that there is no temperature change in the material during the tests. The SIF is then calculated in a classical way under the assumption of small scale yielding, with no thermal effects taken into consideration. But, by cy-cling a cracked specimen, the heat produced in the RCPZ creates a heterogeneous temperature field around the crack tip as shown in
[2,15,25,26,22]. Therefore, the assumption of isothermal fatigue crack growth tests is called into question. Furthermore, the heterogeneous temperature field created at the crack tip leads to a heterogeneous stressfield due to thermal expansion of the material. As a result, the global stressfield over the crack is modified, which consequently im-pacts the SIF, K. This impact was first studied in[25]by using an analytic development of a theoretical problem involving thermo-mechanical stresses in an infinite plate with a semi-infinite through crack. Theyfirst established an analytic relationship between the SIF and the heat source due to cyclic plasticity dissipated into heat in the RCPZ. Then, they concluded that the cyclic plastic dissipation at the crack tip modifies the SIF as well as the ratioRK=Kmin/Kmax, and does
not modify the SIF range,ΔK. Later on, the effect of the cyclic plastic dissipation on K in the case of a long propagating fatigue crack in a finite center-cracked specimen is studied in [26]. They carried out
infrared measurements of the temperaturefield created at the crack tip during cyclic loading, and proposed an approach to quantify the cyclic plasticity dissipated into heat in the RCPZ. Then, they found that the resulting effect decreases the value of the SIF K. However, the impact on K related to other possible thermal effects which are produced during fatigue crack growth tests was not studied.
This paper comes to show that besides the cyclic plasticity dis-sipated into heat in the RCPZ, denoted later by q, two other heat sources are produced during fatigue crack growth: (i) the thermoelastic source, denoted bysthe, which is related to the material thermoelastic behavior
induced by the dependence between the stress tensor, the strain tensor, and the temperature ([10,34]). Itfluctuates over time and is propor-tional to the hydrostatic part of the stress tensor response of the ma-terial. Its associated energy vanishes at the end of each complete load cycle; and (ii) the intrinsic dissipation due to microplasticity, denoted byd1,
which results from the self-heating phenomena induced by the dis-sipation into heat of the cyclic plasticity, at the grain scale, occurring in the material outside the RCPZ. It is an intrinsic property of the material behavior and depends on the local stress amplitude, the applied loading frequency and the applied loading ratio,[20,9].
The aim of this study is to verify if the heat sources in question have consequences on the SIF, K t( ), the SIF range,ΔK=Kmax−Kmin, and
the stress intensity ratio,RK =Kmin/Kmax, in the case of a long mode I
propagating fatigue crack. In total, three heat sources are considered in this paper,sthe,d1, and q.stheis a volume power,d1is a volume power
Nomenclature
A Material elongation after fracture CCT Center cracked tensile
E Young’s modulus FEA Finite element analysis
KI Mode I stress intensity factor
KImax Maximum stress intensity factor in mode I over one cycle
KImin Minimum stress intensity factor in mode I over one cycle
KIcorr Corrected stress intensity factor
KIcorr d, Stress intensity factor corrected after taking into account
the effect ofd1
KIm Mean value of the mode I stress intensity factor over one
cycle
KIcorr q, Stress intensity factor corrected after taking into account
the effect of q
KIcorr the, Thermo-elastic component of the corrected stress intensity
factor
KIth Thermal correction of the stress intensity factor
KId
th Thermal correction ofKIassociated withd1
KIqth Thermal correction ofKIassociated with q
KIthe
th Thermal correction ofKIassociated withsthe
LEFM Linear elastic fracture mechanics N Number of cycles
RCPZ Reverse cyclic plastic zone
RK Stress intensity ratio, Kmin/Kmax Rm Ultimate tensile strength Rσ Load ratio,σ∞min/σ∞max
SIF Stress intensity factor T Temperature
W L e, , Half-width, half-length and thickness of the CCT specimen respectively
a Half-length of the crack
a ai, f Initial and final half-lengths of the crack during one
loading block respectively c Specific heat capacity
d1 Intrinsic dissipation
f Loading frequency
h Convective heat transfer coefficient j The imaginary unit defined by j2= −1
k Thermal conductivity coefficient
q Heat source due to cyclic plasticity dissipated as heat in the RCPZ
rR Radius of the RCPZ
sthe Thermoelastic coupling source
sthe a, Amplitude of the thermoelastic coupling source
t Time
K
Δ I Mode I stress intensity factor range K
Δ If ΔKI at the end of one loading block
K
Δ Ii ΔKI at the beginning of one loading block
K
Δ Icorr the, Corrected SIF range due to the thermoelastic coupling ∞
σ
Δ Farfield stress range
α Thermal expansion coefficient
φ Phase ofθthe( )t
ν Poisson’s ratio ρ Material density σthea Amplitude of σyythe( )t
σy Yield strength under monotonic quasi-static tension σycyc Yield strength under cyclic loading
σyyd Normal stress along y axis associated withd1
σyyq Normal stress along y axis associated with q
σyythe Normal stress along y axis associated withs the σ¯¯ Stress tensor
σ¯¯a Amplitude of the stress tensor
∞
σ Farfield stress
∞
σm Farfield mean stress
∞
σmax Farfield maximum stress
∞
σmin Farfield minimum stress
θ Temperature variation with reference to the initial homogeneous temperature
θd Temperature variation due tod1
θq Temperature variation due to q
θthe Temperature variation due tosthe
θthea Amplitude ofθ ( )t the
averaged over one load cycle, and q is a power per unit length of the crack front averaged over one load cycle. It must be noted that the two dissipative sources,d1and q, both originate from cyclic plasticity, but at
different scales: q is defined at the macro-scale, whiled1is defined at the
micro-scale (or grain scale). Moreover, q andd1are positive and
in-crease after every loading cycle to reach constant values after a few cycles over the duration of the applied load block (about ten cycles over 25000 at loading frequencies around 100 Hz). In this study for sake of simplicity, bothd1and q are assumed to be time-independent during
one applied load block.
A specific methodology has been proposed in this work. It is first described. Secondly, the quantification of the three heat sources, which are the key inputs of this study, is presented. Finally, the consequences of the three types of thermal effects, on K tI( ), ΔKI, and RK, are
dis-cussed.
2. Methodology and assumptions
During classic fatigue crack growth tests at room temperature, the mode I fatigue crack propagation is governed by K tI( ), ΔKI, andRK. Let,
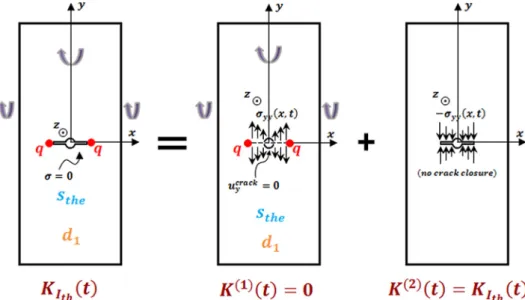
KIth( )t, be the thermal correction of the SIF, generated by the thermal effects introduced before. The main problem, where the mechanical and thermal effects are coupled, can be decomposed into two problems according to the LEFM hypothesis and by assuming no crack closure effect for sake of simplicity.Fig. 1illustrates this decomposition with a two-dimensional center-cracked tensile (CCT) specimen.
The first problem (i) of the decomposition is purely mechanical. Under the applied sinusoidal loading, σ∞( )t, with the loading ratio
= ∞ ∞
Rσ σmin/σmax, the associated SIF, K tI( ), can be written as:
= + K t( ) ΔK πft K 2 sin(2 ) , I I Im (1) ⎜ ⎟ = ⎛ ⎝ + − ⎞ ⎠ K K R R Δ 2 1 1 , Im I σ σ (2)
where f is the loading frequency, t is time, KImis the mode I mean value
of the SIF. And the stress intensity ratio can be expressed as: =
RK Rσ. (3)
The mode I SIF is calculated with the following relation proposed by
[32] ⎜ ⎟ = ⎛ ⎝ − + ⎞⎠ ⎛ ⎝ + ⎛ ⎝ − + ⎞⎠ ⎞ ⎠ ∞ K t σ t πa a a r a a r ( ) ( ) 2 3 1 1.243 1 , I 3 (4) with a the half-length of the crack and r the radius of the central hole (Fig. 2).
Fig. 1. Decomposition of the main problem in two problems (i) and (ii), according to the LEFM hypothesis.
Fig. 2. A schematic fatigue crack model showing the position of the x y, co-ordinates used in Eq.(5).
The second problem (ii) is a thermo-mechanical problem. It is re-lated to the thermal effects due to the heat sourcessthe,d1, and q. First,
the three heat sources are quantified. Afterward, the linearity of the heat diffusion problem enables to separately compute the temperature variation fields,θthe,θd, and θq (with respect to a reference
homo-geneous temperature field, T0) respectively generated by the heat
sources sthe,d1, and q. One can note that this is possible since the
temperature variations are small compared to the reference tempera-ture. Indeed, the material temperature variation during cyclic loading is,θ=θthe+θd+θq. Then, within the LEFM, each temperature
varia-tion field contributes to the thermal expansion of the material and consequently creates an associated stressfield. Therefore, each thermal stressfield induces a thermal correction on the SIF computed by using the Green’s function technique[7]. This is defined by Eq.(5).
∫
= − − + K t a π σ x t a x r x ( ) 2 ( , 0, ) ( ) d , I r a r yy 2 2 th (5) where the integrand is defined for the range, ∈x [ ,r a+r], and a and r are respectively the half-crack length and the radius of the central hole as illustrated inFig. 2. For simplification, the RCPZ is modeled by a disclocated ahead of the crack tip (Fig. 2) whose radius,rR, is estimated
under the plane stress hypothesis by Eq.(6),[28].
⎜ ⎟ = ⎛ ⎝ ⎞ ⎠ r π K σ 1 8 Δ . R I ycyc 2 (6) In Eq.(5), σyy( , 0, )x t is defined as the normal stress field toward y axis generated by thermal expansion such that the condition of un-cracked body is applied. That is why, the thermomechanical problem (ii) on the right inFig. 1is decomposed, within the LEFM and the as-sumption of no crack closure effect, into two sub-problems satisfying the superposition principle (Fig. 3). For simplifying the notation, σyy( , 0, )x t is denoted by σyy( , )x t in the following.
Thefirst sub-problem ofFig. 3is the uncracked CCT specimen where the thermomechanical stressfield associated with each heat source is computed. This sub-problem is solved such that only the elastic domain is considered and the boundary condition over the RCPZ contour is that the radial stress is null as proposed in[25,26]. Indeed, with alternating plasticity in the RCPZ, the mean stress tends to zero.
All the calculations have been carried out by a home-made Matlab code using finite element analysis (FEA) based on two-dimensional quadratic meshing as the problem deals with singularities. This home-madefinite element code allows to take into account convection losses on the element surface. For each computation, the time and space
discretizations have been chosen to have no significant effect on the results.
3. Material and specimen geometry
CCT specimens are used in this study to carry out fatigue crack growth tests. They are made of C40 steel. This is a medium carbon steel with the physical properties given inTable 1, where E is the Young’s
modulus, ν is the Poisson’s ratio,σyis the yield strength under
quasi-static monotonic tension,σycycis the cyclic yield strength,Rmis the
ul-timate tensile strength, A is the material elongation after fracture, ρ is the material density,αis the thermal expansion coefficient, k is the
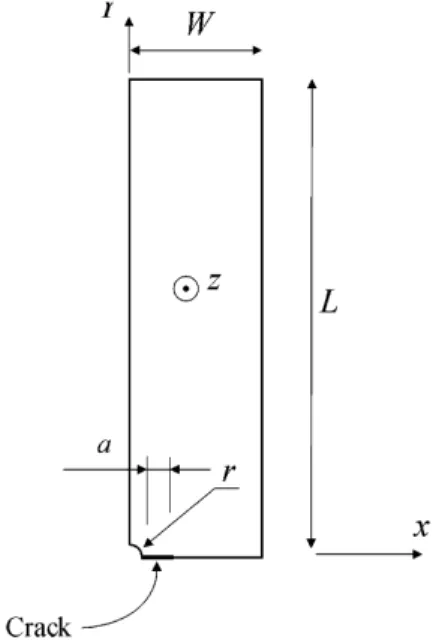
thermal conductivity coefficient, and c is the specific heat capacity. The CCT specimens are designed according to the ASTM Standard E647,[1]. The geometry is illustrated inFig. 4.
It should be mentioned that in the calculations presented in this paper, the material is supposed homogeneous and isotropic with a linear-thermoelastic mechanical behavior.
4. Quantification of the heat sources and computation of the resulting temperaturefields
This step consists in quantifying the heat sources,sthe,d1, and q, as
well as computing their associated temperature variationfields,θthe,θd,
and θq. It should be noted that the thickness of the CCT specimens
(Fig. 4) is very small compared to its length and width. Moreover, during fatigue tests, since the CCT specimens respect ASTM standard requirements, it is reasonable to assume that the load is uniformly applied at its upper and lower boundaries by forces acting parallel to its plane and uniformly distributed through the thickness. Having con-sidered these conditions, the hypothesis of plane stresses is adopted in order to simplify the problem and reduce the calculation time.
Furthermore, due to the symmetries of the CCT specimen geometry, a two-dimensional model of one-fourth of the specimen is considered. The geometry of this quarter model is presented inFig. 5whereaiand
af are the initial half crack length at respectively the beginning and the
end of the sinusoidal load block (the same withΔKIiandΔKIf).
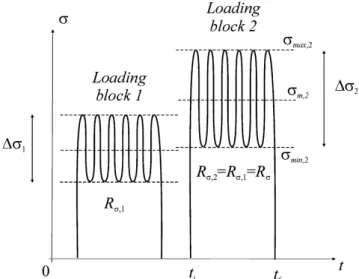
An example of loading configuration is considered all along this paper in order to highlight the quantification of the heat sources as well as their associated temperature variationfields. It corresponds to the conditions of a real loading applied during fatigue crack growth tests which allowed to quantify the heat source, q. These conditions are given inTable 2.
4.1. The thermoelastic source
Since the theory of thermoelasticity is very well established for metallic alloys[10,34], thefield of thermoelastic source,sthe, has been
numerically computed by developing the equations of linear thermo-elasticity. Indeed, by assuming linear thermoelasticity and isotropy of responses in both the deformation and thermal expansion phenomena, as well as small temperature variations,θ=T−T0,[19], the
thermo-elastic source is defined by Eq.(7). = −
sthe αT0Tr( ¯¯̇),σ (7)
whereTr( ¯¯̇)σ is the time derivative of the stress tensor trace associated with the material stress response resulting from the applied mechanical loading. Since the applied loading is sinusoidal, the resulting stress response in the CCT specimen is also sinusoidal and can be expressed as:
= +
σ x y t¯¯ ( , , ) σ x y¯¯ ( , )·sin(2a πft) σ¯¯ ( , )mx y where σ¯¯a is the stress tensor
amplitude and σ¯¯ ( , )mx y is the mean stress tensor. The thermoelastic source can then be explicitly expressed according to Eqs.(8) and (9).
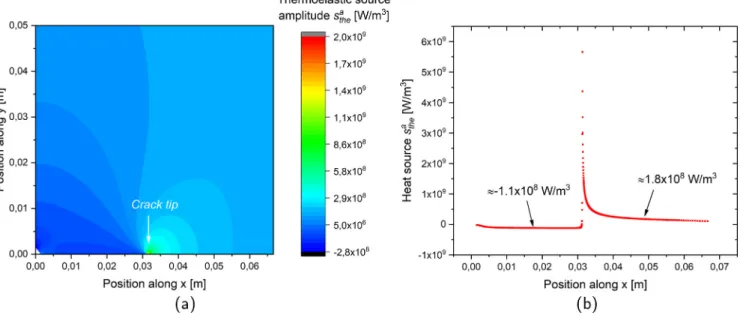
= ⎛ ⎝ − ⎞ ⎠ s ( , , )x y t s ( , )sin 2x y πft π 2 , the thea (8) where = sthea ( , )x y 2πfαT0Tr (σ¯¯ ( , )),ax y (9) is the thermoelastic source amplitude. It should be pointed out that the mean stress tensor is not involved in defining the thermoelastic source because the applied mean stress is time-independent and then dis-appears in the time derivative of the stress tensor trace (Eq.(7)). Thus, according to Eq.(9), after computing the trace of the stressfield am-plitude associated with the applied mechanical loading using a FEA method, thefield of thermoelastic source amplitude is computed. This is depicted inFig. 6where it can be seen that thefield of the thermoelastic source amplitude is singular at the crack tip because the stress response, and then the trace of the stress response, are singular in the same re-gion.
Having computed thefield of the thermoelastic source amplitude, it is now possible to compute the resulting thermoelastic temperature variationfield. For this purpose, a thermal problem needs to be defined. First, it is assumed that the computed two-dimensionalfield of ther-moelastic sources is representative of what happens throughout the CCT specimen thickness since it results from the stress tensor which is calculated under the assumption of plane stresses. In addition, the re-sulting thermoelastic temperature variationfield is also supposed to be homogeneous over the thickness. With these assumptions, the thermal problem enabling to calculate the thermoelastic temperaturefield can be modeled by the following two-dimensional heat diffusion problem:
⎜ ⎟ − ⎛ ⎝ ∂ ∂ + ∂ ∂ ⎞ ⎠ + = ρcθ k θ x θ y h e θ s x y t ̇ 2 ( , , ),
the the the the the
2 2 2 2 (10) = = θthe( , ,x y t 0) 0 (11) ∂ ∂ =± = = ± k θ x hθ (x W y t, , ), the x W the (12) ∂ ∂ =± = = ± k θ y hθ ( ,x y L t, ), the y L the (13) where the term, hθ
e the
2
, results from averaging the temperature over the CCT specimen thickness, e,[9]. This term represents the heat exchange by convection with air which occurs over the upper and lower surfaces of the CCT specimen. The material density, ρ, the specific heat, c, and the thermal conductivity coefficient, k, are material constants. They are
Table 1
Physical properties of C40 steel.
E ν σy σycyc. Rm A ρ α k c
GPa MPa MPa MPa % kg.m−3 K−1 W.K−1.m−1 J.K−1.kg−1
210 0.3 340 200 600 16 7568 1.2×10⁻⁵ 52 460
Fig. 4. Geometry of the CCT specimen (the thickness is 4 mm).
Fig. 5. Geometry of the quarter model of the CCT specimen.
Table 2
Example of loading configuration considered for quantifying the thermal ef-fects.
RK f ai af ΔKIi ΔKIf T0
Hz mm mm MPa. m MPa. m °C
assumed to be independent of the material internal state. Natural convection in air is considered as a thermal boundary condition applied around the CCT specimen with,h=10 W. m . K−2 −1, as the typical value
for natural convection in air.
Since the thermoelasic source is sinusoidal (Eq.(8)), the solution of the heat diffusion Eq.(10)is also sinusoidal. Thus, θthecan be written as
follows:
= +
θthe( , , )x y t θthea ( , )sin(2x y πft φ x y( , )), (14) where θthea is the amplitude of the thermoelastic temperature variation
field, and φ denotes the phase shift between the thermoelastic tem-perature and the mechanical cyclic loading. The computations of the amplitude, θthea, and the phase,φ, are carried out by solving the heat
diffusion Eq.(10)by FEA.
Fig. 7depicts the amplitude of the thermoelastic temperature var-iationfield, θthea, as well as its evolution along x axis. It can be seen that
θthea is singular at the crack tip, which results from the singularity of the
thermoelastic source amplitude (Fig. 6).
Fig. 8plots the phase shift,φ, along x axis. It can be observed thatφ
changes at the crack tip because of important heat losses due to con-duction occurring in the same region. Note that for sake of simplicity convective losses were not modeled between the crack lips.
4.2. The intrinsic dissipation due to microplasticity outside the RCPZ The intrinsic dissipation due to microplasticity outside the RCPZ,d1,
has been experimentally quantified. Classic self-heating fatigue tests were carried out at room temperature with non-cracked smooth speci-mens [21,18]in order to establish the self-heating curve of the C40 steel. This allowed us to estimate the values ofd1at each point
(ele-mentary volume) of the CCT specimen from the self-heating curve. The geometry of the non-cracked smooth specimens is illustrated in
Fig. 9. The self-heating fatigue tests with these specimens were carried out by using a resonant fatigue machine (or Vibrophore) with a load
Fig. 6. Field of the thermoelastic source amplitude, sthea, computed with the loading configuration,af =29.8 mm,f=98.6 Hz, ΔKIf=28.0 MPa. m andT0=20 C°
(a) Zoom near the crack tip region, (b) evolution of sthea along x-axis.
Fig. 7. Amplitude of the thermoelastic temperature variation, θthea, computed with the loading configuration:
= = = =
capacity of 150 kN peak to peak. It has mechanical grips fixing the specimen at its extremities. This is an advantage compared with hy-draulic grips used in servohyhy-draulic testing machines which heat up because of pressurized oil and may generate additional heating in the specimen during cyclic loading. Therefore, by the use of mechanical grips, the specimen heating in the grips is neglected.
During these tests, an infrared camera measured and recorded the temperature evolution on the non-cracked specimen surface. The camera model used in this experimental investigation is FLIR SC7000 MWR. The measuring range of the camera has been chosen between
°
5 C and300 C, and the frequency acquisition and the integration time° are respectively5 Hzand 600 μs. In order to enhance the temperature measurements, the surface of the specimen was covered by a thin layer of mat black paint used as a coating to increase the emissivity of the material surface and avoid reflections from the environment. The in-frared camera image resolution has been configured on320×256pixels (1 mm≈5 px) in order to observe the whole heating central gauge area. For the experimental loading conditions, series of load blocks are applied (Fig. 10). They have been performed under sinusoidal load-control at room temperature around20 C° , at a load ratio,Rσ=0.1, and applied stress amplitudes,20⩽Δσ ⩽140 MPa
2 . The loading frequencies
are in the range [87 Hz;93 Hz]. When the temperature measured on the specimen surface reaches the stabilized regime, the self-heating fatigue test is stopped.
The technique used in this study to determine the intrinsic dis-sipation,d1, with the non-cracked specimens is described in[5]and can
be explicitly expressed by the equation:
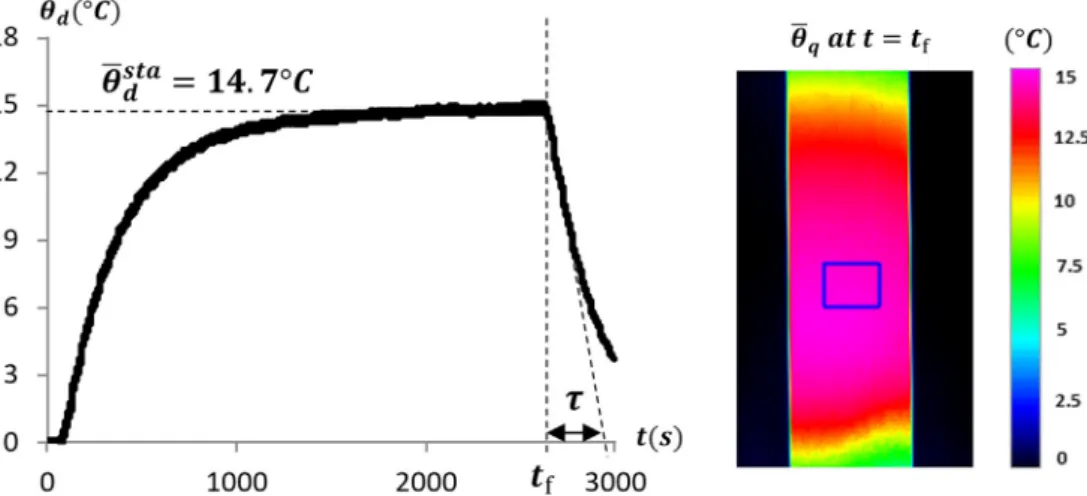
= d ρc τθ¯d , sta 1 (15) whereθ¯d sta
is identified as the mean temperature variation averaged over a small centered area (15 mm×10 mm) on the specimen surface in the stabilized regime of temperature (Fig. 11). τ is a time constant characterizing local heat losses, it is estimated by calculating the slope of the temperature drop after stopping the vibrophore (att=tf in Fig. 11).Fig. 11 shows an example of the evolution ofθdover time
experimentally measured by the infrared camera under the applied stress amplitudeΔσ = 140 MPa
2 , with the loading frequency,f=87 Hz,
and the loading ratio, Rσ=0.1. For this example, τ=285 s and
= °
θ¯d 14.7 C
sta
. Therefore, according to Eq.(15),d1is estimated to be
equal to179.56 kW. m−3 with an uncertainty of0.85 kW. m−3 mainly
due to the thermal noise of the infrared camera (≈0.07 C° ).
With the same method, the intrinsic dissipation, d1, has been
quantified for the different applied stress amplitudes. This enabled to plot the self-heating curve of C40 steel presented in Fig. 12, at
=
f 100 Hz andRσ=0.1. It should be noted that the values ofd1are
determined at the same loading frequency,f=100 Hz, by using a linear dependence between the intrinsic dissipation and the loading frequency
[4]. This actually has been done to plot the self-heating curve at the same loading frequency because the real loading frequency is not ex-actly the same at each applied stress amplitude during self-heating fa-tigue tests.
Now, in order to estimate the intrinsic dissipation due to micro-plasticity outside the RCPZ in the CCT specimen:first, the amplitude of
Fig. 8. Evolution of the phase shift φ along x axis.
Fig. 9. Geometry of the non-cracked smooth specimens made of C40 steel and used for the self-heating fatigue tests.
Fig. 10. Schematic illustration of the loading in blocks with constant loading ratio, Rσ.
the Von Mises equivalent stress, σeq( , )x y = 32σ σ x y¯¯ : ¯¯ ( , )d d , where
σ x y¯¯ ( , )d is the deviatoric part of the stress tensor, is computed by FEA in
the quarter model of the CCT specimen subjected to a given normal stress amplitude. Indeed, when the CCT specimen is subjected to a normal stress amplitude, the stress response in the material is hetero-geneous and multi-axial near the crack tip. Moreover, the intrinsic dissipation,d1, is due to microplasticity outside the RCPZ. Thus, it is
assumed thatd1is linked to the Von Mises equivalent stress as usual
plasticity criterion. Therefore, at each point outside the RCPZ in the CCT specimen, computing the value of σeqallows to estimate the value
of the associatedd1 by referring to the stress axis of the self-heating
curve. This is done by assuming that outside the RCPZ, the load ratio is uniform and equal to the applied one (Rσ=0.1).
Furthermore, it should be known that close to the RCPZ, the am-plitude of the Von Mises equivalent stress is close to the cyclic yield stress (σycyc=200 MPafor C40 steel), and then greater than the limit of the stress amplitude plotted in the self-heating curve (Δσ = 140 MPa
2 in
Fig. 12). Thus, the self-heating curve can be extrapolated by power law regression (d =C(Δ /2)σ n
1 , with C=2.51E−4 W. m . MPa−3 −n and
=
n 4.14) to approximate the values ofd1 for σeq⩽200 MPa. Fig. 12
depicts this extrapolation which remains rough and can be used as a first approximation providing an order of magnitude of the intrinsic
dissipation, d1, due to microplasticity close to the RCPZ. Inside the
RCPZ, the intrinsic dissipation due to microplasticity is supposed to be null.
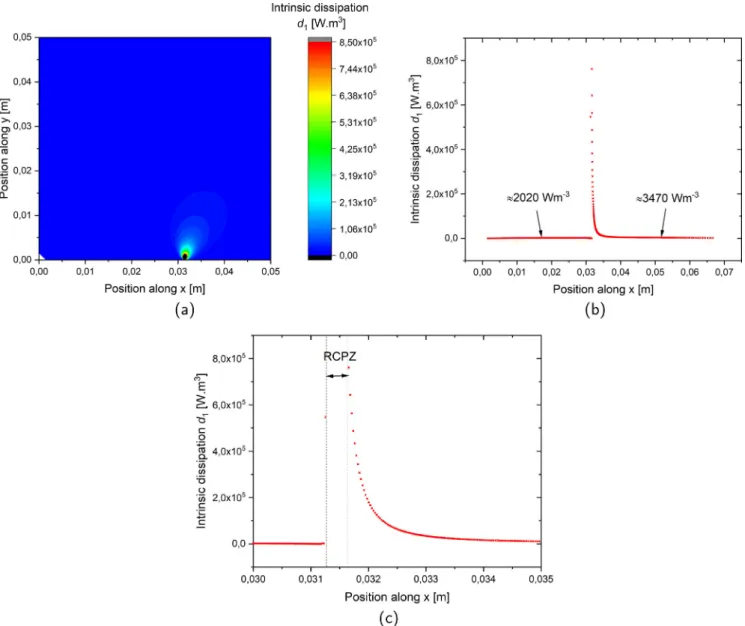
Fig. 13shows the field of the intrinsic dissipation due to micro-plasticity outside the RCPZ. The resulting temperature variationfield,
θd, is computed by solving the associated heat-diffusion equation (Eq. (16)) in transient regime with the same assumptions and boundary conditions used to define the thermal problem of the thermoelastic source (Eq.(10)). ⎜ ⎟ ∂ ∂ − ⎛ ⎝ ∂ ∂ + ∂ ∂ ⎞ ⎠ + = ρc θ t k θ x θ y h eθ d x y 2 ( , ). d d d d 2 2 2 2 1 (16)
Fig. 14depicts the temperature variationfield,θd, computed at the
end of the loading configuration example considered before (Table 2), that is =t 258.4 s. In the following, this temperaturefield, outside the RCPZ, is used to compute the stressfield, due to the part of thermal expansion resulting from the heat sourced1, which enables to calculate
the associated thermal correction of the SIF.
4.3. The cyclic plasticity dissipated into heat in the RCPZ
The approach used in this work to estimate the cyclic plastic
Fig. 11. Example of C40 steel self-heating measurement under the loading conditionsΔ2σ=140 MPa,f=87 HzandRσ=0.1.
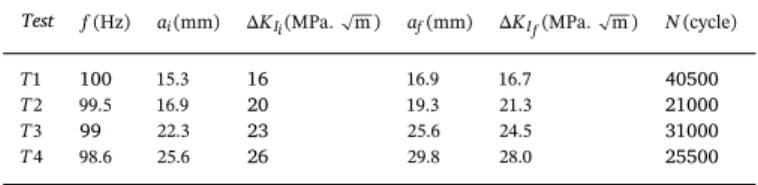
dissipation in heat, q, is described in [26]. The fatigue crack growth tests, with the loading conditions presented in Table 3, have been carried out at room temperature (around20 C° ) by using the experi-mental devices consisting of the vibrophore as well as the IR camera presented in the previous section.
It should be mentioned that, inTable 3, the testT4corresponds to the applied loading block considered before for highlighting the quantification of the heat sources,sthe, andd1. Moreover, for
simplifi-cation, it is assumed that the applied SIF range is constant and equal to thefinal applied one,ΔKIf, for each applied loading block. It should be
mentioned that the applied load blockT4is the limit, in terms of ap-plied KΔ I, above which the condition of small scale yielding is violated.
During the tests, a high resolution optical camera was used to measure the initial andfinal lengths of the crack,ai and af for each
loading block. The lengths of the two cracks propagating from the central notch are very close (the maximum difference is less than 0.5 mm), thus only the results of one crack side are reported in the following for the estimation of the heat source q.
Based on the linearity of the corresponding heat diffusion problem, the heat source q can be estimated by Eq.(17)by assuming a spot heat source model located at the center of the disc modeling the RCPZ:
= q θ θ q ¯ ¯ , q exp q1 1 (17)
whereq1is the unit heat source (q =1 W. m− 1 1),θ¯q
exp
is the total in-crease, between the beginning and the end of the applied loading block, of the average temperature variation measured by the infrared camera in a small area named Area A (1.6 mm×1.6 mm) outside the RCPZ, as shown inFig. 15.θ¯q1is the total increase of the temperature variation
calculated by FEA forq=q =1 W. m−
1 1in Area A.
Fig. 15shows the infrared measurements under the applied loading blockT4(Table 3). The temperature field map (a) ofFig. 15 corre-sponds to the end of the loading block (t=tf), it shows a heterogeneous
temperature field at the crack tip. The temperature oscillations ap-pearing in the curve (b) ofFig. 15are due to the thermo-elastic effect.
The average temperature variation,θ¯exp, is due to both the cyclic plastic dissipation in heat and the intrinsic dissipation due to microplasticity outside the RCPZ. It is plotted by averaging the oscillating curve over a time series of 20 s. To obtain only the contribution of the cyclic plas-ticity occurring in the RCPZ, the temperature variation due to micro-plasticity in area A, calculated in the previous section (0.32 C on°
Fig. 14) is subtracted. Indeed, the temperature increase measured in area A (Fig. 15a) is assumed to be due only to the heat produced by
Fig. 13. Field of the intrinsic dissipation, d1, on a CCT specimen,af =29.8 mm, underΔKIf=28.0 MPa. m ,RK=0.1, andf=98.6 Hz. (a) Zoom near the crack tip
cyclic plasticity occurring in the RCPZ. For this example, the experi-mental temperature increment in area A isθ¯exp=0.97 C° and thus the contribution of the cyclic plasticity in the RCPZ only isθ¯q =0.65 C°
exp
. A linear heat sourceq=42.2 W. m−1can also be calculated with Eq.(17)
using the temperature increment in area A for a unit heat source
= °
θ¯q1 0.0154 C.
It must be noted that the optical performance of the infrared camera does not allow to correctly measure the temperature close to the RCPZ, that is why the temperature variationfield, θq, generated by the heat
source, q, is numerically computed by solving the associated heat dif-fusion equation in transient regime (Eq.(18)).
⎜ ⎟ ∂ ∂ − ⎛ ⎝ ∂ ∂ + ∂ ∂ ⎞ ⎠ + = ρc θ t k θ x θ y h eθ qδ 2 (0), q q q q 2 2 2 2 (18) with the same thermal boundary conditions as those presented in the thermal problem with the thermoelastic source (Section4.1).
For instance, by considering the loading configuration used in the two previous sections to compute the temperature variationfields, θthe,
and θd, namely: af =29.8 mm, ΔKIf =28.0 MPa. m ,RK=0.1, and
=
f 98.6 Hz, which actually corresponds to the configuration of the applied load block referenced byT4(Table 3), the temperature varia-tionfield, θq, is computed with the associated dissipated power per unit
length of the crack front, q=42.2 W. m−1. Fig. 16 depicts the
dis-tribution of the temperature variationfield, θq, computed at =t 258.4 s
which is the time of the end of cyclic loading.
InFig. 16, the peak of the temperature variation, θq, is reached at
the crack tip region because of the singularity due to the spot heat source q applied at the center of the disc modeling the RCPZ. Modeling the heat source located in the RCPZ as a spot source was validated in
[26].
5. Computing the thermal corrections of the SIF
As explained in the methodology presented in Section2, solving the
Fig. 14. Field of the temperature variation, θd, generated by the intrinsic dissipation, d1, at the end of the loading block,tf=258.4 s, of the fatigue test configuration
T4:af=29.8 mm, ΔKIf=28.0 MPa. m ,RK=0.1, andf=98.6 Hz, (a) Zoom near the crack tip region, and (b) evolution of θdalong x-axis.
Table 3
Experimental conditions of the fatigue crack growth tests atRK=0.1.
Test f(Hz) ai(mm) ΔKIi(MPa. m ) af(mm) ΔKIf(MPa. m ) N(cycle)
T1 100 15.3 16 16.9 16.7 40500
T2 99.5 16.9 20 19.3 21.3 21000
T3 99 22.3 23 25.6 24.5 31000
T4 98.6 25.6 26 29.8 28.0 25500
Fig. 15. (a) Infrared measurement of the temperature variationfield, θqexp, at =t tf under the conditions of the loading block T 4, (b) Evolution over time of θqexpand
θ¯q exp
thermomechanical problem of the uncracked sub-problem (Fig. 3) consists in computing the normal stress fields, σyythe,σyyd, and σyyq,
re-spectively generated by the thermal expansion due to the temperature variation fields,θthe,θd, and θq. These stressfields lead afterward to
compute the associated thermal corrections of the SIF.
It should be mentioned that σyytheis in phase with θtheaccording to the
classic linear thermo-elasticity, and is out of phase with the material stress response due to the mechanical cyclic loading. σyythecan be written
as:
= +
σyythe( , , )x y t σ ( , )sin(2x y πft φ x y( , ))
athe (19)
Fig. 17shows the evolution over the crack axis ofσathe, the amplitude
of the normal stressfield related to the thermo-elastic effect, as well as the evolution of σyyd andσyyq computed at the end of the fatigue crack
growth testT4 (attf=258.4 s) considered as a loading configuration example to highlight the numerical calculations. It can be observed that the three normal stress fields are strongly heterogeneous and com-pressive near the RCPZ.
The SIF thermal correction due to the thermo-elastic source,sthe, is
denoted by KItheth( )t. According to Eq.(5), KItheth( )t can be written as:
∫
= − − + K t a π σ x t a x r x ( ) 2 ( , ) ( ) d , Ithe r a r yythe 2 2 th (20) Since σyythe( , )x t is sinusoidal, Eq.(20)can be rewritten as follows:= + K ( )t ΔK πft ϕ 2 sin(2 ), Ithe Ithe th th (21) such that:
∫
= − − + K a π σ x e a x r x Δ 2 2 ( ). ( ) d Ithe r a r thea jφ x( ) 2 2 th (22) and∫
= ⎛ ⎝ ⎜ − − ⎞ ⎠ ⎟ + ϕ σ x a x r x arg ( )e ( ) d , r a r thea j φ x( ( )) 2 2 (23)Fig. 16. Field of the temperature variation, θq, generated by the heat source, q=42.2 W. m−1, and computed at the end of the loading block T4,
= = = =
tf 258.4 s:af 29.8 mm, ΔKIf 28.0 MPa. m ,RK 0.1, andf=98.6 Hz.
whereΔK
2 Ith the
is the amplitude of KItheth( ),t jthe imaginary unit and ϕ is the phase shift between KItheth( )t and the SIF associated with the mechanical response, K tI( ).
As a consequence, the thermoelastic coupling effect on the SIF can be expressed as follows:
= +
KIcorr the, ( )t K tI( ) KItheth( ),t (24)
= ΔK πft +K + K πft+ϕ 2 sin(2 ) Δ 2 sin(2 ), I Im Itheth (25) where KIcorr the, is the SIF corrected by taking into account the
thermo-elastic coupling effect only. Simplifying this sinusoidal sum leads to write, KIcorr the, , as:
= + + K ( )t ΔK πft ψ K 2 sin(2 ) , Icorr the I corr the Im , , (26) whereΔKIcorr the, is the SIF range corrected by taking into account the
thermoelastic effect, and ψ its phase shift, both explicitly expressed as follows: = + K K K Δ 2 Δ 2 Δ 2 e
Icorr the, I Itheth jϕ
(27) and = ⎛ ⎝ ⎜ + ⎞ ⎠ ⎟ ψ arg ΔK K 2 Δ 2 e . I Itheth jϕ (28) Numerically, at the end of the loading block of the test T4, that gives:
= K
Δ Icorr the, 28.08 MPa. m
f . As a result, in comparison with the applied
SIF range (ΔKIf =28.0 MPa. m), the correction is about 0.29%, and will be considered negligible.
On the other hand, the normal stressfield,σyyd(t=258.4 s), due to the effect of the intrinsic dissipation related to microplasticity outside the RCPZ, enables to calculate the associated thermal correction on the SIF:KIdth(t=258.4 s)= −0.0136 MPa. m. It is negative because of the compressive stressfield due to the part of the thermal expansion in-duced by the heat source,d1. Let us recall that to simplify the analysis,
KId
th is assumed to be time-independent during the duration of the
ap-plied loading block.
In the same context, the normal stressfield,σyyq(t=258.4 s), gener-ated by the thermal expansion due to the cyclic plasticity dissipgener-ated into heat, q, leads to compute the associated thermal correction on the SIF:KIqth(t=258.4 s)= −0.0592 MPa. m, which can also be assumed constant during one applied loading block for simplification.
The effects of the dissipative sources,d1, and q, on the SIF, K tI( ), can
be written as: = + + + KIcorr d q( )t K tI( ) KId KI , q , th th (29) = ΔK πft +K +K +K 2 sin(2 ) . I Im Id I q th th (30)
Thus, according to Eq.(30), since the thermal corrections, KIdth, and
KIqth, are both negative, the heat sourcesd1, and q, contribute to decrease
the value of the mean SIF, KIm(for this loading configuration example,
=
KIm 17.11 MPa. m). However, this decrease is small, particularly
that associated with the heat source,d1. Moreover, the two dissipative
sources do not affect the SIF range.
In terms of correction on theRK-ratio, let χRK be the relative
cor-rection associated with theRK-ratio near the crack tip, such that:
= − ∗ χ R R R , R Kcorr K K , K (31) whereR ∗
Kcorr, is the correctedRK-ratio calculated for each heat source:
– For the thermoelastic source,sthe, and according to Eq.(26):
= =− + + R K K K K . , Kcorr the Icorr the Icorr the K Im K Im , , , Δ 2 Δ 2 min max Icorr the Icorr the , , (32) – For the intrinsic dissipation due to microplasticity,d1, and according
to Eq.(30): = =− + + + + R K K K K K K , Kcorr d Icorr d Icorr d K Im Id K Im Id , , , Δ 2 Δ 2 min max I th I th (33)
– For the heat source, q, and according to Eq.(30):
= = − + + + + R K K K K K K . Kcorr q I corr q Icorr q K Im I q K Im Iq , , , Δ 2 Δ 2 min max I th I th (34)
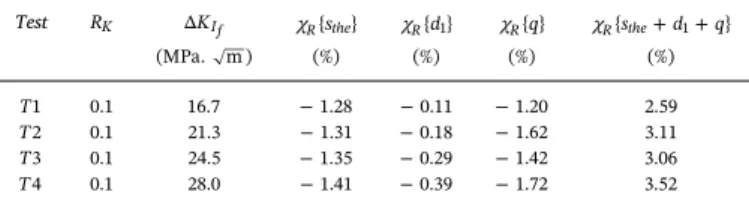
Table 4summarizes the numerical calculation of the relative cor-rections, χR, due to each heat source at the end of the four tests.
As it can be seen inTable 4, the three heat sources tend to decrease the initial value of the RK-ratio. Moreover, the cyclic plasticity
dis-sipated into heat in the RCPZ generates a relatively greater effect onRK
compared to the intrinsic dissipation but similar to the effect due to thermoelasticity.
Now, by considering the total effect of the three heat sources on the SIF, the correctedRK-ratio near the crack tip would be:
= R K K , Kcorr Icorr Icorr min max (35) =− + + + + + + K K K K K K . K Im Id Iq K Im Id Iq Δ 2 Δ 2 Icorr the th th Icorr the th th , , (36)
Table 4presents the numerical results of RKcorr. As a result,
con-sidering the total effect of the three heat sources,sthe,d1, and q,
in-creases the consequences on theRK-ratio representing the local loading
ratio at the crack tip. 6. Conclusion and prospects
In this study, the thermal effects on the SIF generated during mode I cyclic loading of a CCT specimen, made of C40 steel, have been sepa-rately studied according to the LEFM hypothesis. The thermal effects in question are related to the heat sources associated with the thermo-elastic coupling, the intrinsic dissipation due to microplasticity outside the RCPZ, and the cyclic plasticity dissipated into heat in the RCPZ ahead of the crack tip. Each heat source creates a heterogeneous tem-peraturefield at the crack tip which induces a heterogeneous stress field by thermal expansion of the material. As a consequence, the SIF is modified. For C40 steel, under an applied load ratio, Rσ=0.1, at loading frequencies around 100 Hz, and applied SIF ranges,
⩽ K ⩽
16.7 MPa. m Δ I 28.0 MPa. mfulfilling the small scale yielding condition, the consequences on the SIF are small. Despite this result, now it is known that the thermoelastic source modifies the SIF range by
Table 4
Relative corrections on the RK-ratio near the crack tip resulting from the effects
of the three types of heat sources.
Test RK ΔKIf χR{sthe} χR{ }d1 χR{ }q χR{sthe+d1+q}
(MPa. m ) (%) (%) (%) (%)
T1 0.1 16.7 − 1.28 − 0.11 − 1.20 2.59
T2 0.1 21.3 − 1.31 − 0.18 − 1.62 3.11
T3 0.1 24.5 − 1.35 − 0.29 − 1.42 3.06
increasing its initial value, while the intrinsic dissipation due to mi-croplasticity outside the RCPZ, and the cyclic plasticity dissipated into heat in the RCPZ, both do not modify the SIF range, but decrease the mean value of the SIF. Even though the three types of heat sources modify the R-ratio by decreasing its initial value, the effect related to the cyclic plasticity dissipated into heat in the RCPZ is closed to the effect of the thermoelastic coupling and higher than the effect of in-trinsic dissipation in our experimental conditions.
The thermal corrections on the SIF andRK-ratio are relatively low
according to the loading conditions presented in this paper for a loading frequency of about 100Hz. But it has to be reminded that the heat sources depend on the applied load, which means that these thermal effects could generate important consequences on the SIF if the applied loading parameters, particularly the loading frequency, f, and the ap-plied SIF range, KΔ I, were high. As an example, if the loading frequency
increases from 500 Hz or to 1000 Hz the thermal correction will re-spectively reach 15% and 30%. For the ultrasonic tests at a frequency of 20 kHz an extrapolation of the model would give a thermal correction of 600% which will be probably an over estimation of the thermal effect due to the invalidity of model hypothesis. That is why additional work is ongoing to study the effect of the loading frequency, specially at very high frequencies in the range of kilo-Hz used in ultrasonic fatigue tests, where the thermal effects are amplified and consequently could have more impact on the SIF.
Author statement
Category 1. Conception and design of study: Z. Boussattine, N. Ranc, T. Palin-Luc. Acquisition of data: Z. Boussattine, N. Ranc, T. Palin-Luc. Analysis and/or interpretation of data: Z. Boussattine, N. Ranc, T. Palin-Luc.
Catergory 2. Drafting the manuscript: Z. Boussattine, N. Ranc, T. Palin-Luc. Revising the manuscript critically for intellectual content: Z. Boussattine, N. Ranc, T. Palin-Luc.
Category 3. Approval of the version of the manuscript to be pub-lished (the names of all authors must be listed): Z. Boussattine, N. Ranc, T. Palin-Luc.
Declaration of Competing Interest
The authors declare that they have no known competingfinancial interests or personal relationships that could have appeared to influ-ence the work reported in this paper.
References
[1] ASTM-E647, Standard test method for measurement of fatigue crack growth rates, Standard ASTM E647 - 13e1, 2013.
[2] R. Attermo, G. Östberg, Measurements of the temperature rise ahead of a fatigue crack, Int. J. Fract.Mech. 7 (1971).
[3] G.I. Barenblatt, Mathematical theory of equilibrium cracks in brittle fracture, Adv. Appl. Mech. 7 (1962) 55.
[4] B. Berthel, B. Wattrisse, A. Chrysochoos, A. Galtier, Thermographic analysis of fa-tigue dissipation properties of steel sheets, in: International Conference on
Photomechanics, vol. 43, 2007, pp. 273–279.
[5] T. Boulanger, A. Chrysochoos, C. Mabru, A. Galtier, Calorimetric analysis of dis-sipative and thermoelastic effects associated with the fatigue behavior of steels, Int. J. Fatigue 26 (2004) 221–229.
[6] H.F. Bueckner, A novel principle for the coputation of stress intensity factors, ZAMM 50 (1970) 529–545.
[7] D.J. Cartwright, D.P. Rooke, Green’s functions in fracture mechanics, Royal Aircraft Establishment, Technical Report 80035, 1980.
[8] G. Cherepanov, Crack propagation in continuous media: Pmm, 31(3) (1967) 476–488. J. Appl. Mathe. Mech. 31 (1967) 503–512.
[9] A. Chrysochoos, H. Louche, An infrared image processing to analyse the calorific effects accompanying strain localisation, Int. J. Eng. Sci. 38 (2000) 1759–1788. [10] J.M.C. Duhamel, Second mémoire sur les phénomènes thermo-mécaniques, J.
l’Ecole Polytechnique, France, cahier 25 (15) (1837) 1–57.
[11] W. Farren, G. Taylor, The heat developed during plastic extension of metals, Proc. Roy. Soc. A (1925) 422–451.
[12] C.E. Feddersen, Discussion to plane strain crack toughness testing, ASTM, Special Technical Publication, No. 410, 77, 1966.
[13] G.R. Irwin, Analysis of stresses and strains near the end of a crack transversing a plate, J. Appl. Mech. 24 (1957) 361–364.
[14] G.R. Irwin, Plastic zone near a crack tip and fracture toughness, Sagamore Ordnance Mater. Conf. 4 (1960) 63–78.
[15] R. Jones, S. Pitt, An experimental evaluation of crack face energy dissipation, Int. J. Fatigue 28 (2006) 1716–1724.
[16] A.S. Kobayashi, R.D. Cherepy, W.C. Kinsel, A numerical procedure for estimating the stress intensity factors of a crack in afinite plate, J. Basic Eng. 86 (1964) 681. [17] W.T. Koiter, Note on the stress intensity factor for sheet strips with cracks under
tensile loads, Report No. 314, University of Technology, Laboratory of Engineering Mechanics, Delft, Netherlands, 1965.
[18] G. La Rosa, A. Risitano, Thermographic methodology for rapid determination of the fatigue limit of materials and mechanical components, Int. J. Fatigue 22 (2000) 65–73.
[19] J. Lemaitre, J. Chaboche, Mechanics of Solid Materials, Cambridge University Press, 1990.
[20] H. Louche, Analyse par thermographie infrarouge des effets dissipatifs de la loca-lisation dans des aciers, Thèse de Doctorat, Université Montpellier 1, France, 1999. [21] M.P. Luong, Infrared thermographic scanning of fatigue in metals, Nucl. Eng. Des.
158 (1995) 363–376.
[22] G. Meneghetti, M. Ricotta, A heat energy dissipation approach to elastic-plastic fatigue crack propagation, Theoret. Appl. Fract. Mech. 105 (2020) 102405. [23] P.C. Paris, The mechanics of fracture propagation and solutions to fracture arrester
problems, Document D2–2195, The Boeing Company, 1957.
[24] R. Pippan, H.P. Stüwe, Thermische bestimmung der plastischen deformation um die rissfront eines ermüdungsbruches, Zeitschrift für Metalkunde (1983) 699–704. [25] N. Ranc, T. Palin-Luc, P. Paris, Thermal effect of plastic dissipation at the crack tip
on the stress intensity factor under cyclic loading, Eng. Fract. Mech. 78 (2011) 961–972.
[26] N. Ranc, T. Palin-Luc, P. Paris, N. Saintier, About the effect of plastic dissipation in heat at the crack tip on the stress intensity factor under cyclic loading, Int. J. Fatigue 58 (2014) 56–65.
[27] J.R. Rice, Plastic yielding at a crack tip, 1st International Conference on Fracture, Sendai, Japan, 1965, pp. 283–308.
[28] J.R. Rice, Fatigue Crack Propagation. The mechanics of crack tip deformation and extension by fatigue, ASTM Special Technical Publication 415. Philadelphia, 1967. [29] J.R. Rice, A path independent integral and the approximate analysis of strain
concentration by notches and cracks, J. Appl. Mech. 35 (1968) 379–386. [30] J.R. Rice, Some remarks on elastic crack-tip stressfields, Int. J. Solids Struct. 8
(1972) 751–758.
[31] J.L. Swedlow, Surface Crack: Physical Problems and Computational Solutions, ASME, New York, 1972.
[32] H. Tada, P.C. Paris, G.R. Irwin, The Stress Analysis of Cracks Handbook, 1st ed., Del Research Corporation, Hellertown, PA, 1973.
[33] G. Taylor, H. Quinney, The latent energy remaining in a metal after cold working, Proc. Roy. Soc. A (1934) 307–326.
[34] W. Thomson, On the thermoelastic, thermomagnetic and pyro-electric properties of matter, Phil. Mag. 5 (1878) 4–27.