Science Arts & Métiers (SAM)
is an open access repository that collects the work of Arts et Métiers Institute of
Technology researchers and makes it freely available over the web where possible.
This is an author-deposited version published in: https://sam.ensam.eu
Handle ID: .http://hdl.handle.net/10985/15138
To cite this version :
Thibaud MERIEN, Xavier BELLEKENS, David BROSSET, Christophe CLARAMUNT - A Human-Centred model for cyber attacks analysis - In: 2018 2nd Cyber Security in Networking Conference (CSNet), France, 2018-10 - 2018 2nd Cyber Security in Networking Conference (CSNet) - 2018
Any correspondence concerning this service should be sent to the repository Administrator : [email protected]
A human-centred model for cyber attacks
analysis
Thibaud Merien1, Xavier Bellekens2, David Brosset1, and Christophe Claramunt1
1 Naval Academy Research Institute, Chair of Naval Cyber Defence, Lanveoc, France
[email protected],[email protected], [email protected]
2
Division of Cyber Security, Abertay University, Dundee Scotland [email protected]
Abstract. Computer networks are ubiquitous and growing exponen-tially, with a predicted 50 billion devices connected by 2050. This tremen-dous growth dramatically increases the attack surface of both private and public networks. These attacks often influence the behaviour of the sys-tem, leading to the detection of the attack. In this manuscript we model the path of an attack through the network by graphs. The model devel-oped aims to better integer attackers intentions. Using the data produced by 5 honeypots, we apply our model. The preliminary results show that the approach is useful to rapidly detect anomalies in the experiment dataset.
1
Introduction
Computer networks are ubiquitous and play a pivotal role in the way users and machines interact with each other. The advent of the Internet of Things (IoT) has significantly increased the number of devices connected to the Internet, with an estimation of 50 billion devices connected by 2020, hence increasing both the network complexity and attack surfaces on both networks and devices.
In the field of telecommunications, a perfect network is a set of interconnected nodes. On the Internet, however, a system newly connected to the Internet is likely to be contacted by thousands of malicious nodes, mostly bots, from all around the World in less than 24 hours, with the main purpose of probing the newly connected system.
In order to protect networks, it is thus necessary to understand the motiva-tions of the attackers, the methods applied, but most importantly, its identity. This can be achieved through profiling the attacks, hence being able to both understand and learn about the actions of an attacker. This can be achieved by modelling the attack flow path within a network.
Network modelling is complex due to the number of paths network packets can follow. In this paper a model based on graph theory is developed. This model aims at representing network activities and to categorize network users as either the author or the victim of a cyber-attack.
To the best knowledge of the authors the majority of models disregards the users, then this model tends to include the user has a central piece of the model. The main contribution of this paper is the introduction of a new model centred around the user. The model helps refine malicious users and attack characteristics.
Furthermore, numerous graphs derived from the model highlights peculiarities in the network traffic, with the ability to identify patterns that can be used to understand the intentions of a malicious user as well as detect misconfigurations and services failure.
The remainder of this paper is organized as follows. Section 2 presents the state-of-the-art in modelling cyber-attacks and cyber-security visualization. Sec-tion 3 introduces the main model as well as different applicaSec-tions that generate new representations of network communications. Section 4 presents a case study realized on five different honeypots scattered around the world, validating our approach, finally, Section 5 concludes this paper.
2
Related Works
Network activity models have different goals, one of them is to improve under-standing of cyber-attacks as well as increase the detection rate and speed. This method allows improving the cyber-defence and provide better tools to monitor networks and systems [1]. Generally, humans are particularly good at recogniz-ing visual patterns, therefore, transformrecogniz-ing data and numbers into figures (e.g. plots, graphs, etc.) and images can substantially improve cyber-attack detection and understanding through visualization of important information. The domain of security visualization, has recently been expanded into Human Computer In-teraction (HCI) [2–4]. Security visualization can be classified into three types according to [5]: geographic visualizations, abstract topological representations and plot-based representations. Each type is based on different models in order to define the core elements used to produce visual results.
Different approaches and techniques have been used such as graph theory or Petri Nets [6–8] to model networks. Graph theory is one of the favourite models used to represent activities in space and time. Such modelling approach is often used in GIS for example to model urban spaces [9, 10]. However, NetFlow models are one of the most used methods to deal with network information [11, 12]. NetFlow is the aggregation of packets based on information such as the source and destination IP address, IP protocol, source and destination ports as well as the type of service. This method is used to help monitor networks rapidly but it is often not powerful enough to detect anomalies or outliers.
Each model is based on a formal representation in order to use the abstraction level and the operators offered by the theory chosen. When identifying cyber-attacks, attack trees and attack forests are often preferred [13, 14]. In an attack tree the root node represents the final goal of the attacker while the sub-nodes are the steps leading towards the goal. This structure is also used to build cyber-defence trees or countermeasures [15]. Depending on the model chosen, different
patterns can emerge. These patterns can then be used for the attribution of cyber-attacks, find the identity and/or the location of an attacker [16–20] and are generally used for cyber-threat intelligence. Note, however, that the attribution of cyber-attacks is a very challenging problem as numerous tools and software enable hackers to remain anonymous.
To hide their identity, attackers can use Virtual Private Networks (VPN), proxy servers or the TOR network. These techniques were primarily developed to avoid censorship in non-democratic countries and are now primarily used for criminal activities [21]. The principle behind all these methods remains the same: it enables a connection to a server (centralized or decentralized) that hides the true identity of a user. However, if knowing the real identity of the attackers is often impossible, anonymous servers are known (i.e. blacklist) and alerts can be triggered when their use is detected.
Another way to become anonymous on the Internet is to use compromised computers through a botnet. The compromised computers called bots, zombies or ghost computers, are controlled remotely and are used to attack other com-puters or servers. Botnets have the ability to launch large scale attacks such as Distributed Denial of Service (DDoS) against major services providers, where the chance of success of the attack is strongly correlated with the number of computers attacking. Botnet detection is a very dynamic research field, where the objective is to detect abnormal network communications in order to identify whether a computer is compromised or not. Several methods have been designed to detect bots either by analysing network behaviour [22], or through clustering techniques [23]. Criminal activities heavily rely on the anonymity factor to per-petrate infractions. However, anonymity is only one component as highlighted in criminology [24], other factors play an important role when perpetrating crime. Numerous crime prevention frameworks have been proposed in criminology and sociology, focusing on different aspect of the crimes committed, in order to provide an insight on crime trends. These models often consider the offender as the main factor, leaving out important components such as the guardian, or a suitable target, hence for the purpose of this manuscript the use of Routine Activity Theory (RAT) has been privileged [25–27].
RAT assesses the conditions needed from crime to take place in order to explain Direct Contact Predatory Crime (DCPC), by including spatial and tem-poral patterns alongside situational awareness. RAT is described by the three following components.
– Absence of Capable Guardian – Suitable Target
– Motivated Offender
RAT implies that crime occurs due the lack of a capable guardian (i.e. Network Firewall, Access Control Lists, Antivirus, etc.), the presence of a suitable target (i.e. a weak host on a network, a user vulnerable to social engineering attacks, etc.) and the presence of a motivated offender (i.e. a malicious user, a script kiddie, . . . ).
Human actions are at the center of the modelling approach presented. Placing the human in the attack process allows to map the intentions, desires of the user as well as include and analyse all the components provided by the RAT principle.
3
Modelling approach
This section describes the elements of our model and their interconnections. First, we present the main principles of the model, based on graph theory, then we introduce node fusion rules to analyse network activities and understand what is going on during the attack.
3.1 Main Principles
The objective is to model the network activity produced by a complex system composed of many sub-systems. This model can then further be used for the analysis of the activity qualifying normal and abnormal behaviours by identifying intention and desires.
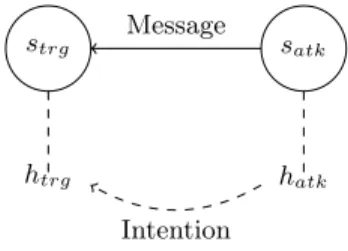
An attacker (hatk) who wants to compromise a target system, (htrg), per-forms an action to reach his objective. According to the theory of action, these actions are related to intentions and desires [28]. Therefore, the attacker and the victim are connected by the attacker intention through their own systems as shown in Figure 1.
strg satk
htrg hatk
Message
Intention
Fig. 1. Network model with intention
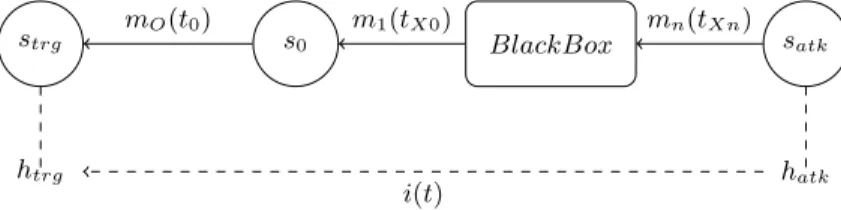
However, numerous systems can co-exist between the attacker and the victim. It is nearly impossible to know the exact path of a message on a network. To this end, a black box is adopted to represent unknown systems used to transmit packets. Figure 2 highlights the different components of a network including the attacker and the victim. Note that, the number of systems included in the black box is unknown.
Let S be the set of systems and M the set of network messages. The path between the victim system (strg) and the attacker system (satk) can be formally defined using graph theory. As shown in Equation 1, Gatk(t) = (S, M ) represents
strg s0 BlackBox satk
htrg hatk
mO(t0) m1(tX0) mn(tXn)
i(t)
Fig. 2. Network Model with humans
the path composed by the systems ∈ S used by the attacker (hatk) to transmit a message ∈ M to the victim htrg at a time t.
Gtrg,atk(t) = strg, m0(t), s0, BB[t0, tn−1], mn(tn), satk (1) Where m(t) ∈ M represent messages between systems, s0 ∈ S the system is directly connected to the victim’s system strg ∈ S. BB, and where the black box, is a set of systems and unknown messages.
A black box can be defined by Equation 2 :
BBtrg,atk(t) = [s1, m1(t), ..., snmn(tn)] (2) For a period of time (t0, tn), Gtrg,atk(t0, tn) represent the graph composed of all the paths between an attacker (∈ A, the set of attackers) and a victim (trg), as shown in Equation 3.
Gtrg,atk(t0, tn) = Y
A
Gtrg,atkA(ti) |t ∈ [t0, tn] (3) For a period of time (t0, tn), the black box is defined by:
BBtrg,atk[t0, tn−1] = [s1, m1(t1), ..., snmn(tn)] (4) As the black box and the system of the attacker are unknown, for the rest of the paper we define Gtrg,atk(t) by Equation 5.
Gtrg,atk(t) = strg, m0(t), satk0 (5) Nodes are defined by the IP address and edges are messages i.e. network packets. Using the IP address of the nodes, we can obtain several information about a system, such as its geolocation. From messages between systems we can extract the original intention of the attacker.
We define the functions ipv4, country(s), city(s), coord(s), s24(s), s16(s) returning, the IP address, the country, the city, the coordinate, the /24 subnet and the /16 subnet of a system s ∈ S respectively. The function blacklisted(s) returns ’true’ if an IP address is included in a known lists of IP addresses that are considered suspicious, and ’false’ otherwise. The function intent(m) returns the intention of the attacker using the content of the message m ∈ M .
The model presented allows for an analysis of network traffic and intentions that can be used for anomaly detection. Furthermore, by applying fusion rules using node information, it is possible to merge nodes and create clusters from nodes and edges information.
3.2 Graph Simplification
The different paths of the aforementioned model are composed of numerous nodes and edges over a period of time. In order to highlight patterns contained in these paths, a simplification process is applied. This process can be seen as flow aggregation similar to C-flow, introduced by [23]. C-flow is a packet aggregator over a period of time. In order to be aggregated, packets must share a protocol (e.g. TCP or UDP), a source IP, a destination IP and port numbers.
In our approach the simplification is built by the aggregation of packets over a period of time, however, our model takes the intention of the attackers into account.The Nodes and edges information can be used to merge system nodes, ultimately, producing new graphs.
The different functions used for the aggregation were defined previously in Section 3, i.e. (ipv4(s), country(s), city(s), coord(s), s24(s), s16(s)). According to Rule 1, nodes must share IP addresses and be connected to the victim by messages carrying the same intention in order to be merged together.
Equation 6 and Equation 7 represent an attack against a single victim, by two attackers. Let atk1= Gtrg,a1(t0, tn) and atk2= Gtrg,a2(t0, tn) be two graphs representing all the paths between a victim (trg) and two attackers (a1 and a2).
Gtrg,a1(t0, tn) = [strg, m a1 0 (t), s a1 0 ] | t ∈ t0, tn (6) Gtrg,a2(t0, tn) = [strg, m a2 0 (t), s a2 0 ] | t ∈ [t0, tn] (7) The similarity between the two systems sa1
0 , s a2
0 is identified by applying the similarity rule defined by Rule 1.
Rule 1 (Nodes Similarity) ∀ti, tj∈ [t0, tn] | tj = ti+ ∆t V sa10 ∈Gtrg,a1(t0,tn),sa20 ∈Gtrg,a2(t0,tn) V ∃ma10 ,ma20 | (strg,ma10 (t),sa10 ),(strg,ma20 (t),sa20 ) ipv4(sa10 ) = ipv4(sa20 ) ∧ intention(ma10 ) = intention(ma20 ) ⇒ Similar(s a1 0 , s a2 0 )
Where ∆t represent the period of time considered building the aggregation of messages.
For example, let’s consider the graph Gx[T ] composed by all messages re-ceived by x from a set of attackers over a period of time T . The simplification process using Rule 1 with ∆t = 10 minutes returns a new graph Gf usion
x [T ]. This graph is composed of all the nodes included in the original graph Gx[T ] sharing the same IP address as well as all the messages with the same intention.
4
Case Study
In order to validate the model presented, a large dataset of network traffic is necessary. The number of publicly available dataset is scarce, due to the lack of metadata, and information related to the generation of the dataset. To this end, and for the purpose of this manuscript we generated a dataset using honeypots. A honeypot is a security tool that can be analysed, probed, attacked and compromised without risk for a network infrastructure [29]. Honeypots are often used to deceive attackers, study attacking methods as well as obtain new and current malware samples [30–32].
Various types of honeypots exist, each dedicated to a specific use. Honeypots can be classified into three categories: low interaction honeypots, medium in-teraction honeypots and high inin-teraction honeypots. Low inin-teraction honeypots have limited interactions between the system and the attackers. The honeypot only emulate services. This type of honeypot presents a low level of risk due to the low interaction. Medium interaction honeypots are between low level interac-tion honeypots and high interacinterac-tion honeypots. While the honeypot is deprived of an operating system, it emulates complex services enabling interaction with malicious users. Finally, high interaction honeypots are the most complex type of honeypots. These run a full operating system including services and a complex configuration. The main advantage of high interaction honeypots is that services are not emulated, hence, attackers are interacting with a real target while the owners can track the attackers by capturing all their interactions.
4.1 Experiment
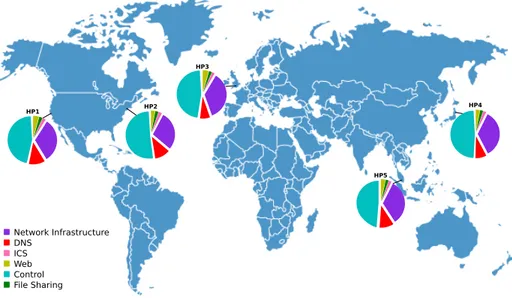
For the purpose of this research a high interaction honeynet was set up, gathering detailed information on a controlled infrastructure. In order to correlate data from multiple sources, 5 virtual private servers were purchased in 5 different locations (Fremont, Newark, London, Tokyo and Singapore). Figure 3 shows the five location across the world.
Each honeypot was deployed with the same configuration. All of them run-ning Ubuntu 16.04 LTS with an SSH server (openSSH), an FTP server (Pure-ftpd) and a web server (Apache2). The web server hosted an authentication page with a PHP script to track login attempts. All network messages captured were stored in a daily PCAP file using the TCPDUMP command. 10 Gb of raw data was generated within a month.
Applying the RAT theory principles, a capable guardian was omitted, i.e. no firewall was configured and the services running on servers are the ones which are often the most targeted by attackers.
4.2 Data analysis
In this section the data gathered over a period of one month by the honeynet is analysed.
HP1 HP2 HP3 HP5 HP4 Network Infrastructure DNS ICS Web Control File Sharing
Fig. 3. Honeypots Places
For this experiment we classified network messages into 7 different inten-tions, divided into 2 main categories: Information gathering and attacks. In the information gathering category, 4 classes are defined, indicating the main char-acteristics of the targeted network: Network infrastructure, DNS (Domain Name Server), ICS (Industrial Control Systems) and Web. The attack category con-cerns the secure remote access attempts and unsecured remote access attempts. Table 1 defines how the protocols have been used to classify intentions. The four intentions defined by the information gathering category are related to the first phase of the cyberkill chain, the reconnaissance phase, while the intentions defined by the attack category, refers to post-reconnaissance. The intention clas-sification is related to the objectives of the analysis and the case study. It is important to note that the intentions used in this work may not be suited to another case study, for example, for a local area network legitimate intentions or pre-approved intentions might be considered.
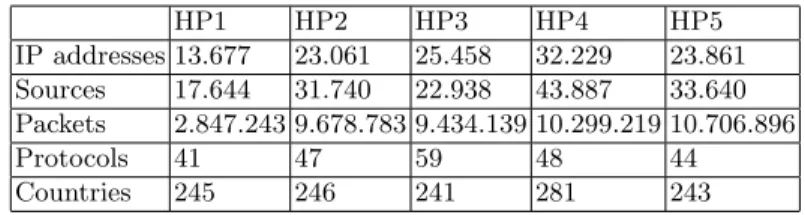
The characteristics of the honeypots and their location in the world are pro-vided in Table 2. The first row represents the number of distinct IP addresses that established a connexion with the honeypots. The second row represents the number of network packets exchanged between the honeypot and the attackers. The third and fourth rows indicate the number of protocols used against each honeypot respectively. The last row of Table 2 indicates the number of countries the attackers operated from, by geolocating IP addresses. Wireshark does not offer the ability to directly assign a geolocation to an IP address using the GeoIP API. This API is based on a free database, GeoLite3.
3
Table 1. Protocol attribution for intention Intention Protocols
Information gathering
Network Infrastructure ICMP ; SIP ; SNMP ; SSDP
DNS DNS ; LLMNR ; MDNS ; NBNS
ICS BACnet ; DNP3.0 ; IPMI ; XDMCP ; XTACACS
Web HTTP
A
ttac
ks Control SSH ; SSHv2
File Sharing FTP ; TFTP
As IP addresses are mostly dynamic, the same IP address doesn’t always belong to the same owner. In the study, we consider that a source is associated with an IP address for 24 hours. At the end of this arbitrary tenure, we consider that the IP address is linked to a new source.
Table 2. Honeypots statistics
HP1 HP2 HP3 HP4 HP5 IP addresses 13.677 23.061 25.458 32.229 23.861 Sources 17.644 31.740 22.938 43.887 33.640 Packets 2.847.243 9.678.783 9.434.139 10.299.219 10.706.896 Protocols 41 47 59 48 44 Countries 245 246 241 281 243
Table 2 shows that the honeypot geolocation has no impact on the cyber attacks they faced. In fact, for all honeypots except HP4, the number of packets and the number sources are similar. This phenomena is true for all protocols.The number of different protocols is almost invariant for all honeypots. After analysis, the most prevalent intention is control.
In Figure 3 the locations of honeypots are specified as well as the proportion of intentions by the attackers. As shown, all honeypots follow the same pattern with a similar proportion of malicious intentions.
Figure 4.2 represents the number of messages sent by the 100 most present sources and received by each honeypot. As previously mentioned, the honeypot
location has no impact on the data gathered. However, we observe that the intentions of HP1 are significantly below the others.The results obtained for HP1 can be explained by the fact that the server stopped working after 10 days. This was discovered by analysing the PCAP files saved on the server.
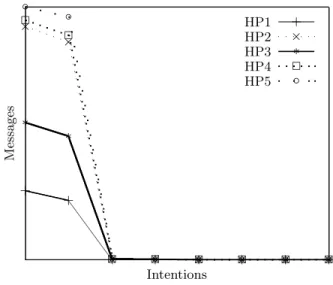
Figure 4.2 represents the number of messages by intention received by each honeypot. As shown, the data obtained for HP3 is also dissimilar to HP2, HP4 and HP5. By analysing the intentions of the attacker using the model presented it was also possible to detect an anomaly in the services of HP3 during the acquisition period. Numerous systems and system administrators are unable to consider all the logs due to tremendous amounts generated, moreover, it takes an average of 206 days to detect a cyber-attack on a system [33]. However, through the model presented, and by considering the attacker’s intention, it is possible to tremendously reduce the detection of an anomaly in both the services, and the network. Messages Sources HP1 + + + + + + + + + + + + + + + + + + + + + HP2 × × × × × ×× × × × × × × × × × × × × × × HP3 ∗ ∗ ∗ ∗ ∗ ∗ ∗ ∗ ∗ ∗ ∗ ∗ ∗ ∗ ∗ ∗ ∗ ∗ ∗ ∗ ∗ HP4 2 2 2 2 2 2 2 2 2 2 2 2 2 2 2 2 2 2 2 2 2 HP5 ◦ ◦ ◦ ◦ ◦ ◦ ◦ ◦ ◦ ◦ ◦ ◦ ◦ ◦ ◦ ◦ ◦ ◦ ◦ ◦ ◦
Fig. 4. Number of messages for the 100 most communicating sources
Rule 1 is to reduce the number of elements analysed in the experiment. To this end, different values for the aggregation over time were used: 1 minute, 10 minutes, 1 hour and 1 day.
Table 3 shows the differences between the original data and the simplified graph. The simplification process produces a graph with 20 times less messages using 1 minute for time aggregation. This result shows that the graph produced by taking into account intentions reduces the amount of data to analyse while using a small period of time for the aggregation.
Messages Intentions HP1 + + + + + + + + + HP2 × × × × × × × × × HP3 ∗ ∗ ∗ ∗ ∗ ∗ ∗ ∗ ∗ HP4 2 2 2 2 2 2 2 2 2 HP5 ◦ ◦ ◦ ◦ ◦ ◦ ◦ ◦ ◦
Fig. 5. Number of messages by intention Table 3. Simplification process
Original data ∆t = 1D ∆t = 1H ∆t = 10M ∆t = 1M # messages 13 990 758 19 869 51 433 114 365 596 669
5
Conclusion
The exponential amount of data being transmitted over the networks and the increasingly large number of connected devices make it difficult to detect abnor-mal behaviour. Current research is oriented to the modelling of network flows and detecting anomalies. However, these models and methods often forget hu-man factors and the intention of the attacker. The model presented in this article aims to improve human integration by profiling the human interaction during and after an attack.
This paper also introduces an experiment validation using a set of honeypots spread around the world collected a large amount of raw network data in order to create a dataset for the validation of the graph model presented.
The results showed that the model allows for quick anomaly detection, such as the unavailable services by analysing the attackers intention. Using current tools, it takes an average of 206 days to detect a network breach. The model presented allows to reduce this dramatically by analysing the intention of the attacker. The model can also help identify misconfigurations and service failures as presented in the case study for Honeypot 3.
A simplification process is applied to the model showing that the data to analyse can be reduced by 20 % without losing in accuracy. Furthermore, we plan to study and design new representations based on the model in order to show
more hidden patterns. Finally, all the data collected will be freely available online to benefit the scientific community. The method will also be tested on additional datasets extracted from industrial networks and Cyber Physical Systems.
References
1. Goodall, J.R.: Introduction to visualization for computer security. In: VizSEC 2007. Springer (2008) 1–17
2. Jiang, B., Ormeling, F.: Mapping cyberspace: Visualizing, analysing and exploring virtual worlds. The Cartographic Journal 37(2) (2000) 117–122
3. Tamassia, R., Palazzi, B., Papamanthou, C.: Graph drawing for security visual-ization. In: International Symposium on Graph Drawing, Springer (2008) 2–13 4. Syamkumar, M., Durairajan, R., Barford, P.: Bigfoot: A geo-based
visualiza-tion methodology for detecting bgp threats. In: Visualizavisualiza-tion for Cyber Security (VizSec), 2016 IEEE Symposium on, IEEE (2016) 1–8
5. Withall, M., Phillips, I., Parish, D.: Network visualisation: a review. IET commu-nications 1(3) (2007) 365–372
6. T¨olle, J., Niggemann, O., et al.: Supporting intrusion detection by graph clustering and graph drawing. In: Proceedings of Third International Workshop on Recent Advances in Intrusion Detection RAID 2000. (2000)
7. Uma, M., Padmavathi, G.: A survey on various cyber attacks and their classifica-tion. IJ Network Security 15(5) (2013) 390–396
8. Jasiul, B., Szpyrka, M., ´Sliwa, J.: Detection and modeling of cyber attacks with petri nets. Entropy 16(12) (2014) 6602–6623
9. Jiang, B., Claramunt, C.: Topological analysis of urban street networks. Environ-ment and Planning B: Planning and design 31(1) (2004) 151–162
10. Jguirim, I., Brosset, D., Claramunt, C.: Functional and structural analysis of an urban space extended from space syntax. In: 8th International Conference on Geographic Information Science, Vienna, Austria. (2014)
11. Lakkaraju, K., Yurcik, W., Lee, A.J.: Nvisionip: netflow visualizations of system state for security situational awareness. In: Proceedings of the 2004 ACM workshop on Visualization and data mining for computer security, ACM (2004) 65–72 12. Yin, X., Yurcik, W., Treaster, M., Li, Y., Lakkaraju, K.: Visflowconnect: netflow
visualizations of link relationships for security situational awareness. In: Proceed-ings of the 2004 ACM workshop on Visualization and data mining for computer security, ACM (2004) 26–34
13. Chen, T.M., Sanchez-Aarnoutse, J.C., Buford, J.: Petri net modeling of cyber-physical attacks on smart grid. IEEE Transactions on Smart Grid 2(4) (2011) 741–749
14. Pi`etre-Cambac´ed`es, L., Bouissou, M.: Beyond attack trees: dynamic security mod-eling with boolean logic driven markov processes (bdmp). In: Dependable Com-puting Conference (EDCC), 2010 European, IEEE (2010) 199–208
15. Roy, A., Kim, D.S., Trivedi, K.S.: Cyber security analysis using attack counter-measure trees. In: Proceedings of the Sixth Annual Workshop on Cyber Security and Information Intelligence Research, ACM (2010) 28
16. Thonnard, O., Mees, W., Dacier, M.: On a multicriteria clustering approach for attack attribution. ACM SIGKDD Explorations Newsletter 12(1) (2010) 11–20 17. Nicholson, A., Watson, T., Norris, P., Duffy, A., Isbell, R.: A taxonomy of technical
attribution techniques for cyber attacks. In: European Conference on Information Warfare and Security, Academic Conferences International Limited (2012) 188
18. Nunes, E., Kulkarni, N., Shakarian, P., Ruef, A., Little, J.: Cyber-deception and attribution in capture-the-flag exercises. In: Proceedings of the 2015 IEEE/ACM International Conference on Advances in Social Networks Analysis and Mining 2015, ACM (2015) 962–965
19. Shamsi, J.A., Zeadally, S., Sheikh, F., Flowers, A.: Attribution in cyberspace: techniques and legal implications. Security and Communication Networks (2016) 20. Cook, A., Nicholson, A., Janicke, H., Maglaras, L., Smith, R.: Attribution of cyber
attacks on industrial control systems. (2016)
21. Leavitt, N.: Anonymization technology takes a high profile. Computer 42(11) (2009)
22. Strayer, W.T., Lapsely, D., Walsh, R., Livadas, C.: Botnet detection based on network behavior. In: Botnet Detection. Springer (2008) 1–24
23. Gu, G., Perdisci, R., Zhang, J., Lee, W., et al.: Botminer: Clustering analysis of network traffic for protocol-and structure-independent botnet detection. In: USENIX security symposium. Volume 5. (2008) 139–154
24. Guitton, C.: Criminals and cyber attacks: The missing link between attribution and deterrence. International Journal of Cyber Criminology 6(2) (2012) 1030 25. Cohen, L.E., Felson, M.: Social change and crime rate trends: A routine activity
approach. American sociological review (1979) 588–608
26. Pratt, T.C., Holtfreter, K., Reisig, M.D.: Routine online activity and internet fraud targeting: Extending the generality of routine activity theory. Journal of Research in Crime and Delinquency 47(3) (2010) 267–296
27. Schreck, C.J.: Routine activity theory. In: Preventing Crime and Violence. Springer (2017) 67–72
28. Allen, J.F.: Towards a general theory of action and time. Artificial intelligence 23(2) (1984) 123–154
29. Spitzner, L.: Honeypots: tracking hackers. Volume 1. Addison-Wesley Reading (2003)
30. Alata, E.: Observation, caract´erisation et mod´elisation de processus d’attaques sur Internet. PhD thesis, INSA de Toulouse (2007)
31. Mokube, I., Adams, M.: Honeypots: concepts, approaches, and challenges. In: Proceedings of the 45th annual southeast regional conference, ACM (2007) 321– 326
32. Dacier, M., Pham, V.H., Thonnard, O.: The wombat attack attribution method: some results. In: International Conference on Information Systems Security, Springer (2009) 19–37
33. Institute, P.: 2017 Cost of Data Breach Study. Technical report, IBM Security (01 2017)