Science Arts & Métiers (SAM)
is an open access repository that collects the work of Arts et Métiers Institute of
Technology researchers and makes it freely available over the web where possible.
This is an author-deposited version published in: https://sam.ensam.eu Handle ID: .http://hdl.handle.net/10985/15462
To cite this version :
Merouan HAMDI, Olivier COUTIER-DELGOSHA, Michael BAUDOIN - Measurements of the temperature variations during the growth and collapse of cavitation bubbles - In: 10th International Symposium on Cavitation (CAV2018), Etats-Unis, 2018-05 - Proceedings of the 10th International Symposium on Cavitation (CAV2018) - 2018
Any correspondence concerning this service should be sent to the repository Administrator : archiveouverte@ensam.eu
Measurements of the temperature variations during the growth and collapse of
cavitation bubbles
Merouan HAMDI1, Olivier COUTIER-DELGOSHA2, 1Michael BAUDOIN3
1
Arts et Metiers ParisTech, Laboratoire de Mécanique des Fluides de Lille, 8 bld Louis XIV, Lille, France
2
Virginia Tech, Kevin T. Crofton dept. of Aerospace and Ocean Engineering, 460 Old Turner St, Blacksburg, VA 24061, USA
3
Université Lille, CNRS, EC Lille, ISEN, Université Valenciennes, UMR 8520IEMN, F-59000 Lille, France
Abstract
The present work focuses on the analysis of the extreme conditions encountered during the process of collapse of cavitation bubbles. The objective is to characterize the temperature variations inside the vapor/gas bubble, and also in the surrounding liquid. This information is especially relevant to address the issues of cavitation erosion and develop appropriate models that take into account the thermal effects in cavitation. The work is based on an experimental approach where temperature measurements are performed with cold wires technique. This technique is characterized by a very small time response, and can be applied to both phases during the growth and collapse of the bubbles.
Keywords: cavitation bubble; temperature measurements; cold wire
1. Introduction
In rotating machinery, cavitation occurs preferentially on the suction side of the blades and at the tip region, because of i) the pressure drop due to the gap between the rotor and the casing for turbomachinery and ducted propulsors and ii) the local high velocities due to the rotation speed. It leads to performance decrease and/or to perturbations due to the development of instabilities. In ships and submarines, cavitation causes undesirable effects such as noise, hull vibration and material erosion. In addition to these effects, erosion due to cavitation is also a major limitation in the lifetime of hydraulic devices and rotating machinery operating in cavitating conditions. Erosion is due to the extreme conditions that occur during the collapse of the vapor bubbles. Very brief intense local heating and high pressure is generated at the location of bubble implosions, because of the fast compression of the bubbles at the end of the implosion process. During a very short time at the end of the implosions, the local heating is more rapid than the thermal exchanges, which generates temperatures probably up to 5000 K in configurations of cloud cavitation [2]. Such conditions may explain why melting spots have been observed on the special coating used in naval environments to protect the surfaces submitted to cavitation [3]. Such results suggest that small scale mechanism of heat transfer during the collapse may play a major role in the damage of the surface.
In case of single bubble configuration, a higher temperature of about 15000°K is expected, because the bubble collapse is spherical, which results in a greater compression of the gas. It has been found that such bubble contracts by more than a factor 100 within the few ms of implosion. Some authors even expect higher core temperature, because plasma formation at such extreme conditions makes an optically opaque area at the center of the bubble, so the estimated temperature may be the one at the limit of this area, not the highest one inside the core. These intense and brief temperature peaks expected in collapsing bubbles have not been confirmed yet, by any direct measurement. More specifically, no quantification of the temperature condition as a function of space location inside the bubbles has been reported. Indeed, specific instrumentation is required to detect with enough precision the high-frequency temperature variations in the flow.
Recent attempts have focused on the temperature measurement in the liquid surrounding the bubbles [1], [4] with measurements based on infrared imaging or fluorescence thermometry. These techniques are currently characterized by a limited acquisition frequency and accuracy, so the modeling of energy release and heat transfers during this process is still an open question, which dramatically hampers the prediction of the effects of cavitation erosion.
The present work focuses on the analysis of the extreme conditions encountered during the process of collapse of cavitation bubbles. The objective is to characterize the temperature variations inside the vapor/gas bubble, and also in the surrounding liquid. This information is especially relevant to address the issues of cavitation erosion and develop appropriate models that take into account the thermal effects in cavitation. The work is based on an
experimental approach where temperature measurements are performed with cold wires. This technique is characterized by a very small time response, and can be applied to both phases during the growth and collapse of the bubbles.
2. Methods
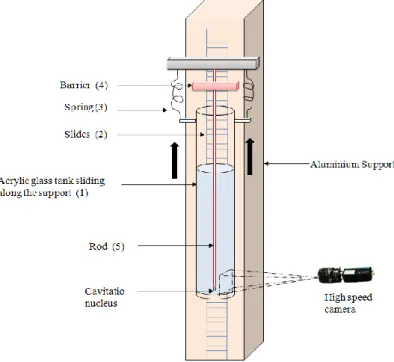
The experimental setup is based on the so-called tube arrest method. It consists of a vertical tube containing liquid which is pulled downwards against (tensioned) supports and released. After the tube’s arrest the liquid continues its upward motion generating a tension pulse. The acrylic (1) glass tube has 5cm diameter and 100cm length, with an open upper end. It is put on slides (2) so it can move freely in the vertical direction. The tube is filled with water up a level varying between 50 and 80cm. Distilled and degassed water was used in order to remove as many cavitation nuclei as possible before the experiments. The tube is fastened indirectly to a spring (3) pinned at one end. For the generation of a cavitation bubble, the tube is pulled downward for some length, the spring thus being stretched. The former is then released, and is quickly pulled upward by the spring, and then suddenly arrested by a barrier (4) after shooting up a short distance (typically a few cm). A thin rod (5) with a diameter of 2 mm was inserted vertically into the water. At the bottom part it had a small dent so that an air bubble nucleus with a diameter of 0.5 mm could be formed in there. The rod was suspended along the centerline of the tube. Due to the sudden arrest, a tension wave is produced in the water column, starting from the tube bottom and traveling upward, which results in the growth of the bubble. When the velocity of the tube before the arrest is in the range 1 – 2 m/s, the resulting bubble has a maximum diameter varying between 10 and 20 mm, depending also on the height of water in the tube. The resulting lifetime of the bubble is of the order of 5 to 10 ms.
For observation of the bubble, one high speed camera (Motion Blitz EoSens mini capturing images from side view is used. It enables capturing at 506 fps at 1Mpixel resolution. For the present experiment, the camera is recording at several thousands fps at a reduced resolution. This setup has enabled to obtain single bubbles of the appropriate size and characteristic lifetime, so it is currently used to test the sensors (cold wires and micro-thermocouples).
Figure 1. Experimental setup for single bubble growth and collapse
2.2. Temperature measurements
The sensor developed for high frequency temperature measurements is a cold wirethermometerwith15µm wire diameter. It is intended to measure the temperature with a very small time response. For that purpose, specific
thin cold wires obtained by Nickel metallic coating, whose resistance varies according to the local temperature, have been developed. A low intensity current (lower than 0.5 mA) is applied to avoid any heating by Joule effect, which means that the wire resistance depends on the local flow temperature only. The use of the cold wire is based on the configuration shown in figure 2: the wire should be located very close to the cavitation nucleus, so that the sensitive part (2 mm) of the sensor will be included inside the bubble shortly after the start of the expansion. Each cold wire is calibrated before being mounted in the experimental setup. A static calibration is performed between 20°C and 100°C.
Figure 2. Temperature measurement with a cold wire - Scheme of the experimental setup
The temperature measurements provided by the cold wire are recorded at 250 KHz and synchronized with the high speed camera, using an accelerometer mounted on the barrier (see figure 1), which detects the exact time of the tube arrest and triggers the start of the acquisitions.
3. Results and discussions
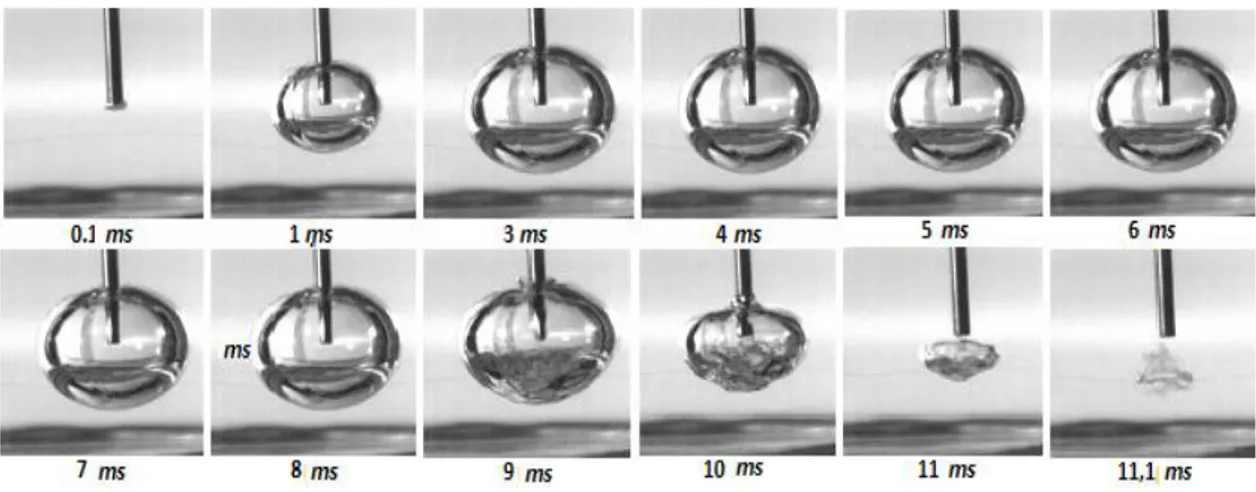
In the tests, the cavitation nucleus is located very close to the wire, so the sensor is located inside the cavitation bubble during most of the grow thand collapse phases (see figure 2). In the case presented here, the nucleus is located 10 mm above the bottom wall, which results in an elliptical bubble. The duration of bubble expansion is about 7ms in this case (images 1 to 6 in figure 4),and it is followed by a compression phase of similar duration (images 7 to 10), and eventually the complete collapse of the bubble (images 11 and 12). The signal of the cold wire is given in figure 5.
Figure 4. High speed visualization of the cavitation bubble
Based on the synchronization between the camera and the sensor, the expansion and compression steps are roughly indicated in figure 5: during this period, the temperature inside the bubble is fluctuating between 20 to 65 °C. The peak observed on the signal is obtained in the final stage of the bubble collapse, as expected.
Figure 5. The temperature signal during bubble lifetime
Based on the calibration data previously performed, the maximum temperature obtained in this test is about 280°C. In most of other tests, the temperature peak magnitude is varying between 300 and 600°C. It strongly depends on the shape, the diameter ant the distance of the bubble to the wall, and even more on the wire position during the bubble collapse. Note that the temperature peak is very brief, about 10 to 30 µs.
4. Conclusion
Temperature measurements have been performed during the growth and collapse of cavitation bubbles, using cold wire sensors. In the particular case presented here, the temperature at the end of the collapse is obtained for a non-spherical bubble, so it is expected that much higher values may be obtained in case of spherical bubbles, at a higher distance from the bottom wall. Future tests will be performed with a better control of the wire location and at various distances to the bottom wall, which will enable a more in-depth analysis.
To have a better evaluation of the time response of the cold wires, several wires with different values of the Nickel coating thickness will be made in the future, and tested with the same bubble position and dynamic. It will be checked if the magnitude of the temperature peak variesas the layer thickness is reduced, or not.
Références
[1] Dular M., Coutier-Delgosha O. (2013), "Thermodynamic effects during Expansion and Collapse of a Single Cavitation Bubble", J. of Fluid Mechanics, 736, pp. 44-66.
[2] Suslick K.S., McNamara III W.B., Didenko Y. (1999), "Hot spot conditions during multibubble cavitation, in Sonochemistry and Sonoluminescence, Crum, L. A.; Mason, T. J.; Reisse, J.; Suslick, K.S., eds., Kluwer Publishers: Dordrecht, Netherlands, 1999, pp. 191-204.
[3] Paik B.G., Kim K.S., Kim K.Y., Ahn J.W., Kim T.G., Kim K.R., Jang Y.H., Lee S.U. (2011), "Test method of cavitation erosion for marine coatings with low hardness", OceanEngineering 38(13), pp. 1495-1502.
[4] Quinto-Su P. A., Suzuki M. & Ohl C-D. (2014), "Fast temperature measurement following single laser-induced cavitation inside a microfluidic gap", Scientific Reports 4, Article number: 5445

![Risiko- & [und] Schutzfaktoren der psychischen Gesundheit humanitärer Einsatzhelfer : eine systematische Literaturübersicht](data:image/gif;base64,R0lGODlhAQABAIAAAP///wAAACH5BAEAAAAALAAAAAABAAEAAAICRAEAOw==)