Evaluation and Calibration of the CroBas-PipeQual
Model for Jack Pine (Pinus banksiana Lamb.) using
Bayesian Melding
Hybridization of a process-based forest growth model with
empirical yield curves
Mémoire
Stephanie Ewen
Maîtrise en sciences forestières
Résumé
CroBas-PipeQual a été élaboré pour étudier les effets de croissance des arbres sur la qualité du bois. Ainsi, il s’agit d’un modèle d’intérêt pour maximiser la valeur des produits extraits des forêts.
Nous avons évalué qualitativement une version de CroBas-PipeQual calibrée pour le pin gris (Pinus banksiana Lamb.) de façon à vérifier l’intérêt de l’utiliser comme outil de planification forestière. Par la suite, nous avons fait une analyse de sensibilité et une calibration bayesienne à partir d’une table de production utilisée au Québec.
Les principales conclusions sont:
1. Les prédictions de hauteur sont les plus sensibles aux intrants et aux paramètres liés à la photosynthèse;
2. La performance de CroBas est améliorée en tenant compte de la relation observée entre deux paramètres utilisés pour estimer la productivité nette et l'indice de qualité de station; et
Abstract
CroBas-PipeQual is a process-based forest growth model designed to study foliage development and how growth processes relate to changes in wood quality. As such, CroBas-PipeQual is of interest as a component model in a forest level decision support model for value assessment.
In this thesis, the version of CroBas-PipeQual calibrated for jack pine (Pinus banksiana Lamb.) in Québec, Canada was qualitatively evaluated for use in forest management decision-making. Then, sensitivity analyses and Bayesian melding were used to create and calibrate a stand-level version of CroBas-PipeQual to local empirical height yield models in a hybrid-modelling approach.
Key findings included:
1. Height predictions were most sensitive to input values and to parameters related to net photosynthesis;
2. Model performance was improved by varying two net-productivity parameters with site quality; and 3. Model performance needs further improvement before CroBas-PipeQual can be used as a component
Table of Contents
Résumé ... iii
Abstract ... v
Table of Contents ... vii
List of Tables ... ix
List of Figures ... xi
Foreword ... xiii
General Introduction ... 1
Article 1. Qualitative assessment of a process-based forest growth model for use in a value-optimization decision support tool ... 5
1.01 Abstract... 5
1.02 Résumé ... 7
1.03 Introduction ... 9
1.04 Methods ... 13
1.04.01 PSP Data ... 13
1.04.02 PipeQual Model for Jack Pine and Model Forecasts ... 14
1.04.03 Analyses ... 14
1.05 Results and Discussion ... 17
1.05.01 Model Implementation ... 17
1.05.02 Stand-level Predictions ... 18
1.05.03 Tree-level Predictions ... 21
1.06 Conclusion ... 27
Article 2. Connecting theory to forest decision support tools: hybridization of a process-based productivity model with empirical height-yield curves ... 29
2.01 Abstract... 29 2.02 Résumé ... 31 2.03 Introduction ... 33 2.04 Methods ... 37 2.04.01 CroBas Model ... 37 2.04.02 Sensitivity Analysis... 39 2.04.03 Calibration ... 40 2.04.04 Validation ... 42 2.05 Results ... 47 2.05.01 Sensitivity Analysis... 47 2.05.02 Calibration ... 49 2.05.03 Validation ... 54 2.06 Discussion ... 57 2.07 Conclusion ... 63 General Conclusion ... 65 References ... 67 Appendix 1 ... 75 Appendix 2 ... 77 Appendix 3 ... 79
viii
Appendix 4 ... 81
Appendix 5 ... 83
Background ... 83
Methods and Results ... 83
k ... 83
an ... 84
Conclusion ... 84
List of Tables
Table 1: Summary of Inputs used to run PipeQual for qualitative analyses.* ... 17
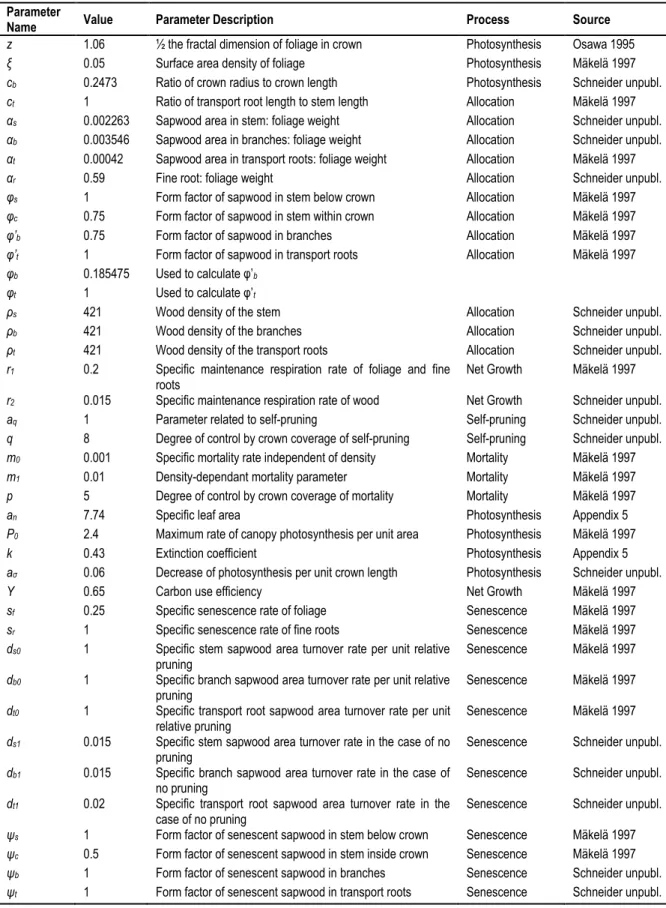
Table 2: CroBas parameters and their initial default values. ... 38
Table 3: CroBas inputs used to represent the twelve Pothier and Savard (1998) yield curves at 20 years for the stand height sensitivity analysis. ... 40
Table 4: Netdown results of the plot database. ... 43
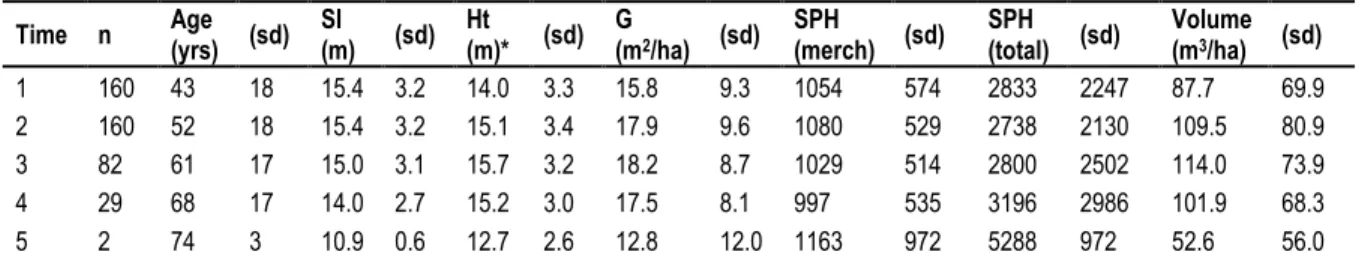
Table 5: Summary of plot data by measurement (time) period.** ... 43
Table 6: Summary of plot PAI data by measurement (time) period.** ... 44
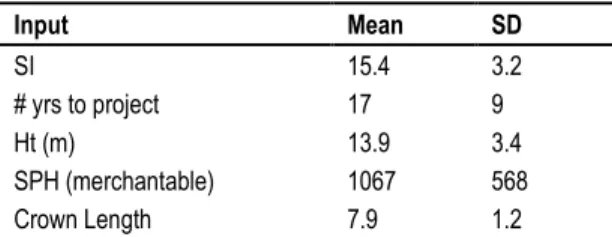
Table 7: Summary of the Québec PSP data used as inputs to initiate CroBas.* ... 44
Table 8: Results of the sensitivity calculations: the contribution (%) of the parameters and inputs to the overall uncertainty of the CroBas model outputs. Numbers in bold indicate the parameters that contribute to the top 90% of the variability for that specific output. ... 48
Table 9: P0 and aσ values, by SI, as predicted by the empirical relationships calibrated within the final BYSM routine. ... 51
Table 10: Summary of CroBas predictions by measurement (time) period.* ... 55
Table 11: Summary of CroBas-predicted increment data by measurement (time) period.* ... 55
Table 12: Summary of attribute differences (actual – predicted) by measurement (time) period.** ... 55
List of Figures
Figure 1: Stand-level height (a), SPH (b), G (c) and total volume (d) predictions vs. stand age after running PipeQual for 100 years, using inputs from 20 Québec PSPs. ... 19 Figure 2: Individual tree heights as predicted by CroBas over 100 years for twenty Québec permanent sample plots. Red, bold lines indicate the stand dominant heights predicted by Pothier and Savard (1998). Black dots indicate tree measurements used to initiate PipeQual. Blue dots indicate subsequent plot measurements. ... 26 Figure 3: Histograms of CroBas’ outputs from the Monte Carlo Simulation. Histograms correspond to the predicted height errors at stand ages 50 and 100. ... 48 Figure 4: Prior distribution (red), and posterior distributions (black) of P0 estimates obtained by calibrating each stand independently. Posterior distributions, in this case, are grouped by SI-class. ... 51 Figure 5: Graphical convergence diagnostic diagrams for the new parameters of the empirical relationship between P0 and SI (βP0,1 and βP0,2). Trace plots on the left demonstrate chain mixing and stationarity. Density plots on the right are the posterior distributions of the parameter estimates, and demonstrate a unimodal distribution of parameter estimates. ... 52 Figure 6: Graphical convergence diagnostic diagrams for the new parameters of the empirical relationship between aσ and SI (βaσ,1 and βaσ,2). Trace plots on the left demonstrate chain mixing and stationarity. Density plots on the right are the posterior distributions of the parameter estimates, and demonstrate a unimodal distribution of parameter estimates. ... 53 Figure 7: Graphical representation of CroBas-predicted heights (dashed lines) after updating the model to reflect BYSM results. Solid lines are the Pothier and Savard (1998) height curves. Colour-codes for the dashed lines are black = low density, red = med density, and blue = high density. ... 54
Foreword
For this research, Stephanie Ewen, Frédéric Raulier, and Valerie LeMay took part in the conception and design of this study. S. Ewen conducted the analytical, simulation and calibration work, and wrote and edited the manuscript under the supervision of F. Raulier and V. LeMay.
Neither of the two articles included have been submitted for publication, nor published. However, it is the intent of S. Ewen to submit Article 2 for publication with F. Raulier as a co-author.
General Introduction
Growth and yield models are used in forest management to predict forest growth under a variety of forest interventions. Also, these models are used by researchers and practitioners to examine growth processes. This information is often used operationally to make forest management decisions. These growth and yield models can be broadly separated into two types: empirical versus process-based models (Sievänen and Burk 1993; Robinson and Ek 2003; Weiskittel et al. 2011; Burkhart and Tomé 2012; Garcia 2012). Empirical models may be tree-, stand-, or mixed tree and stand-level models that are created by fitting model sub-components using available historical data along with data from experiments. Process-based models may be at the tree- (CroBas; Mäkelä 1997, for example) or forest-level (3-PG; Landsberg and Waring 1997, for example) and are mathematical representations of the biological processes that contribute to tree or forest growth. Both types of models have advantages and applications for which they are best suited. As a result, a number of authors have proposed hybrid models that combine empirical and process models to improve accuracy of predictions while extending the amplitude of possible applications (Peng et al. 2002; Radtke and Robinson 2006; Raulier et al. 2003; Robinson and Ek 2003; Valentine and Mäkelä 2005). This general introduction provides the impetus for the method of creating a hybrid model of a process-based tree-growth model and empirical yield curves presented in this research.
Empirical yield models, particularly stand-level models, have been extensively used in large-scale planning applications because they often have been rigorously tested and have been shown to accurately predict stand-level attributes in applications for which they are designed. These characteristics give users a high stand-level of confidence that predictions are reasonable and can form the basis of forest management policy or investment decision. However, these models do not represent biological processes and may not be accurate outside of the conditions that exist within the data used to fit these models (Sievänen and Burk 1993; Pothier and Savard 1998; Robinson and Ek 2003; Weiskittel et al. 2011; Burkhart and Tomé 2012; Garcia 2012).
Process-based tree- and forest-growth models are commonly used in research settings to study the main drivers of tree growth, how the processes of tree growth interact, and the expected response of growth to changes under those processes. These models are developed to comprehensively describe forest and tree growth processes mathematically with a system of causal relationships and interactions. Parameterization and calibration of these models has historically been very difficult, and tree-level process-models require inputs not commonly available from forest inventories. Therefore, they are not commonly used for large-scale planning (Sievänen and Burk 1993; Mäkelä et al. 2000; Robinson and Ek 2003; Burkhart and Tomé 2012; Garcia 2012).
2
Recently, the Canadian federal government has identified that the current approach to managing public forests is no longer contributing to an economically sustainable or globally competitive forest industry in Canada (NRC 2012). A federal investment strategy in forest research has been developed to focus on reviving and re-invigorating the industry to regain value and global competitiveness (NRC 2012). While there is substantial investment in the research of gaining value from new products and new processing technologies, recognition has also been given to the potential value to be gained by adjusting the resource supply paradigm (NRC 2012). Historically, technology and policy limitations have dictated that the distribution of Canadian forest products be primarily resource-driven rather than consumer-driven. Advancements in computing efficiency and support from government research agencies have provided the environment and motivation necessary to develop methods for the forest industry to respond efficiently to consumer demands (Jerbi et al. 2012). The development of modelling frameworks that represent the forest supply chain and support forest management decision-making that optimizes value within that chain have been the major area of focus for changing the forest resource distribution paradigm (Jerbi et al. 2012; NRC 2012). Forest growth and yield models have a role within these modelling frameworks to predict the growth and value production attributes of the forest landbase (Cloutier n.d.).
ForValueNet is a National Science and Engineering Research Council (NSERC) funded strategic network that was established in 2008 as one of the initiatives created to focus on value optimization of wood manufacturing processes, harvesting decisions, and silvicultural activities in the Canadian Boreal Forest by developing an integrated modelling decision-support system (DSS) that represents the forest-wood supply chain (Cloutier n.d.; NRC 2012). In the context of a DSS, a growth and yield model is needed to predict volume growth and stem characteristics that are related to wood quality, end-use and value. The model predictions are expected to be sensitive to silvicultural and harvesting activities in order to aid forest managers in making investment decisions that will maximize forest product value.
CroBas is a process-based tree growth model that was developed to provide a comprehensive description of tree growth and biomass allocation of the average tree within a stand. Specifically, CroBas was designed to study how those processes contribute to wood quality by predicting the live crown length, total cross-sectional area of branches, sapwood area at the base of the live crown and shape of an average tree in response to different stand conditions (Mäkelä 1997; Mäkelä et al. 1997). Subsequently, additional WHORL and BRANCH modules were added to CroBas (Mäkelä 2002; Mäkelä and Mäkinen 2003), becoming PipeQual. The WHORL module predicts the vertical structure of the stem and of branches along the stem based on pipe model theory (Mäkelä 2002). CroBas is modified to act as the growth engine (the TREE module) and runs in parallel with the WHORL module, each providing feedback to the other. The BRANCH module uses carbon balance and allocation predictions from both the TREE and WHORL modules to predict the number, size, compass and
insertion angles, and self-pruning rates of branches within each whorl through empirical relationships (Mäkelä and Mäkinen 2003). A further modification included within PipeQual is the ability to model multiple tree size classes within a single stand (Mäkelä 2002; Mäkelä and Mäkinen 2003). The advantage of using CroBas or PipeQual (CroBas-PipeQual) within a DSS is its capacity to predict tree characteristics that describe crown structure, an attribute critical to tree growth and economic value related to wood characteristics. Further, diverse and changing stand conditions can be simulated and only input variables are needed (Mäkelä 1997; Schneider et al. 2011b).
As part of a forest-level DSS, CroBas-PipeQual would be used to predict individual-tree shape and size attributes for forest stands of common coniferous species across Canada’s Boreal Forest to inform harvest scheduling, silvicultural investment and infrastructure development decisions. To fulfill these requirements, CroBas-PipeQual must provide reliable forecasts. The primary outputs of interest from CroBas for integration within a forest-level DSS are stand-level growth and yield attributes including volume per hectare and average tree size; secondary to stand-level attributes, detailed tree lists can provide information needed to predict value (Martin Simard, Alexis Achim and Normand Paradis, pers. comm.). The driving objective of the research presented in this thesis was to evaluate the use of CroBas-PipeQual, particularly for jack pine (Pinus
banksiana Lamb.) since the model has been initially calibrated for this common Canadian Boreal Forest
species. Chapter 1 provides a qualitative review of stand-level attributes predicted with the jack pine version of PipeQual for use as a large-scale forest planning tool within a forest DSS. The results of Chapter 1 indicated that CroBas-PipeQual requires some improvement to build confidence in its stand-level predictions over long time periods. Thus, Chapter 2 presents and evaluates an approach that uses Bayesian melding to create a hybrid model of the simpler 1997 version of CroBas with an existing empirical yield model. The general conclusion provides a reflection on the overall utility of CroBas-PipeQual for use as a forest planning tool within a forest DSS, the specific results of this research, and suggested areas of future research.
Article 1.
Qualitative assessment of a
process-based forest growth model for use in a
value-optimization decision support tool
1.01
Abstract
Within the context of forest supply chain optimization, and to best understand forest development and raw timber value over time, a forest growth and yield model should be accurate, represent a large variety of management interventions, and be easily and transparently implemented. Further, tree-level attributes that relate to wood quality and value must be forecasted, and this is not commonly the case with existing empirical growth and yield models. PipeQual (Mäkelä and Mäkinen 2003) is a process-based tree-level growth model that has demonstrated strengths in many of these aspects, particularly in being able to forecast growth under alternative forest management interventions, and in predicting important tree-level attributes related to quality such as live crown length, knot size and frequency, and bole shape.
In this research, I applied qualitative methods to assess PipeQual, as calibrated for the common Canadian Boreal Forest species, jack pine (Pinus banksiana Lamb.), as the potential growth and yield model component of a supply chain model. Using real data from permanent sample plots (PSPs), PipeQual was used to simulate 100 years of growth. Stand- and tree-level outputs were graphed and qualitatively assessed, based on local and biological knowledge of tree growth for the PSPs.
Qualitative analyses identified that the predicted range of basic stand attributes including height, basal area and volume is outside the range of those actually observed in Québec jack pine stands. Also, the predicted trajectories of these attributes are not biologically appropriate. Although the version of PipeQual used is still under development, I did identify areas of research that would increase the applicability of PipeQual in a supply chain or forest-level decision support model (DSS).
1.02
Résumé
Dans le contexte de l’optimisation de la chaîne d’approvisionnement forestier et pour mieux comprendre la dynamique de croissance en forêt et celle de la valeur du bois comme matière première, un modèle de croissance et de rendement devrait être précis et capable d’émuler une large variété d’interventions en forêt. Il devrait être facile et transparent à l’usage. De plus, les attributs à l’échelle de l’arbre qui sont corrélés à la qualité du bois et à sa valeur doivent pouvoir être fournis, ce qui n’est pas chose fréquente avec les modèles de croissance et de rendement empiriques. PipeQual (Mäkelä et Mäkinen 2003) est un modèle de croissance d’arbre basé sur les processus qui a démontré son utilité pour plusieurs de ces aspects, particulièrement grâce à sa capacité de prévoir la croissance suite à différentes interventions sylvicoles et de fournir des attributs à l’échelle de l’arbre reliés à la qualité du bois, tels que la longueur de la cime, la fréquence et la taille des noeuds et le défilement de la tige.
Cette recherche utilise des analyses qualitatives pour évaluer l'application de PipeQual comme modèle de croissance, une fois calibré pour le pin gris (Pinus banksiana Lamb.), une espèce commune de la forêt boréale canadienne. À l’aide de données observées dans des placettes-échantillons permanentes (PEP), 100 ans de croissance ont été simulés avec PipeQual. Les résultats des simulations ont été évalués de façon qualitative à l’échelle des arbres et des placettes, sur la base de connaissances générales sur la biologie de la croissance des arbres.
L’analyse qualitative a identifié que les valeurs prédites à l’échelle des placettes pour la hauteur, la surface terrière et le volume sortent de la gamme de valeurs observées pour le pin gris au Québec. En outre, les trajectoires simulées par PipeQual pour ces attributs ne sont pas biologiquement conformes. La paramétrisation actuelle de PipeQual ne permet pas actuellement d’intégrer ce modèle dans un outil décisionnel, même s’il a des caractéristiques désirables pour estimer la valeur et la qualité des arbres.
1.03
Introduction
ForValueNet is a strategic network that was established in 2008 with the intent of broadening the understanding of value-added manufacturing and intensive forest management within the context of the Canadian Boreal Forest (Réseau stratégique ForêtValeur 2008). The overall objective of this strategic network is to develop an integrated decision-support system (DSS) that represents the forest-wood value chain to be used for the value optimization of wood manufacturing processes, harvesting decisions, and silvicultural activities (Cloutier n.d.). Within this DSS, the forest growth model is expected to predict volume growth and stem characteristics used to predict wood quality, end-use and value. The model predictions are expected to be sensitive to silvicultural and harvesting activities in order to aid forest managers in making decisions that will maximize forest product value.
PipeQual is a process-based tree growth model that was developed for Scots pine (Pinus sylvestrus L.) in Finland, that uses functional relationships and carbon balance modelling to describe tree growth and biomass allocation (Mäkelä and Mäkinen 2003). Stand-level attributes are derived from a combination of cumulative tree-level attributes and tree mortality predicted with respect to stand conditions. The benefit of PipeQual lies in its capacity to predict crown structure over time in diverse and changing stand conditions. Crown structure prediction is critical for predicting tree growth, available wood products and economic value (Schneider et al. 2011b). Additionally, because PipeQual is a process-based model that represents biological growth processes, as opposed to an empirical model fitted using observations resulting from historic management and climatic conditions, it may be more accurate under new, innovative forest practices and changes in climatic conditions. Although currently only calibrated for use with single-species, even-aged stands, given its ability to predict tree structure and growth in response to inter-tree competition for light resources, PipeQual is expected to be adaptable to mixed stands. PipeQual and is simpler predecessor, CroBas, have been in use as research tools in Finland for several years, and have formed the basis of several subsequent modelling endeavours (Mäkelä 1997; Mäkelä et al. 1997; Mäkelä 2002; Robinson and Ek 2003; Valentine and Mäkelä 2005; Raulier 2006; Dykstra and Monserud 2009; Coll et al. 2011). As a result, users have a sense of reliability and acceptability, particularly because of the model structure. For these reasons, PipeQual was selected as the forest growth and yield model to be calibrated for coniferous pure-species stands of Canada’s Boreal Forests, and integrated into the forest-supply-chain modelling network.
Within the integrated modelling network, PipeQual is expected to be applicable at a variety of scales providing also a variety of outputs. At the tree-level, attributes of interest include the shape and sizes of every tree in a stand (Cloutier n.d.). However, the overall goal of the integrated modelling network is to have a series of national-scale tools that will enhance the global competitiveness of Canadian Boreal Forest products by
10
improving management decision-making with respect to overall forest value (Cloutier n.d.). To date, the tree-level functional relationships for jack pine (Pinus banksiana Lamb.), including an additional sub-model that accounts for inter-nodal branching, have been calibrated (Schneider et al. 2011a & 2011b; Goudiaby 2011). Calibration of these tree-level relationships has been done using data from destructively-sampled trees in Québec. However, little attention has been paid to ensure stand-level attributes are accurate and realistic (Robert Schneider, pers.comm.).
Further, some concern does exist with respect to the use of PipeQual as the growth and yield model in a forest-level DSS. As currently calibrated for jack pine, site quality is a model input, but not for most of the growth processes. Site index (SI), stand top-height often referenced at 50 years breast height age, is commonly used to index site productivity in simple-structured stands (i.e., even-aged, and few species). As a measure of height, SI is closely linked to height and volume growth. As a result, empirical growth and yield curves for simple-structured stands require site index as an input to predict growth and yield over time. PipeQual currently does require site index (reference 20 years total age) as an input (Schneider et al. 2011b, Robert Schneider, pers.comm). However, this is only used to estimate the occurrence of inter-nodal branches, not growth and yield over time. Another area of concern is that the inputs required to initiate PipeQual are not commonly available in forest inventories, as with other tree-level growth and yield models.
With these concerns in mind, permanent sample plot (PSP) data from the province of Québec was used to initiate PipeQual, and then the behaviours and predictions over a 100-yr forecast period were observed. Although the PSP data used do not cover the entire 100-yr management period (MRNF n.d.), examination of this 100-yr period was considered to be an essential step in evaluating whether model behaviours were realistic given first principles of growth. The 100-yr interval may be considered reflective of an approximate biological rotation period or a reasonable length of time for a strategic management plan. Also, predictions of state variables are highly dependent on the input state variables over short prediction periods; a 100-yr interval will provide a better opportunity to observe model behaviour rather than artefacts of model inputs. Qualitative assessments were used to understand and observe trends that indicate whether growth predictions are expected to be reasonable over the entire length of a planning horizon.
One of the underlying assumptions of process-based models is that they can be extended to make predictions under conditions that have not yet been observed in those systems (Sievänen and Burk 1993; Mäkelä et al. 2000; Robinson and Ek 2003; Garcia 2012). If sub-models are assumed to adequately represent the biological processes occurring, accurate predictions should occur. Qualitative analyses will provide an indication of whether the general behaviour of the model is biologically appropriate, testing that particular assumption of the model.
Finally, implementing PipeQual using PSP data as a proxy for forest inventory plot data provided insights into the model’s utility with respect to the ease and transparency of implementation on a large scale over long planning horizons. Also, the qualitative analyses provided an aid to understanding how well forest inventory data (here PSP data) might represent the average tree used as the basis of growth in CroBas and PipeQual (Mäkelä 1997; Mäkelä and Mäkinen 2003). The overall objective of this research in this paper was to use these qualitative analyses to characterize the applicability and limitations of integrating PipeQual, as calibrated for jack pine, into a DSS for forest supply chain decision optimization modelling in the province of Québec.
1.04
Methods
1.04.01
PSP Data
A province-wide network of PSPs has been established and maintained in the province of Québec by the Ministry of Natural Resources and Wildlife (MRNF) since 1970 (MRNF n.d.; MRNF 2009). These PSPs are used to monitor physical, dendrometric, and ecological changes in the forest over time. Plots have been re-measured on average every 10 years up to five times. Within each 400 m2 plot, species and diameter at breast
height (DBH) were recorded for every tree with a DBH larger than 9 cm. Heights and age (ring count at 1 m) were measured on one to 13 randomly selected trees. Saplings taller than 1.3 m with a DBH smaller than 9 cm were counted by DBH-classes of 2 cm within a subplot of 40 m2. Further information on plot sampling can be
found in the field sampling handbook (MRNF n.d.; MRNF 2009).
From the 11,805 PSPs in the database, 156 pure pine PSPs were selected, which were 100% jack pine by basal area per hectare at the first measurement. Before using the data for initiating PipeQual, the selected PSP data were explored and any data anomalies were corrected when possible, including correcting tree numbers that changed between subsequent plot visits.
The 1997 version of CroBas is initiated with and used to predict average-tree- and stand-level attributes based on a small number of inputs, specifically: average tree height, average tree crown length, and number of trees per hectare. However, PipeQual allows for multiple size classes as inputs, thereby preventing the need for an average tree to represent the entire stand (or plot) (Mäkela and Mäkinen 2003). Rather than creating size classes, each tree or sapling DBH-class represented its own size class; therefore, each tree was forecast using this version of PipeQual.
To obtain the model initiation inputs, the first measurements of each pine-leading PSP were used. However, first, any unmeasured heights were imputed using Equation 1 from Pothier and Savard (1998). Although these height models were not designed for use on trees less than 9 cm at DBH, this was the best available model to infer the average height of saplings within each DBH class. Crown lengths are not available within the Québec PSP dataset; the crown length model of Holdaway (1986) was assumed to provide sufficiently accurate estimates for this variable. This is a potential concern because crown height is used directly within the model to predict many tree-level attributes and drive growth (Mäkelä 1997). Once any missing heights and crown lengths were estimated, averages were calculated.
A number of variables were calculated on each PSP to compare to PipeQual outputs. First, DBH and height provided input to the Québec tree volume models of Perron (2003) to calculate individual tree volumes.. These volumes were summarized to obtain volume per hectare for each measurement of each PSP. Site
14
indices (SIs) and ages are useful in plot classification and are used as inputs to empirical models. Also, a 20-yr SI value is used in this version of PipeQual to predict inter-nodal branching of jack pine. Stand age and SI for each PSP were calculated as outlined in Pothier and Savard (1998). Plots that did not have age, site index or a height for every tree (measured or imputed) were removed from further analyses.
1.04.02
PipeQual Model for Jack Pine and Model Forecasts
The intent was to implement PipeQual, as parameterized for jack pine by Schneider et al. (2011a; 2011b; Goudiaby 2011), as a “black box” and comment on the results from using the model without alterations:, there was minimal investigation of the actual fitted models or process flow of the model.
The CAPSIS (computer-aided projection of strategies in silvicuture; a forest-growth modelling platform) graphical user interface was used as the programming platform for PipeQual for jack pine within ForValueNet and allows for manual adjustment of the parameter values and batch processing of stands (Dufour-Kowalski et
al. 2012). However, because only jack pine PSPs were forecast, and model had been calibrated for jack pine
(100% by basal area), default parameters were used to manually forecast each PSP. Schneider et al. (2011a; 2011b; Goudiaby 2011) did not use Mäkelä’s (1997) mortality model for the CAPSIS version of PipeQual. Rather, the mortality model from the local Québec forest growth model, Artémis-2009 (Fortin and Langevin 2010), was used in its place (Robert Schneider pers. comm.).
Using this model, each PSP was forecast for a 100-year period and a text file of the model predictions for each of the 100 years was output. The outputs included, but were not limited to: tree DBH, tree height, tree merchantable and total volumes, and number of stems per hectare (SPH) representing the average tree in each tree size class. Stand-level attributes were derived from a combination of cumulative tree-level attributes, and tree mortality predicted with respect to stand conditions.
Once each PSP was forecast, the PipeQual model outputs were compared to measured PSP variables. However, as mentioned, the PSPs had not been measured for 100 years. As a result, the PipeQual model outputs were also compared to forecasts using the Pothier and Savard (1998) yield models where the same model inputs were used in the forecast. Although PipeQual’s behaviour or predictions were not expected to be identical to the Pothier and Savard (1998) yield curves, the behaviour and scale of predictions was expected to be similar.
1.04.03
Analyses
Difficulties were encountered with many of the pure pine plots, particularly that the raw plot information would not load into CAPSIS, or PipeQual would not progress forward to grow the plot if more than one tree in the list of trees input to the model had the same height or crown length (termed “duplicate” heights and crown lengths
here; Venceslas Goudiaby, pers.comm.). Therefore, to proceed, plots that had duplicate heights and crown lengths were removed from the analysis leaving 20 plots.
For the remaining 20 plots that were forecasted using PipeQual, qualitative analyses consisted of graphing forecasts of:
1. Total stand basal area (G) over average plot (i.e., stand) age; 2. Total stand volume over stand age;
3. Total stand density over stand age; 4. Average stand height over stand age; and 5. Individual tree heights over stand age.
For the graphs showing individual tree heights, the Pothier and Savard (1998)-predicted dominant stand height curve and also PSP height measurements were overlaid with the PipeQual model predictions. All graphs were visually assessed for plausible growth behaviours. As noted, trajectories using the same inputs and the Pothier and Savard (1998) yield models served as a reference for assessing the scale of predictions for all attributes.
1.05
Results and Discussion
1.05.01
Model Implementation
Several important observations regarding the applicability of PipeQual were made in the process of implementing the model. First, the inability to automate the model poses a barrier to broad-scale application. Not only is running each stand through the CAPSIS graphical user interface inefficient, this implementation method is also susceptible to user-induced errors such as mislabeling files or importing incorrect input files when performed repetitively. As a research tool, the number of graphical displays and outputs available is incredibly useful, allowing users to test growth behaviour of a stand in different management scenarios. However, the processing time of each PSP was quite long, often taking 30 minutes or more for one stand to be projected for 100 years. Presumably, creating a batch version of PipeQual, without the additional graphical outputs would be faster and more appropriate for use at a large scale.
In order for PipeQual to be applicable to a wide variety of site conditions, some of the parameter values would have to vary to reflect changing site and climate conditions (Mäkelä et. al. 1997; Raulier 2006). Currently, to adjust the parameter values, they must be manually adjusted in the graphical user interface. Parameter changes are not tracked or recorded as an output. Again, this makes the CAPSIS version of PipeQual susceptible to user-error in entering parameter values incorrectly, or not maintaining a record of parameter values associated with specific runs of the model for future use or analysis.
These particular implementation impediments are minor logistical issues when considering the research question of whether PipeQual is appropriate for integration into a DSS. There are several other forest growth and yield models currently being run within the CAPSIS modelling platform for landscape-level applications (de Coligny 2011). Presumably, this indicates that the software could be easily developed to bring that same ease of application to PipeQual.
Table 1: Summary of Inputs used to run PipeQual for qualitative analyses.*
Attribute Mean SD Min Max
SPH 1396 2184 25 9300
DBH (cm) 11.1 3.3 5.4 18.8 Height (m) 7.7 2.4 4.8 14.0 Crown Length (m) 5.8 1.3 3.8 8.2
Age (yrs) 44 26 18 106
* SPH = stems per hectare; DBH = diameter at breast height (1.3 m); SD = standard deviation of the input values; Min = Minimum input value used; Max = maximum input value used.
A more important finding in this research with respect to model implementation was the large number of PSPs that could not be loaded or forecasted. This finding indicates that the application of this version of PipeQual to a variety of stand types is very limited. In this research, it could only be applied to 0.2% of all Québec PSPs,
18
and 3% of all pine-leading PSPs (≥ 75% jack pine, by basal area; Pothier and Savard 1998), which is very restrictive. Table 1 summarizes the inputs used to run PipeQual for the 20 pure-pine PSPs that were successfully loaded and projected. By using more general stand-averaged forest inventory data (i.e., tree cohorts instead of individual trees), some of the problems encountered could be avoided. Specifically, the processing errors associated with “duplicate” input values could be eliminated by either using single stand-average values or actually creating size classes to allow similarly sized trees to be grouped together. Unfortunately, using single stand-average values as the inputs does diminish PipeQual’s ability to provide information on multiple tree size classes. Furthermore, although the basic stand-level CroBas model is based on the concept of growing the average tree in a stand, the concept is poorly described. Even when multiple size classes are used, each size class is represented by a theoretical average tree that is not well defined in the papers describing the model (Mäkelä 1997; Mäkelä et. al. 1997; Mäkelä 2002; Mäkelä and Mäkinen 2003). In this research, each individual tree measured in the PSP was used as an independent size class rather than pooling the trees into size classes and calculating the attributes of the average tree representing each size class. The details of what the average tree is will likely be important when initiating stands that are already well established, are showing much more stem differentiation than a new plantation, and have limited information available compared to the data available for PSPs. Basic forest inventory data in Canada is typically based on the dominant forest canopy layer that is visible aerially for forest interpreters. Smaller trees are often not included, despite the role they play in stand development and space occupation. Further research and model testing is required to understand if the exclusion of small trees will change model predictions unfavourably.
1.05.02
Stand-level Predictions
Figure 1 depicts the stand-level yield predictions of height, density, G, and total volume resulting from running PipeQual for 100 years, using the inputs calculated from 20 Québec PSPs. Stand age on the x-axis is based on the average stand age at the initial measurement, calculated as per Pothier and Savard (1998).
Immediately, when observing the graphics of the stand-level attributes, the range of predictions for height, G and volume appear to be outside the range of values that would be expected in pine stands of the Boreal Forest in Québec (Figure 1 and Table 1 Pothier and Savard 1998; Tables 1 and 12 Pothier and Auger 2011). The Boreal Forest is characterized by a cold climate with short growing seasons in which forest growth rates are relatively slow (Kimball et al. 2000). Some approximate maximum values for dominant stand height, G and total volume reported for shade-intolerant softwoods (including jack pine) in Québec are 30 m, 35 m2/ha and
325 m3/ha (Pothier and Savard 1998, Pothier and Auger 2011). PipeQual predicted that after 100 years,
(a) (b)
(c) (d)
Figure 1: Stand-level height (a), SPH (b), G (c) and total volume (d) predictions vs. stand age after running PipeQual for 100 years, using inputs from 20 Québec PSPs.
Not only are the heights predicted to be greater than expected, trees are also predicted to continue growing at much higher rates and for longer time frames than expected. Typically, the height of jack pine stands in the Boreal Forest is observed to plateau at a stand age between 80 and 100 years, depending on site quality (Pothier and Savard 1998). Although heights are predicted to plateau in a few stands, in most the heights are predicted continue to grow well beyond the expected plateau age (Figure 1a). One stand in particular appears to have dramatic height growth in one year. In this case, the dramatic increase in predicted height is the result of PipeQual predicting mortality of an entire, relatively short size class.
For the stands that are eventually predicted to plateau in height, that plateau does not necessarily appear to occur on a biologically relevant time scale. Height curves generally have a sigmoidal shape, related to the stand establishment, stem exclusion (rapid growth), understory reinitiation (maturation, slowing growth), and
20
old growth (over-mature, stand break-up, little to no growth) stages of stand development (Oliver 1981). However, the sigmoidal shapes of the height curves generated by PipeQual do not appear to be representative of those four stages of development. For instance, several of the PipeQual-generated height curves displayed a lag period of relatively slow growth upon initiation of the model. This would be reasonable if the inputs were created for a new stand or bare ground still in the stand establishment development stage. However, based on the starting points of the curves, the input data represent stands that are likely either in the stem exclusion or understory reinitiation stages already. In general, the height predictions and growth rates produced by PipeQual do not appear to be biologically appropriate in either behaviour or scale.
Given that CroBas and PipeQual do not model ingrowth of new stems, but do model both natural and density-dependent mortality, the general declining shape of the stand density curves observed is what might be expected (Figure 1b). These curves are more difficult to assess qualitatively, particularly for the rate of mortality and the timing of mortality, than the height growth curves because the actual attribute that the curves represent is unclear. Trees between 2 and 9 cm in DBH were included in the input estimate of total stand density without any consideration of crown class or relative size in the stand. In correspondence with this assumption about the inputs, the stand density predicted by PipeQual likely represents the total stand density as well. Most stand density information commonly available for mature stands is related to the density of the merchantable stems or the co-dominant / dominant stratum of trees. Therefore, there is difficulty in forming a baseline of what is a biologically realistic scale of density and biologically realistic mortality rate. Qualitatively, there is no initial indication that there is reason to be concerned about the density predictions.
Jack pine is a short-lived, early-successional species that typically exhibits a sigmoidal G yield curve that reaches a maximum during the understory reinitiation stage and then starts declining as the stand reaches old-growth and breaks up (Pothier and Savard 1998). Again, the characteristics of the G yield curves are associated with certain stages of stand development (Alder 1980; Oliver 1981). There are some PipeQual-predicted G yield curves which do not exhibit this characteristic shape at all; G is PipeQual-predicted to continue growing well beyond biologically appropriate values (Figure 1c). The curves that do display appropriate overall shape and scale are, again, in many cases not representing the development stages that the stands are expected to be in. There are four stands that only reach a maximum G of 4 m2/ha before G decline begins (Figure 1c). In
all four cases, there was only one tree recorded in the PSP at the time of the first measurement. This is likely due to the minimum size requirement for measurement paired with no small-tree tally data in the PSPs used to create these inputs rather than a realistic scenario. Despite the sigmoidal shape of these four G yield curves, the behaviour and scale is again not what is expected for jack pine in Québec. For PSPs with only one tree available as input, the total stand density without mortality, is 25 stems per hectare. To reach a maximum total stand G of 4 m2/ha, each tree would have to have a G of 0.16 m2/ha and a DBH of approximately 45 cm. This
is not a commonly-observed DBH in pine stands of the Canadian Boreal Forest, so for this value to be predicted for 20% of the stands modelled in this research is not appropriate (Raulier et al. 2003; Chen et al. 2008). In general, the basal area predictions and growth rates produced by PipeQual do not appear to be biologically appropriate in either behaviour or scale.
Total stand volume is highly dependant on stand height and total basal area (Alder 1980). Given that there are concerns about PipeQual’s scale of predictions and prediction behaviour for both stand height and total basal area, the observation of this same problem in total volume prediction was expected. Again, volume yield curves have a sigmoidal shape that represents distinct stages of stand development (Alder 1980; Oliver 1981). In all cases, the initial behaviour of the PipeQual-predicted yield curves indicates that stands are in the stand establishment stage of development. However, according to the PSP data, all stands used to generate model inputs should be in the stem exclusion or understory reinitiation stages of development (Figure 1d). Height and basal-area over-prediction in many stands by the end of the 100-year simulation compounded to create volumes that are also far over-predicted at the end of the 100-year simulation. The greater concern is the behaviour of the volume yield predictions generated by PipeQual. Often, in forest management, the optimal time to harvest a stand is believed to be at the point when the stand reaches maximum mean annual increment (MAI): the year that the stand experiences maximum volume growth rate. Harvesting at this time maximizes the productivity of the ground that the stand is growing on (FOPER n.d.). Many strategic timber supply models will estimate the year of the maximum MAI from the inflection point on the yield curves. Without appropriate yield prediction behaviour, strategic decisions based on MAI information will be poorly founded. Thus, PipeQual’s volume predictions and growth rates produced do not appear to be biologically appropriate in either behaviour or scale.
The results presented above indicate that PipeQual does not adequately predict height, basal area or volume. However, it should be noted that assumptions were made with respect to interpolating tree heights, and calculating crown length that confound the results. The errors associated with the model were not explicitly separated from the errors associated with these assumptions. PipeQual is not advised to be used, in the state and with the assumptions tested for this research, as a productivity model for jack pine in the province of Québec and integration into a supply chain modelling network.
1.05.03
Tree-level Predictions
PipeQual’s appeal as a process-based forest-growth model is related to its ability to predict the tree-level attributes that are indicative of wood quality. Few of the tree-level attributes of interest, such as crown length or branch size, are available in the PSP dataset to use for analysis. Before assessing PipeQual’s predictive ability for those attributes, individual tree heights were assessed, as they are more readily available in the
22
database for future quantitative comparison and are more commonly researched and documented. The results of graphing predicted individual tree heights over time for each plot are given in Figure 2. As with the stand height, independent of age or existing state when input into PipeQual, most trees were predicted to have a period of slow growth following model initiation before reaching a predicted period of increasing growth rates (Figure 2). This behaviour is not what is anticipated based on existing knowledge of tree growth (Assman 1970). PipeQual-predicted tree height of almost all trees surpasses the yield-table predicted dominant stand height by the end of the 100-yr simulation and do not plateau as expected. Clearly, individual tree heights and height growth rates are positively biased.
One trend identified in the graphs of individual tree heights over time (Figure 2) that could not be identified by looking at stand height alone was the observation that in some cases, the canopy position of trees within a stand becomes inverted (e.g. Figure 2: Plot ID = 7209401902). Although not unique to a single stand type in this research, this trend is particularly noticeable in stands that have a large number of size classes. For this predicted behaviour to be true, shorter trees in the stand would need to be more productive than tall trees. However, because jack pine is a shade-intolerant species, this is not likely.
In some cases, the tallest trees are predicted to have little or no growth (e.g. Figure 2: Plot ID = 9003502601). In many of those cases, this is what is expected of the trees based on historic observations (Pothier and Savard 1998). This observation indicates that perhaps there is not much work required to improve the behaviour of PipeQual for all tree sizes.
26
Figure 2: Individual tree heights as predicted by CroBas over 100 years for twenty Québec permanent sample plots. Red, bold lines indicate the stand dominant heights predicted by Pothier and Savard (1998). Black dots
1.06
Conclusion
The observations made indicate that PipeQual, as calibrated for jack pine in Québec, is not yet ready to be incorporated into a large-scale, decision-support model to aid in optimizing forest value. Qualitative analyses identified that basic stand attributes including height, basal area and volume are being predicted to reach values outside the range of those actually observed in Québec jack pine stands. Curve trajectories are not as expected; the shape of most PipeQual-predicted yield curves suggest that stands are in a stand initiation development phase, when in reality most of the PSPs should be in stands in the stem exclusion, understory reinitiation or even old growth stage of development.
Before using CroBas or PipeQual to predict quality-related tree-level attributes for coniferous species in the Boreal Forest of Canada, the stand-level predictions and overall behaviour must be improved. The difficulties encountered with running PipeQual for many stands and with automating the model runs must also be investigated to allow for more efficient model implementation. Calibrating PipeQual within the CAPSIS modelling platform is not suggested as the model is difficult to manipulate efficiently. Further evaluation of PipeQual through quantitative analyses is not required as qualitative analyses were sufficient to demonstrate that, as currently calibrated, it is not applicable for integration into a forest supply-chain decision-optimization modelling network in the province of Québec.
CroBas and PipeQual have strength as process-based models that predict quality-related tree-level attributes. Although this research has identified, through qualitative analyses, shortcomings in PipeQual’s scale of predictions and predictive behaviour, if these issues can be ameliorated, CroBas and / or PipeQual may still be an incredibly useful decision-making tool when the goal is to optimize forest value. To improve stand-level behaviour and predictions, the simpler tree-growth version of PipeQual, CroBas, could be used to predict only stand-level attributes based on the development of a single average tree in a more easily-manipulated modelling platform and re-calibrated to stand-level measurements.
Article 2.
Connecting theory to forest decision
support tools: hybridization of a process-based
productivity model with empirical height-yield
curves
2.01
Abstract
Process-based tree and forest models are mathematical representations of the biological processes that contribute to tree and forest growth. They are meant to provide a greater understanding of the main drivers of tree growth, how the processes of tree growth interact, and the expected response of growth to changes in those processes, such as climate changes or human intervention. CroBas is particularly designed to study how those growth processes contribute to wood quality by predicting branching patterns, knot sizes, live crown length, and tree shape. Process-based models are inherently difficult to use for forest-scale planning and management decisions. Often, insufficient information exists to parameterize the processes that they represent. Thus, they are commonly used in a research setting where the data and scenarios are highly controlled rather than a forest management application with large volumes of forest inventory data, and a common goal of predicting sustainable volume harvest levels. In this research, we used Bayesian melding to calibrate the stand-level version of the CroBas model for jack pine (Pinus banksiana Lamb.) in Québec, Canada using empirical height yield models commonly used in the province. The overall goal was that this hybrid model could be used for forest-level planning. This objective was met by:
1. Identifying CroBas’ key parameters for height prediction in a sensitivity analysis;
2. Calibrating the key parameters identified in the sensitivity analysis using Bayesian melding of CroBas and empirical height yield curves; and
3. Testing the re-calibrated version of CroBas against Québec PSP data. Key findings include:
1. The input values and parameters related to net photosynthesis had the greatest effect on height predictions;
2. To improve model performance, at least two of the parameters related to net productivity should vary with site quality: the maximum rate of canopy photosynthesis per unit area (P0), and the reduction of photosynthetic rate per unit of crown length (aσ); and
3. The model performance still needs improvement before being integrated into a forest-supply-chain-decision-optimization modeling network as a large-scale growth-prediction tool.
2.02
Résumé
Les modèles basés sur les processus sont généralement utilisés en recherche en raison du fait qu’ils restent difficiles à paramétrer et à utiliser pour la gestion ou la planification forestière. Toutefois, l'hybridation de modèles basés sur les processus avec des modèles empiriques est une approche qui pourrait permettre de résoudre cette problématique. Dans cette recherche, CroBas a été hybridé avec les tables de production forestières utilisées au Québec pour améliorer leur applicabilité à la prise de décision en gestion forestière. Cet objectif a été atteint en:
1. Identifiant les paramètres les plus sensibles pour prédire la croissance de hauteur, à l’aide d’une analyse de sensibilité,
2. Utilisant la « fusion bayesienne » pour hybrider CroBas avec les tables de production forestière, et 3. En évaluant les prévisions de hauteur de CroBas avec des mesures faites à l’aide de placettes
échantillon permanentes. Les conclusions générales sont que:
1. Les prédictions de hauteur sont les plus sensibles aux valeurs des intrants et des paramètres liés à la photosynthèse;
2. La performance de CroBas est améliorée quand nous incluons les relations entre deux paramètres de productivité nette et l'indice de qualité de station; et
3. La performance de CroBas a besoin d’être améliorée avant son utilisation à des fins de planification forestière.
2.03
Introduction
Growth and yield models are used in forest management and forest research as a means to gain understanding about forest growth and the effects of different forms of forest intervention. Often, they are used to make forest management decisions such as forecasting landscape-level sustainable harvest rates over long time scales. In research, they are commonly used to study the response of forest stands to specific interventions. These two general applications of growth and yield models are served by a wide variety of models that can be broadly divided into two types: empirical versus process-based models (Sievänen and Burk 1993; Robinson and Ek 2003; Weiskittel et al. 2011; Burkhart and Tomé 2012; Garcia 2012). Empirical models are those that are created by using statistical methods to fit model sub-components using available historical data along with data from experiments. Process-based forest models, however, are mathematical representations of the biological processes that contribute to tree or forest growth. Both category of model has advantages and applications that they are best suited to. As a result, a number of authors have proposed hybrid models that combine empirical and process models to improve accuracy of predictions while extending the amplitude of possible applications (Peng et al. 2002; Radtke and Robinson 2006; Raulier et al. 2003; Robinson and Ek 2003; Valentine and Mäkelä 2005).
Empirical yield models, particularly stand-level models, have been extensively used in large-scale planning applications because they often have been rigorously tested and have been shown to accurately predict stand-level attributes in applications for which they are designed. These characteristics give users a high stand-level of confidence that predictions are reasonable and can form the basis of forest management policy or investment decision. However, these models do not represent biological processes and may not be accurate outside of the conditions that exist within the data used to fit these models (Sievänen and Burk 1993; Pothier and Savard 1998; Robinson and Ek 2003; Weiskittel et al. 2011; Burkhart and Tomé 2012; Garcia 2012).
Process-based tree and forest growth models are commonly used in research settings to study the main drivers of tree growth, how the processes of tree growth interact, and the expected response of growth to changes under those processes. These models are developed to comprehensively describe forest and tree growth processes mathematically with a system of causal relationships and interactions. Some examples of process-based forest growth models are 3-PG (Landsberg and Waring 1997), JABOWA (Botkin et al. 1972), FOREST 5 (Robinson and Ek 2003), PipeQual (Mäkelä 2002), FORUG (Verbeeck et al. 2006), and TRIPLEX (Peng et al. 2002). Parameterization and calibration of these models has historically been very difficult, and tree-level process-models require inputs not commonly available from forest inventories. Therefore, they are not commonly used for large-scale planning (Sievänen and Burk 1993; Mäkelä et al. 2000; Robinson and Ek 2003; Burkhart and Tomé 2012; Garcia 2012).
34
PipeQual is a process-based tree-growth model that was developed in Finland for even-aged Scots pine (Pinus sylvestris L.; Mäkelä and Mäkinen 2003), then re-parameterized for jack pine (Pinus banksiana Lamb.) in Canada’s Boreal Forest (Goudiaby 2011). PipeQual is specifically designed to study how tree and forest growth processes contribute to wood quality by predicting branching patterns, knot sizes, live crown length, and tree shape (Mäkelä and Mäkinen 2003). It was selected as the forest growth model to be used within an integrated forest decision support system (DSS) for the Boreal Forest of Canada because of its ability to predict such quality- and value-related attributes (Cloutier n.d.). To date, the allometric, tree-level equations have been the focus of calibration, and little attention has been paid to ensure stand-level attributes remain reasonable and realistic (Robert Schneider, pers.comm.). Not surprisingly, the result is that PipeQual, as calibrated for jack pine, does not sufficiently predict the stand-level attributes of height, basal area (G), density or volume to be used in a forest planning context (Ewen Chapter 1; Shcherbinina 2012).
CroBas is a simplified version of PipeQual and is itself a process-based carbon allocation model that calculates net photosynthesis of the average tree in a forest stand, based on its theoretical foliage weight, photosynthetic capacity and respiratory losses. It then distributes the net assimilated carbon amongst carbon pools via functional and allometric relationships. Within CroBas, self-pruning and stand mortality are driven by stand density and crown closure. It does not support multiple size classes, prediction of branching patterns, or produce any graphical outputs as does the PipeQual version previously evaluated (Ewen Chapter 1; Shcherbinina 2012). CroBas is of interest for use within a Boreal Forest DSS because of its ability to predict quality-related tree attributes such as sapwood ratios, live crown length and total branch basal area (Schneider
et al. 2011b).
As mentioned, calibration of process-based models is inherently challenging as a result of the large number of parameters and correlated processes that often exist for the purpose of comprehensive system portrayal. As observed with CroBas, process-based models are not typically as reliable or applicable in large-scale forest management applications as empirical yield tables have been. To address this disparity between the two model types, there exists a variety of methods to hybridize process-based models with empirical models. Hybridization is the combination of statistical and mechanistic approaches to obtain parameter values and model relationships that will yield model-predicted results that are similar in accuracy to those of empirical models under similar conditions while being based in physiological processes as much as possible (Weiskittel
et al. 2011). The resulting hybridized models share the strengths of both model types in that they are more
reliable quantitatively, and also present a reasonable biological representation of the processes they are modeled after. Thus, they can potentially be applicable as a management tool in changing forest management paradigms, or climate conditions (Mäkelä et al. 2000; Robinson and Ek 2003; Radtke and Robinson 2006; Weiskittel et al. 2011; Burkhart and Tomé 2012).
Radtke and Robinson (2006) suggested the use of Bayesian melding (BYSM) to hybridize process-based forest growth models with empirical forest yield tables. Complex model structure does not inhibit the application of this particular method, and BYSM can be used to gain a greater understanding of the correlation structure of such models. One characteristic of BYSM is the capability to include prior information from numerous sources in the formation of prior parameter distributions for parameter values. This allows parameter values to be constrained to remain within biologically-relevant limits if enough information about the parameters is available to do so. The likelihood functions and data-inputs can be modified within the BYSM framework, once created, to reflect new or different research questions, emphasize different model characteristics, or incorporate new data when working towards continuous model improvement. Unfortunately, the trade-offs for these benefits are that BYSM has high computer processing requirements with long processing times, and analysis outputs are not always useful or may be difficult to interpret. The strength and weakness of the BYSM results are in the model structure itself, as this method assumes that model structure is fixed and appropriate, and finds the most likely combination of model parameters under the assumption that the data was produced from the model being calibrated. Finally, despite the advantage of being able to produce results for complex models, a combination of correlated parameters, parallel model processes and / or vague prior distributions due to lack of parameter-specific information may prevent the iterative search from converging on a single, stable and identifiable combination of parameter values as has been reported in many attempts to apply statistical techniques to process-based models (Kéry 2010; Bolker 2007). The BYSM method has been identified as a potentially useful method for calibrating the jack pine height predictions of CroBas to the jack pine yield curves of Québec (Pothier and Savard 1998). CroBas was chosen over PipeQual for this calibration because the general growth processes for carbon allocation, coarse tree growth and the mathematical equations that describe them are unchanged between the two models, and it predicts the stand-level attributes of interest in a more simplified format than PipeQual.
To avoid the potential risk of not obtaining useful results when using BYSM for the calibration of complex, process-based models, this research simplifies calibration by first identifying the critical parameters related to height prediction with a sensitivity analysis. Once identified, literature review provides the values of some critical parameters that have been well-researched and documented. Remaining critical parameter values will be estimated using BYSM of CroBas to empirical yield curve outputs.
Height is an attribute that has been extensively researched and documented; height growth is generally believed to be well-represented by empirical height-age curves (Pothier and Savard 1998; Skovsgaard and Vanclay 2008; Pothier and Auger 2011; Weiskittel et al. 2011; Burkhart and Tomé 2012), and is the primary driver of the tree growth and structural description in CroBas as the means for crown length expansion
36
(Mäkelä 1997). Height growth is responsive to and reflective of site and climate conditions; being able to model this with CroBas in a wide range of site conditions should improve the applicability of CroBas.
The objective of this research was to demonstrate the use of BYSM to improve the utility of CroBas by calibrating the height prediction of the jack pine stand-level version of the model to the empirical height yield curves of Pothier and Savard (1998) in the province of Québec. Specifically, this was achieved by:
1. Identifying CroBas’ key parameters for height prediction in a sensitivity analysis;
2. Calibrating the key parameters identified in the sensitivity analysis using Bayesian melding of CroBas and empirical height yield curves; and