Global Security Policies Against Terrorism and the Free Riding Problem: An Experimental Approach
37
0
0
Texte intégral
(2) CIRANO Le CIRANO est un organisme sans but lucratif constitué en vertu de la Loi des compagnies du Québec. Le financement de son infrastructure et de ses activités de recherche provient des cotisations de ses organisations-membres, d’une subvention d’infrastructure du Ministère du Développement économique et régional et de la Recherche, de même que des subventions et mandats obtenus par ses équipes de recherche. CIRANO is a private non-profit organization incorporated under the Québec Companies Act. Its infrastructure and research activities are funded through fees paid by member organizations, an infrastructure grant from the Ministère du Développement économique et régional et de la Recherche, and grants and research mandates obtained by its research teams. Les partenaires du CIRANO Partenaire majeur Ministère du Développement économique, de l’Innovation et de l’Exportation Partenaires corporatifs Banque de développement du Canada Banque du Canada Banque Laurentienne du Canada Banque Nationale du Canada Banque Royale du Canada Banque Scotia Bell Canada BMO Groupe financier Caisse de dépôt et placement du Québec DMR Fédération des caisses Desjardins du Québec Gaz de France Gaz Métro Hydro-Québec Industrie Canada Investissements PSP Ministère des Finances du Québec Power Corporation du Canada Raymond Chabot Grant Thornton Rio Tinto State Street Global Advisors Transat A.T. Ville de Montréal Partenaires universitaires École Polytechnique de Montréal HEC Montréal McGill University Université Concordia Université de Montréal Université de Sherbrooke Université du Québec Université du Québec à Montréal Université Laval Le CIRANO collabore avec de nombreux centres et chaires de recherche universitaires dont on peut consulter la liste sur son site web. Les cahiers de la série scientifique (CS) visent à rendre accessibles des résultats de recherche effectuée au CIRANO afin de susciter échanges et commentaires. Ces cahiers sont écrits dans le style des publications scientifiques. Les idées et les opinions émises sont sous l’unique responsabilité des auteurs et ne représentent pas nécessairement les positions du CIRANO ou de ses partenaires. This paper presents research carried out at CIRANO and aims at encouraging discussion and comment. The observations and viewpoints expressed are the sole responsibility of the authors. They do not necessarily represent positions of CIRANO or its partners.. ISSN 1198-8177. Partenaire financier.
(3) Global Security Policies Against Terrorism and the Free Riding Problem: An Experimental Approach* Nathalie Colombier †, David Masclet ‡, Daniel Mirza§, Claude Montmarquette** Résumé L’attentat qui a frappé le World Trade Center a fait la lumière sur l’urgence de mettre en œuvre des mesures préventives contre le terrorisme et d’améliorer la collaboration au sein du système de sécurité mondial en faisant intervenir tous les pays. Toutefois, on ne peut tenir la coordination internationale pour acquise car elle est souvent inefficace et risque d’échouer pour plusieurs raisons. L’échec de la coordination s’explique peut-être de façon plus marquée par le fait que les actions collectives contre le terrorisme sont susceptibles de souffrir d’un problème bien connu appelé resquillage (Sandler et Enders, 2004). Dans le présent document, nous examinons au moyen d’expériences le dilemme au sujet de la collaboration qui est posé par les politiques contre le terrorisme et nous tentons d’établir dans quelle mesure la politique internationale de dissuasion peut souffrir du phénomène de resquillage. Dans le cadre de notre jeu, les contributions au compte collectif ne visent pas à augmenter la production du bien public, mais plutôt à diminuer la probabilité qu’un événement stochastique détruise le bien en question. Un pays pourrait choisir de resquiller, soit en n’investissant pas dans la politique internationale de dissuasion, mais en utilisant plutôt toutes ses ressources pour sa protection nationale. Il pourrait aussi choisir d’ignorer totalement le terrorisme et d’investir dans certains autres projets. Nous nous penchons aussi sur l’influence qu’exercent les organismes qui permettent de sanctionner ou de récompenser les autres pays dans le but de faciliter la coordination en matière de politique de dissuasion. Nous constatons que, en l’absence d’encouragements institutionnels et une fois l’aversion à l’égard du risque maîtrisée, la plupart des pays font défection en investissant très peu dans les actions collectives contre le terrorisme et beaucoup dans leur propre protection. Par contre, l’introduction de mécanismes d’encouragement axés sur les punitions ou les récompenses améliore considérablement l’ampleur de la participation au compte collectif pour la sécurité. Mots clés : Structure des expériences, économie expérimentale, terrorisme, conflits, économie du secteur public *. We thank participants in seminars at the 2009 APET Meetings in Lyon, France for constructive and helpful comments. We are also thankful to Elven Priour and Nathalie Viennot for their able research assistance. Financial support from the Agence Nationale de Recherche (ANR) through the project “GTCI Guerre, terrorisme et commerce international” is gratefully acknowledged. † CREM (CNRS – Université de Rennes 1); 7, place Hoche, 35065 Rennes, France. Tel: +33 223 23 3335. Email: nathalie.colombier@univ-rennes1.fr ‡ CREM (CNRS – Université de Rennes 1) and CIRANO, 7, place Hoche, 35065 Rennes, France. Tel: +33 223 23 33 18. Email: david.masclet@univ-rennes1.fr § GERCIE-Université François Rabelais de Tours, 50, avenue Jean Portalis, 37000 Tours, France. Tel: +33 2 47 36 10 76. Email: daniel.mirza@univ-tours.fr ** ‡ CIRANO, 2020 University, 25e étage, Montréal, (Québec), Canada, H3A 2A5. Tel.: (514) 985-4001. Email: montmarc@cirano.qc.ca.
(4) Abstract. The World Trade Center attack has shed light on the urgent need to implement preventing measures against terrorism and to enhance cooperation in the global security system for all countries. However, international coordination cannot be taken for granted. It is often ineffective and likely to fail for several reasons. Perhaps the more prominent reason to explain failure in coordination is that collective actions against terrorism may suffer from the well known free riding problem (Sandler and Enders, 2004). In this paper we experimentally investigate cooperation dilemma in counterterrorism policies by measuring to what extent international deterrence policy may suffer from free riding. In our game, contributions to the group account do not aim to increase the production of the public good but instead seek to decrease the probability that a stochastic event destroys the good. A country could choose to free ride by investing nothing in the international deterrence policy and instead invest all its resources in its own national protection or even choose to ignore totally terrorism by investing on alternative projects. We also look at the effects of institutions that allow sanctioning and rewarding of other countries to facilitate coordination on deterrence policy. We find that, in absence of institutional incentives and after controlling for risk aversion, most of countries defect by investing very weakly in collective actions against terrorism while largely investing to protect themselves. In contrast, the introduction of punishment/reward incentive systems improves significantly the contribution level to the collective security account. Keywords: Design of experiments, experimental economics, terrorism, conflicts,public economics. Codes JEL : D72, C91.
(5) 1. Introduction. Terror actions are becoming increasingly global. Terrorism new face today is shaped by footloose terror organizations setting-up local cells, backed by logistical support from ‘headquarter’ type organizations, like Al-Qaeda or the Taliban.1 Interestingly enough, this international movement of terrormaking is found to be more taken place in developing countries than in rich countries. One possible reason is due to the relatively higher share of resources devoted to security for own protection in the North. The illustration of 9/11 events is remarkable in this respect. After September 11, the United States created the department of Homeland Security and increased dramatically the share of US budget devoted to security against terror from $15 billion in 2001 to about $32 billion in 2003 (Chaffin 2004). This increase in own protection by the US and more broadly by the North, might be displacing the problem of terrorism to the South, however. Due to lack of security resources, many developing countries like the Philippines, Indonesia or Pakistan are becoming highly attractive places for terrorist organizations where to be based and act. According to Sandler and Enders, (2004) “terrorists will naturally seek out the weakest link –the country with the least security – in planning their next attack”.2 Nevertheless, besides inward oriented protection the US has also joined some of its resources with other countries ones -mainly in North and Central America together with the European countries- to implement measures that are mutually protective. The heavily mediatized cooperation programs with the EU on the extension of the Container Security Initiative (CSI) to Europe together with the obligation of including biometric identifiers in European passports provide examples. Indeed, as terror threat becomes global, so are security measures. Global measures need global cooperation. The reason behind this is that is doubtful that a country alone can achieve full security by itself, as the risk it faces also depends on the actions taken by others. It is increasingly recognized that even the best national policy is generally inefficient in absence of an international coordination with our allies. Collaborative actions and sharing of information have thus become key fundamental elements in a globalized world in order to protect its territory against terrorism. However, international coordination cannot be taken for granted. It is often ineffective and likely to fail for several reasons. The countries’ interests may be divergent, which would make more difficult to find an agreement on a collective approach to fight terrorism. For example, governments may disagree on who are the terrorists and on the means to stop their actions. Some governments may be reluctant to sacrifice their autonomy over security matters. Another reason relies on the idea that perception of risk may differ among countries and countries have different attitudes toward risk. Less risk averse countries may have less incentives to agree on a collective security policy. Finally, some countries may choose not to join a coalition against terrorism for political or economic strategic reasons. Among all these reasons, perhaps the more prominent reason to explain failure in coordination, is that collective actions against terrorism may suffer from the well known free riding problem (Sandler, 2003; Sandler 1. See for instance Steinberg (2008), Steinberg and Werenfels (2007) and more analytically Desousa, Mirza and Verdier (2009) on terrorism networks and globalization of terrorism. 2 Some countries may be also incited not to engage in international anti terrorism policies in order to avoid (reduce) the risk of being a potential target of a future terrorist attack by adopting a complacent attitude toward terrorists.. 1.
(6) and Enders, 2004). As pointed out by several authors, global security policies may be perceived as an international Globlal Public Good (GPG) characterized by an incentive for countries to defect by investing in alternative projects (for example, education, social security, etc.) while profiting from the protection policy implemented by others (Sandler and Enders, 2004).3 Alternatively, the countries may also choose to invest in their own national protection, which would reduce the conditional probability of being hit in case of a future attack while profiting from an international protection policy implemented by other countries. By investing in their own protection, the countries will be better protected from a terrorist attack avoiding to appear as the weakest links. Counterterrorism policies have been extensively investigated in the traditional literature on the economics of terrorism studies (see Enders and Sandler, 2006, chapters 4-6 for a detailed analysis and survey).4 Sandler and Enders (2004) showed the necessity for the governments to join their forces to reach collective actions against terrorism. The authors also pointed out the circumstances that impede cooperation between governments. In particular Sandler and Enders shed light on the existence of a cooperation dilemma in the context of international cooperation against terrorism. Enders and Sandler (2006) distinguish between defensive and proactive policies against terror. While defensive policies in one country happen to displace terrorism to others, thus providing negative international externalities, proactive security measures like freezing assets and military sustained operations against terrorists presumed headquarters are usually viewed to be international public goods from which all countries can benefit.5 Proactive security measures might be undertaken by one or a few countries, but in the case of terrorist networks which span over many countries, the measures become more efficient when they are undertaken globally. On the empirical side, using time series analysis, Enders, Sandler and Cauley (1990) investigate the effectiveness of international conventions/treaties related to the control and prevention of international terrorism. They found no evidence that international conventions/treaties have had a statistically significant impact on explaining crimes against diplomats and skyjackings. The reason why these international cooperation measures fail to reduce terror is that they do not possess an enforcement mechanism and many countries simply do not have the capacities to comply because of lack of resources.. 3 For illustration, Sandler (2003) uses a simple 2 × 2 game representation in which two players – the United States (US) and the European Union (EU) – must jointly decide efforts allocated toward counterterrorist policies. This is a pure public good because the benefits achieved from counterterrorism depend on the countries’ cumulative efforts. Counterterrorism actions reduce the probability of any subsequent terrorist attack for both players. However from each country’s viewpoint, there is a dominant strategy not to act. 4 Several theoretical studies examined the determinants of terrorism and how it spreads as a contagion phenomenon (Midlarsky, 1970, 1978; Midlarsky, Crenshaw and Yoshida, 1980; Hamilton and Hamilton, 1983). Other studies investigated the question to what extent it’s worth negotiating with terrorists in cases of hostage-taking situations (Scott, 1993, Sandler and Enders, 2004). These studies rely on the idea that terrorism can be modelized as a negotiation game between the terrorists and the governments (Sandler et al. 1983). Frey and Luechinger (2004) investigated the importance of decentralizing activities as a way to reduce the impact of terrorism as the decentralization of activities may be an optimal way to reduce the costs of a terrorist attack because several different centres are more difficult to destabilise than a unique strategic centre. 5 That being said, proactive policies might also be associated with costs (new terrorists attacks) if these result in freedom losses and provide anger among potential terrorists (Rosendorff and Sandler, 2005).. 2.
(7) In this paper we use a laboratory experiment to investigate cooperation dilemma in ccounterterrorism policies. To do so, following Sandler (2003) and Sandler and Enders, (2004), we first model international security as a public good to which every country endowed with constrained resources has to decide how much of its national resources to invest in international collective actions in order to reduce expected losses from a terrorist attack. In our game, a country could choose to free ride by investing nothing in the international deterrence policy and instead could invest all its resources in its own national protection through a private “insurance” good (i.e. defends its own territory and nothing else). By doing so, the country displaces terror to other countries which have chosen to invest less in their own protection. A country can also choose to ignore totally terrorism by investing on other alternative projects (for example education, health policy, social security, etc.). Although these games are stylized and simple, they illustrate a number of important features of international actions to deter terrorism. We then provide empirical evidence of free riding problem in counterterrorism policies by conducting a controlled laboratory experiment. Testing models dealing with governments’counterterrorism efforts by using laboratory methodology that involves small number of players performing abstract tasks and interacting with one another for finite repeated number of periods, might be met with some skepticism. Of course many economic and political factors other than security drive terrorism. Furthermore counterterrorism may have several macroeconomic implications, which might be regarded as a critical issue to investigate such phenomena using small-scale laboratory evidence. In this paper we are not interested in reproducing real-world terrorism activity per se. Instead we focus on explicit micro-foundations of counterterrorism policies by studying how individual agents invest to reduce the probability of losses, and/or how they change their behavior after a loss, which can be directly tested in the laboratory. Precisely we highlight two particular features of counterterrorism : (1) the fact that global security is a public good by itself and (2) the fact that alternative private protection policies displace terror activities to less secure countries. The laboratory has the advantage of measuring microeconomic causal relationships in a controlled environment (e.g. the political, social and religious context), defining a priori the reference group, rather than having to infer it from survey data, and of avoiding any possible role for contextual effects, which allows achieving a high degree of internal validity.6 Two sets of questions are addressed in this paper. First, we seek to investigate the general conditions for countries to be incited to cooperate to an international security policy. Precisely, we investigate the factors that might influence cooperation including perception of risk. The second aim of this paper has a more normative flavour. We explore here the ability of different kind of institutions to facilitate 6. Several authors have highlighted the existence of a trade-off between internal and external validity. While internal validity generally requires abstraction and simplification, this is generally made at the cost of a decreasing external validity. The tradition of modeling in economics relies strongly on internal validity. According to Plott, “Experimental economics’ revolutionary achievement consisted of shifting the focus from whether a certain experiment reproduces a real-world system accurately to whether it accurately tests a theory or model.[…] Once models became the focus of research the simplicity of an experiment and perhaps even the absence of features of more complicated economies became an asset. The experiment should be judged by the lessons it teachs about the theory and not by its similarity what nature might have happened to have created” (Plott, 1991, p906). The way our experiment is designed is perfectly in line with this tradition since it does not seek to reproduce a real world situation but rather aims at testing micro-foundations of counter-terrorism.. 3.
(8) cooperation in such collective actions. Precisely we set two types of institutions that could facilitate cooperation: one which uses reprisals in case of non-cooperating behaviours and one which allows for rewards in case of cooperation. Reprisals would be used against countries that defect by not entering the international coalition and that may be perceived to some extent complaisant toward terrorists. These sanctions can include reductions of commercial ties or trade embargo.7 The second institutional policy relies on the use of rewards including for example monetary transfers, development and assistant aid toward countries that choose to cooperate against international terrorism. We then ask which of these institutions is the more efficient and induces the best incentive to contribute to the collective antiterrorist policy. Our experiment consists of three treatments. In a first treatment called baseline treatment, countries have to choose between investing in an international collective action, investing for their own national protection or investing in alternative policies not directly associated with security. The total amount of tokens invested in the collective action by all countries reduces the probability of an international attack. The tokens invested in the national protection reduce one probability of being hit conditional to the fact that a terrorist attack occurs. For each country, this conditional probability depends on the amount invested for its protection relatively to the amount invested by the others. If all countries invest nothing or exactly the same amount for national protection, this conditional probability is the same for all countries. Finally, investing in an alternative policy outside the security issue does not change the probability of an attack. The second treatment called sanction treatment is identical to the previous one, except that after being informed about the individual contribution level of each other country, a country has the opportunity to assign costly points of punishment. The third treatment, called the reward treatment, is similar to the punishment treatment except that each country can assign costly reward points that improve the payoffs of those who receive them. Our experimental design has the flavour of a public good to be financed by voluntary contributions (e.g. Davis and Holt, 1993). However it differs substantially from a standard VCM experiment in that contributions to the group account do not aim to increase the production of the public good but instead seek to decrease the probability that a stochastic event destroys the good. In the same vein, Dickinson (1998) introduced risk into the production of the public good and compared a situation where the risk is exogenously determined and a situation where the risk decreases with the contribution level. His findings indicate that the introduction of risk into the production of a public good has a weakly negative effect on voluntary contributions. Our paper is also related to Keser and Montmarquette (2008) who examine voluntary private contributions to reduce the probability of a public loss in the context of an experimental study. The authors find that subjects make positive contributions although the contribution level is lower than in the typical experiments on voluntary contributions to fund public goods. Another interesting result from this study is that the occurrence of a loss decreases the aggregate contribution level. Our paper also relates to Hess Holt and Smith (2007) that investigated how subjects can coordinate investments in order to reduce the probability of losses of a terrorist attack in the context of coordination games. The main finding of this study is that coordination can 7. Sanctions can also take on symbolic forms. For example, the fries in the Congress cafeteria were renamed ''freedom fries'' as a retaliation against France's refusal to enter coalition against terrorism and to support U.S. proposals in the UN Security Council for military action to invade Iraq.. 4.
(9) be enhanced if players are allowed to decide sequentially instead of choosing simultaneously. Our study brings several important innovations to these previous experiments. First, the issue of counterterrorism policies in a VCM setting has, to our knowledge, not been previously studied experimentally. Second, we investigate in more detail the determinants of failure in coordination in global security policy. Third, we seek to explore the ability of sanctioning and rewarding mechanisms of institutions to facilitate cooperation in collective actions against terrorism. To some extent our study is in line with previous experiments inspired by Fehr and Gaechter, 2000 that investigated the effects of sanction and/or rewards in VCM contexts (Fehr and Gächter's, 2000; Dickinson, 2001; Fehr and Rockenbach , 2003 Masclet et al., 2003; Egas and Riedl, 2005; Bochet, Page, and Putterman, 2006; Sefton et al., 2007; Carpenter, 2007; Houser et al. 2008). Sefton et al. (2007) investigated the combined use of rewards and punishments in repeated linear public goods games. They find that introducing these institutions results in higher contributions to the public good. The authors also observe that sanctions are more effective than punishment. In a different context, a two-person proposer-responder game, Andreoni et al. (2003) find similar results, showing that rewards are much less effective than sanctions while the combination of both reward and punishment has a very strong effect on cooperation. To anticipate our results, our experiment replicates remarkably many predictions from previous theoretical study done by Sandler and Enders, (2004). We find that, in absence of institutional incentives and after controlling for risk aversion, most of countries defect by investing very weakly in collective actions against terrorism while largely investing to protect themselves. The introduction of punishment/reward incentive systems improves significantly the contribution level to the collective security account, however. These results are consistent with previous results on VCM with reward and/or sanction mechanisms. Nevertheless, and in contrast to previous studies, we find that in a deterrence policy context rewards seem to be more effective than punishments in deterring free riding and improving social welfare. The remainder of the paper is organized as follows. Section 2 details our experimental design and presents the theoretical predictions of the model. The results of the study are presented in section 3. Section 4 presents our concluding remarks. 2. Experimental design 2.1 The game Let’s consider n players, endowed with an initial wealth W in UME and facing a potential external shock that could destroy a large part of their wealth. At each period, the participants receive d UME. The players have then the possibility to distribute this amount across three different types of investments: an investment to contribute to the international public good which aims at reducing the probability of occurrence of an act, one which insures better national protection against a terrorist act that eventually occurs (ie. private protection), and finally, an investment in an alternative program. The following equation captures the decisional process: ⎞ a ⎤ ⎡1 1 ⎛ ∑Y ⎜ Yi − ⎥.⎢ − ⎜ n ⎠ nd ⎦⎥ ⎣⎢ n nd ⎝. ⎞⎤ (1) ⎟⎟ ⎥ .c i≠ j ⎝ ⎠ ⎦⎥ ⎣⎢ The first term (d-X-Y) expresses the investment that is left out for alternative programs after investments in the private and public protection. X and Y are the amounts ⎡. ⎛. (d − X − Y ) − ⎢ p *− ⎜ Xi + ∑ X j ⎟. 5.
(10) respectively invested by a participant in the international counterterrorism action and for national protection. Y can be seen as a private insurance good. The second term expresses the ex-post probability of occurrence of an act. p* is the probability of occurrence of an international attack anywhere in the world if no one invests in international protection. If all participants invest all their tokens d in X, this probability is reduced by a. Otherwise, it is reduced by a times the total share of investing in the public good ( X i + ∑ X j ) / nd . i≠ j. The last term between brackets presents the relative (ex-post) probability of a participant (representing a country) to be hit if an international attack occurs. For each participant, this conditional probability depends on the amount Y invested for the national protection relatively to the amount invested by the others. If all participants invest nothing in Y or exactly the same amount, the conditional probability of being 1 for all. This conditional probability is reduced (increased) by a given factor hit is n for the participant investing more (less) than the mean investment in Y. 8 Finally c is the cost of being hit. In our experiment W is set to 6000 UME and n = 4, d = 20, p* = 0.7, a = 0.16, c = 600.9 Participants play 40 periods of this game under a partner matching protocol.. 2.2. Theoretical predictions and behavioural assumptions 2.2.1. Theoretical predictions In this section we derive predictions from our experimental treatments under the assumptions of common knowledge of rationality, risk neutrality and selfishness. For the three treatments the theoretical prediction is straightforward: for the parameters presented above, if the game consisted of one period, the Pareto solution is for all participants to invest all their tokens in the international public good X. By backward induction, the dominant strategy is for a participant to invest all his tokens in insurance Y (see mathematical proofs in appendix). The same reasoning holds for all of the 40 periods by applying a backward induction mechanism since it is common knowledge for the subjects that the experiment lasts for a finite number of periods. Assuming common knowledge of rationality and selfishness the opportunity to sanction or reward should not affect the theoretical predictions of the game since both reward and sanction decisions are costly. In the only subgame perfect equilibrium of the game, whether it is played using punishment or reward institution, is for all. 8. Assume si = Y / d to represent the share of investment in Y for each participant. Then, a more. rigorous way to understand the last term of the equation is that it can be alternatively expressed in the following manner: (1 / n)[1 − ( si − s )].c where s represents the average investment share across n participants. Here, our expression tells that the (ex-ante) conditional probability of being hit (1/n) is multiplied by a rate that is decreasing with the participants’ relative effort of investing in national protection X compared to the average. 9 Following a report by CNN (June 22nd, 2005), the chance of an attack with a weapon of mass destruction somewhere in the world in the next ten years runs as high as 70%, arms experts have predicted in a United States survey. According to the report, four out of five people said that their country was not spending enough on non-proliferation efforts to detect transfer of weapons or materials to terrorism organizations.. 6.
(11) players to invest all their endowment in Y and to never punish (reward). This is stated precisely in H0. H0 (Pure Self-Interest and Profit Maximizing). Assuming common knowledge of rationality and selfishness all participants will never invest in the group account (global security) and choose to invest in their own personal security (Y). The opportunity to reward/sanction other group members should not affect the theoretical predictions of the game.. 2.2.2. Behavioural assumptions Several studies have shown that many people are reciprocally motivated and sacrifice a part of their payoffs in order to punish bad intentions or reward kind actions (for modeling of reciprocity see Rabin, 1993; Charness and Rabin, 2002; Falk and Fischbacher, 2006; Dufwenberg and Kirchsteiger, 2004).10 In the absence of punishment (reward) opportunities, the only way to reciprocate in a VCM is for the player to reduce her own contribution to the group account (See Keser and van Winder, 2002). In contrast introducing institutions that allow sanctioning and rewarding of others should provide a direct way for reciprocally motivated people to reciprocate without changing their own contribution level. For this reason one should expect higher contribution to the group account in the treatments with institutions that allow direct way to deter free riding.11 One might thus relax some of the above assumptions and assume that in addition to the purely selfish subjects there may be also a fraction of the players who are reciprocators. In addition to reciprocity, repeated interactions may also give rise to the possibility of reputation effects. Indeed selfish participants may also have incentives to imitate the reciprocal players by punishing (rewarding) free riders (cooperators) because they can also benefit till the n-1 period from an increase of contribution from all members. The intuition is that participants have incentive to build up a reputation as reciprocal players because they anticipate that other players will condition their contribution on expectation of sanction (reward). As a consequence, cooperation in the global security policy should be higher in the sanction and reward treatments than in the baseline 10. Reciprocal behaviour was reported in different experimental games. For example, Berg, Dickhaut and McCabe (1995) observe reciprocal decisions in the context of investment game; Gächter and Falk, (2002) in a gift exchange game; Clark and Sefton (2001) in a sequential prisoner’s dilemma; Abbink, Irlenbusch and Renner (2000) in the “moonlighting game”., Keser and van Winden (2000) Fehr and Gaechter (2000) Croson (2007) observe that some subjects reciprocate others’ contribution to a public good. 11 Note that it is nearly impossible to obtain precise and quantitative theoretical predictions based on the assumptions presented above. The first reason is that it may be the case that there are some reciprocal people whose preferences are not completely captured by those induced in the experiment or involve players with bounded rationality (Gächter and Falk, 2002; Selten, 1978; Selten and Stoecker, 1986). Second models including reciprocity and reputation usually rely on the condition that a fraction of reciprocal subjects is necessary to allow the emergence of reputation for the majority of rational and selfish players. However these conditions are not necessarily met since depending on the parameters of the experiment the fraction of reciprocal subjects may be quite high. Finally reputation mechanisms generally rely on the assumption that agents enter the experiment with initial belief about the fraction of reciprocal players and update their beliefs over time. However such learning effects make it again more difficult to predict the expected outcome since it should change over time as soon as agents update their beliefs. For all these reasons, only some qualitative conjectures are possible.. 7.
(12) treatment. The alternative conjecture to H0 assuming that there may be a fraction of reciprocal agents is stated precisely in H1. H1(Reciprocity and Reputation) the opportunity to reward and sanction other group members may provide a direct way for people who are reciprocally motivated to reciprocate, which should improve cooperation. In our experimental design participants are not allowed to observe individual reward (sanction) decisions, which should prevent revenge effects. However we cannot rule out the possibility of blind revenge (blind reward) and that such blind decisions may affect current punishment (reward) decisions. Furthermore our design cannot rule out the possibility that some sanction (reward) decisions may be conditional on players’ expectations about the decisions by the other group members (Zizzo, 2003). Such effect may be exacerbated in the reward treatment where a subject may have strong incentives to reward someone else if she expects reward from this other participants since reward induce a significant increase in outcome compared to its cost. H2: Both reward and punishing decisions may induce reciprocal behaviours on the rewarding (punishing) decisions, even in absence of possibility to identify precisely the punisher (rewarder). Due to the positive externalities generated by the rewarding mechanism, one might expect that such effects may be higher in the reward treatment. One can also relax risk neutrality assumption. Most risk lover countries should prefer investing in z rather than investing in security. Additionally, perception of risk may also affect individual decisions. In particular, one might argue that having experienced a terrorist attack in the past may influence perceptions of risk of future attacks, which is obviously theoretically incorrect since past events do not change the probability that similar event will occur in the future. For example, after September 11, 2001, terrorism has changed risk perceptions, favouring the idea that anything can happen at any time (e.g Bosman and van Winden, 2005). One reason is that people’s attention may be focussed mainly on the bad outcome itself and neglect the fact that such event is very unlikely to occur. This effect is generally termed “probability neglect” effect. The idea is that, “when intense emotions are engaged, people tend to focus on the adverse outcome, not on its likelihood,” which may lead to significant distortions in both private and public policy” (Sunstein, 2002 p.61). Moreover people may feel a disproportionate fear of risks when risks is hard to control (Slovic, 2000; Sunstein, 2002). Finally, the occurrence of a terrorist attack may also induce an opposite effect, by inciting people to underestimate future terrorist attacks. This effect, generally termed “Gambler fallacy” or “Monte Carlo fallacy”, relies on the idea that a certain random event is less likely to happen following an event or a series of events, which is obviously incorrect since past events do not change the probability that similar event will occur in the future. According to Tversky and Kahneman gambler's fallacy may be induced by a psychological heuristic.12 This is stated in H3. H3: Risk may influence decisions in several ways. First it may influence investments on z since the more risk lover countries should opt for alternative policies rather than 12. The intuition behind Gambler Fallacy is that people may expect that deviations from average should balance out. For example, if a fair coin is tossed repeatedly and tails comes up a larger number of times than is expected, a gambler may incorrectly believe that this means that heads is more likely in future tosses. Such an event is often referred to as being "due.. 8.
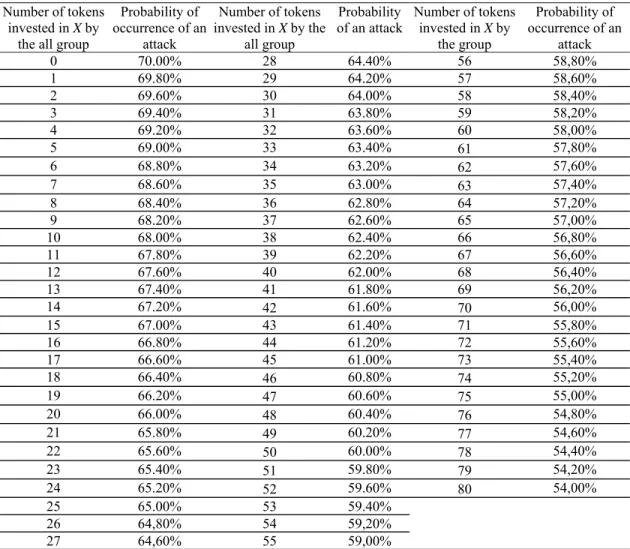
(13) investing in security. Second, previous terrorist attacks may also influence perceptions of risk and therefore influence current decisions. Note however that the global effect of perception of risk is indeterminate, leaving it to empirical analysis to identify links between investment decisions and risk perception.. 2.3. Treatments For all treatments, the participants were given two Tables. A first Table (see Table 1a) gives the probability of an international attack for each total amount of tokens invested in X by all the participants. The second Table (see Table 1b) gives the conditional probability that a specific participant will be hit if an attack occurs according to her/his investment in the private ¨insurance¨ good, Y, aimed essentially to protect herself, and the contributions of the others members of his group. A participant investing more in Y (less) than the average of the other members of the group reduces (increases) her probability of being hit. The probability of being hit conditional on an attack occurring is equal for all the members if all the individuals invest exactly the same amount on Y.. Table 1a. Probability of occurrence of an attack for each number of tokens invested in X by the group Number of tokens Probability of Number of tokens Probability Number of tokens Probability of invested in X by occurrence of an invested in X by the of an attack invested in X by occurrence of an attack the group all group attack the all group 0 70.00% 28 64.40% 56 58,80% 1 69.80% 29 64.20% 57 58,60% 2 69.60% 30 64.00% 58 58,40% 3 69.40% 31 63.80% 59 58,20% 4 69.20% 32 63.60% 60 58,00% 5 69.00% 33 63.40% 57,80% 61 6 68.80% 34 63.20% 57,60% 62 7 68.60% 35 63.00% 57,40% 63 8 68.40% 36 62.80% 64 57,20% 9 68.20% 37 62.60% 65 57,00% 10 68.00% 38 62.40% 66 56,80% 11 67.80% 39 62.20% 67 56,60% 12 67.60% 40 62.00% 68 56,40% 13 67.40% 41 61.80% 69 56,20% 14 67.20% 61.60% 56,00% 42 70 15 67.00% 43 61.40% 71 55,80% 16 66.80% 44 61.20% 72 55,60% 17 66.60% 45 61.00% 73 55,40% 18 66.40% 60.80% 55,20% 46 74 19 66.20% 60.60% 55,00% 47 75 20 66.00% 60.40% 54,80% 48 76 21 65.80% 60.20% 54,60% 49 77 22 65.60% 60.00% 54,40% 50 78 23 65.40% 59.80% 54,20% 51 79 24 65.20% 59.60% 54,00% 52 80 25 65.00% 53 59.40% 26 64,80% 54 59,20% 27 64,60% 55 59,00%. 9.
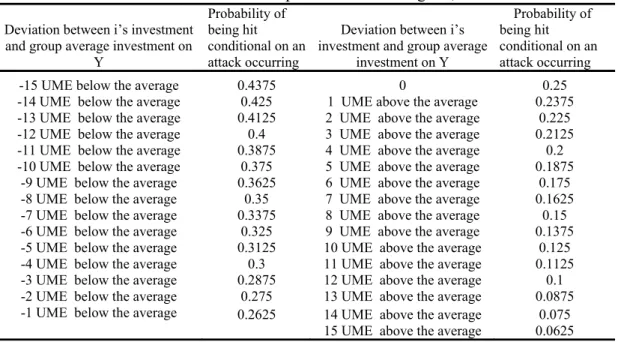
(14) Table 1b. The probability of being hit conditional on an attack occurring according to his investment in the private ¨insurance¨ good, Y Deviation between i’s investment and group average investment on Y -15 UME below the average -14 UME below the average -13 UME below the average -12 UME below the average -11 UME below the average -10 UME below the average -9 UME below the average -8 UME below the average -7 UME below the average -6 UME below the average -5 UME below the average -4 UME below the average -3 UME below the average -2 UME below the average -1 UME below the average. Probability of Probability of being hit Deviation between i’s being hit conditional on an investment and group average conditional on an attack occurring investment on Y attack occurring 0.4375 0.425 0.4125 0.4 0.3875 0.375 0.3625 0.35 0.3375 0.325 0.3125 0.3 0.2875 0.275 0.2625. 0 1 UME above the average 2 UME above the average 3 UME above the average 4 UME above the average 5 UME above the average 6 UME above the average 7 UME above the average 8 UME above the average 9 UME above the average 10 UME above the average 11 UME above the average 12 UME above the average 13 UME above the average 14 UME above the average 15 UME above the average. 0.25 0.2375 0.225 0.2125 0.2 0.1875 0.175 0.1625 0.15 0.1375 0.125 0.1125 0.1 0.0875 0.075 0.0625. The baseline treatment is the one just described above. At the end of each period, the realisation or not of a loss 600 UME is drawn at random following the number of UME invested on X by the group (Table 1a). If a terrorist attack occurs, the probability that a specific individual being hit is drawn at random following the idiosyncratic probability based on the elements of Table 1b. The gain for each participant at the end of each period of play is determined by his initial endowment of 6000 UME at the beginning of the game adjusted at each period by an amount of 20 UME minus the amounts invested on X and Y and minus the loss of 600 UME if the unfavourable event touches the individual. The final gain corresponds to the endowment of 6000 UME adjusted for the gains or losses at each period. In the second treatment, called the sanction treatment, we add a second stage in which, each subject, after being informed about each other group member's contribution, can assign 0 to 10 punishment points to any of the other three group members. The last treatment called “reward” treatment is identical to the previous treatment except that assigning points of reward increase the earning of the participants who receive these points. In both reward and sanction treatment, assigning points is costly. The schedule of costs is given in Tables 2a and 2b for the sanction and reward treatments, respectively.13. 13. In contrast to Andreoni et al. (2002), in Sefton et al. (2007) and Walker and Halloran (2004) the cost of a $1 cent (sanction) reward is $1. Note however that as noted by Andreoni et al. (2003) one can find several examples where the cost versus consequence of sanctions and punishment is not one-for-one. For example the cost of imposing a trade embargo is likely to be much smaller than the consequences for the target. Similarly the cost of development assistance and other financial transfers toward less developed countries may be smaller that the benefit for the developing country. For these reasons we chose a cost-consequence ratio superior to 1.. 10.
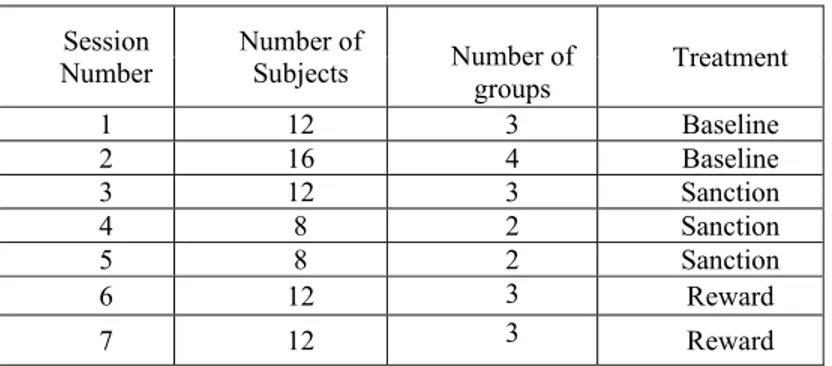
(15) Table 2a. Levels of punishment and associated costs to the punisher Punishment Points Cost to the punisher in units Cost to the target in units. 0 0 0. 1 5 20. 2 10 40. 3 15 60. 4 30 120. 5 45 180. 6 60 240. 7 90 360. 8 100 400. 9 125 500. 10 150 600. Table 2b. Levels of reward and associated costs to the rewarder Reward Points Cost to the rewarder in units Reward to the target in units. 0 0 0. 1 5 20. 2 10 40. 3 15 60. 4 30 120. 5 45 180. 6 60 240. 7 90 360. 8 100 400. 9 125 500. 10 150 600. For these last two treatments, the Pareto solution and the dominant strategy remain the same as in the baseline treatment.. 2.4. Procedures Common to All Treatments The experiment consisted of seven sessions. In each session, there were 40 periods of interaction. All of the sessions were conducted at the Center for Research in Economics and Management (CREM), at the University Rennes I, Rennes, France. Between 8 and 16 subjects participated in each session. 80 subjects were recruited from undergraduate courses in business and economics at the university. None of the subjects had participated in an economic experiment previously. No subject participated in more than one session. On average, a session lasted 100 minutes including initial instruction and payment of subjects. The experiment was computerized using the Ztree program developed at the University of Zurich.14 Table 3 contains some summary information about each of the sessions. The first column indicates the session number. The second through fourth columns indicate the number of subjects that took part in the session, the number of four-person groups in the session, and the treatment in effect.. Table 3: Characteristics of the Experimental Sessions Session Number. Number of Subjects. 1 2 3 4 5 6. 12 16 12 8 8 12. 7. 12. Number of groups 3 4 3 2 2 3 3. Treatment Baseline Baseline Sanction Sanction Sanction Reward Reward. A partner matching protocol was in effect for all sessions. The computer network separated the subjects taking part in a session into groups of size four. Group assignments remained fixed for the entire session and the members of a group 14. See Fischbacher (2007) for a description of the ztree computer program.. 11.
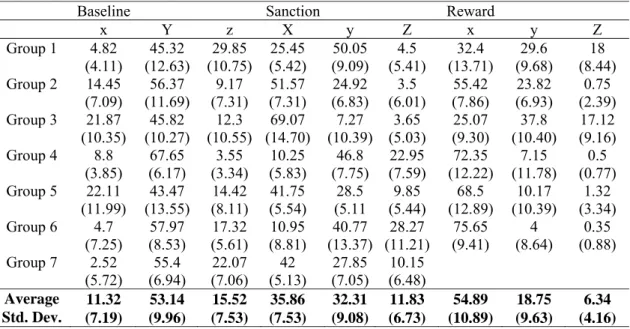
(16) interacted exclusively with their own group members for the entire session. Individuals received no information about the activity of any groups other than their own. There were 40 periods of play in each session. At the beginning of the experiment, the instructions were distributed and read to the subjects. There followed a quiz, consisting of several questions concerning the rules of the game and how earnings are determined, which all subjects were required to answer. The experimenter then announced and explained the correct responses. Subjects could indicate whether they had any questions about the process and the experimenter would answer them in private. At the end of each session, subjects were asked to fill an individual questionnaire. We also asked them to play a simple lottery choice experiment to determine their degree of risk aversion. This simple game replicates Holt and Laury (2002)’s design with real payoffs. Precisely, subjects were confronted with ten choices between two lotteries, one "risky" (with payoffs of €3.85 and €0.1) and one "safe" (with payoffs of €2 and €1.6), with probabilities ranging from 10% to 100%. As noted by Holt and Laury, the payoffs for the safe lottery (Option A) are less variable than those for the risky lottery (Option B). In both options the probabilities for the first of the ten sequential decisions are 10% for the high payoff and 90% for the low payoff. The difference in the expected payoffs between the two lotteries is such that only an extreme risk-seeker would choose Option B. As the probability of the high payoff outcome increases B becomes more attractive relative to A, and at some point subjects will switch their preference. Towards the end of the decision sequence even the most risk averse subjects should switch over to option B.. 3. Results 3.1. Determinants of investments in protection in absence of institution This section investigates the determinants of investment in the baseline treatment. Figure 1 illustrates the time path of average group contribution in X by period in each treatment. The period number is shown on the horizontal axis and the average group contribution on the vertical axis. The maximum possible group contribution, corresponding to the group optimum, is 80. The minimum possible contribution is 0. The average contribution in X, Y and Z for each group of the different treatment are also shown in Table 4, with the standard deviations given in parentheses.. 12.
(17) 80. Figure 1. Evolution of average group investment in X per treatment. BASELINE. Average group investment in X. 70 60 50 40 30 20 10 0. SANCTION REWARD. 1. 3. 5. 7. 9 11 13 15 17 19 21 23 25 27 29 31 33 35 37 39. 80. 80. 70. 70. Average group invetsment in X. Average group investment in X. Periods. 60 50 40 30 20 10. groupe 1. groupe 2. groupe 3. groupe5. groupe6. groupe 7. groupe4. 60 50 40 30 20 10. 0. 0 1. 3. 5. 7. 9 11 13 15 17 19 21 23 25 27 29 31 33 35 37 39. 1. 3. 5. 7. 9. 11 13 15 17 19 21 23 25 27 29 31 33 35 37 39. Periods groupe 8 groupe11 groupe14. groupe9 group12. Periods groupe 10 groupe 13. group 15. group 16. group 17 . group 18 . group 19. group 20. Table 4: Average Group Investment Levels on X, Y and Z per Treatment (max = 80, min = 0) Baseline x Group 1 4.82 (4.11) Group 2 14.45 (7.09) Group 3 21.87 (10.35) Group 4 8.8 (3.85) Group 5 22.11 (11.99) Group 6 4.7 (7.25) Group 7 2.52 (5.72) Average 11.32 Std. Dev. (7.19). Y 45.32 (12.63) 56.37 (11.69) 45.82 (10.27) 67.65 (6.17) 43.47 (13.55) 57.97 (8.53) 55.4 (6.94) 53.14 (9.96). Sanction z X 29.85 25.45 (10.75) (5.42) 9.17 51.57 (7.31) (7.31) 12.3 69.07 (10.55) (14.70) 3.55 10.25 (3.34) (5.83) 14.42 41.75 (8.11) (5.54) 17.32 10.95 (5.61) (8.81) 22.07 42 (7.06) (5.13) 15.52 35.86 (7.53) (7.53). 13. y Z 50.05 4.5 (9.09) (5.41) 24.92 3.5 (6.83) (6.01) 7.27 3.65 (10.39) (5.03) 46.8 22.95 (7.75) (7.59) 28.5 9.85 (5.11 (5.44) 40.77 28.27 (13.37) (11.21) 27.85 10.15 (7.05) (6.48) 32.31 11.83 (9.08) (6.73). Reward x 32.4 (13.71) 55.42 (7.86) 25.07 (9.30) 72.35 (12.22) 68.5 (12.89) 75.65 (9.41). y 29.6 (9.68) 23.82 (6.93) 37.8 (10.40) 7.15 (11.78) 10.17 (10.39) 4 (8.64). Z 18 (8.44) 0.75 (2.39) 17.12 (9.16) 0.5 (0.77) 1.32 (3.34) 0.35 (0.88). 54.89 (10.89). 18.75 (9.63). 6.34 (4.16).
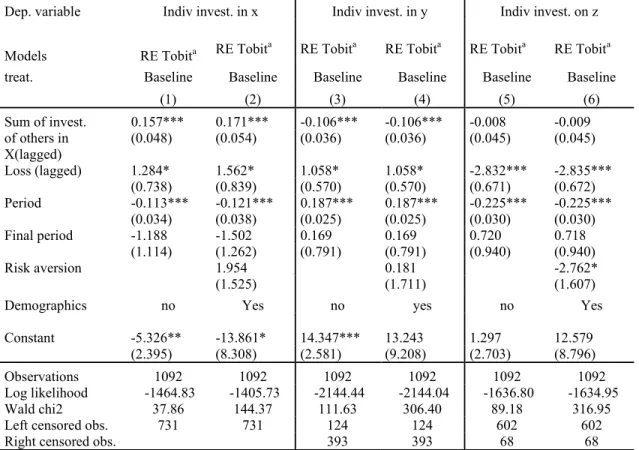
(18) Both Table 4 and Figure 1 show that, in the baseline treatment, subjects contribute very low level of their initial endowment to the group account X (11.32%). Figure 1 shows that the average contribution level declines over time in the baseline treatment to reach a very low level of contribution at the end of the game. This result is in line with a number of other experiments, which have documented that contributions in classical VCM tend to decline with repetition (Isaac et al. 1984, Isaac and Walker, 1988, Andreoni, 1988). These results clearly indicate that, in absence of institutional incentives, people choose to defect and adopt an opportunist behavior by protecting themselves or investing in alternative policies instead of contributing to a collective protection that would be more optimal to reduce the probability of an attack. Our observations regarding contribution levels in the baseline treatment are described as result 1 below.. Result 1: In absence of external institutional incentives, people fail to coordinate on a collective protection policy and choose to defect by investing in their own security (i.e. Y). Furthermore only the most risk loving participants choose to invest in z. Support for result 1. To further explore the determinants of investments in X, Y and Z, we estimate the determinants of investment via random effects Tobit models. The use of Random Effect Tobit models is justified by the panel dimension of our data and the number of censored observations in the sample. Table 5 contains the estimates from the following regression model: Invest i , t = β 0 + β 1 ∑. n −1 j =1; j ≠ i. Invest − i ;t −1 + β 2 Loss t −1 β 3 t + β 4 finalt + β 5W. The dependent variable “investit” is player i’s investment in period t in X, Y and Z, respectively from the left to the right part of Table 5. Column (1) reports estimates on the determinants of investment to the group account x. The independent variables include several dummy variables that are expected to be relevant. The variable “Loss in t-1” takes the value 1 if the individual has been hit by an attack in t-1 and 0 otherwise. This variable seeks to capture how previous attacks might affect current decisions. The variable “Final period” takes the value 1 for the last period of the game and 0 otherwise. The independent variable “Sum investments of others in period t-1” takes the value of total contribution of the group to the group account in previous period. The second econometric specification controls the previous results with the addition of demographic variables including gender, education and risk aversion. In our experiment degree of risk aversion was captured by the total number of “safe” lottery choices made by participants in the lottery choice experiment. Precisely participants are risk averse when they choose at least five times lottery A before switching to B.. 14.
(19) Table 5: Determinants of Investments in X, Y and Z in the Baseline treatment Dep. variable Models treat.. Indiv invest. in x RE Tobita Baseline (1). Sum of invest. of others in X(lagged) Loss (lagged) Period Final period. Constant Observations Log likelihood Wald chi2 Left censored obs. Right censored obs.. RE Tobita. Baseline. Baseline. (2). (3). RE Tobita Baseline (4). Indiv invest. on z RE Tobita Baseline (5). RE Tobita Baseline (6). 0.157*** (0.048). 0.171*** (0.054). -0.106*** (0.036). -0.106*** (0.036). -0.008 (0.045). -0.009 (0.045). 1.284* (0.738) -0.113*** (0.034) -1.188 (1.114). 1.562* (0.839) -0.121*** (0.038) -1.502 (1.262) 1.954 (1.525). 1.058* (0.570) 0.187*** (0.025) 0.169 (0.791). 1.058* (0.570) 0.187*** (0.025) 0.169 (0.791) 0.181 (1.711). -2.832*** (0.671) -0.225*** (0.030) 0.720 (0.940). -2.835*** (0.672) -0.225*** (0.030) 0.718 (0.940) -2.762* (1.607). Risk aversion Demographics. RE Tobita. Indiv invest. in y. no -5.326** (2.395) 1092 -1464.83 37.86 731. Yes -13.861* (8.308). no 14.347*** (2.581). 1092 -1405.73 144.37 731. 1092 -2144.44 111.63 124 393. yes 13.243 (9.208) 1092 -2144.04 306.40 124 393. no 1.297 (2.703) 1092 -1636.80 89.18 602 68. Yes 12.579 (8.796) 1092 -1634.95 316.95 602 68. Notes: a RE Tobit=Random Effect Tobit;; *** Significant at the 0.01 level; ** at the 0.05 level; * at the 0.1 level; Standard errors in parentheses. Period corresponds to the time periods (1-40) of the game. Final period is a dummy that takes the value 1 if period equals 40 and 0 otherwise. Loss is a dummy variable which is 1 when the participant is hit by a terrorist attack and 0 otherwise. Risk aversion corresponds to the number of A lotteries chosen by the participant in the lottery game. Sum of contribution of others indicates the sum of contribution of all group members except participant i. Demographics includes dummy variables for gender and for master.. Column (1) shows that participants’ contribution in X is significantly and positively influenced by the contributions of others in the previous period. The positive and significant coefficient associated to the variable “loss (lagged)” indicates that people tend to contribute more for their protection by investing in X after being hit in previous period. This result is consistent both with the idea that people overreact when risks appear unfamiliar and hard to control (Slovic, 2000; Sunstein, 2002) and with “probability neglect” theory (Sunstein, 2002). Turning next to the determinants of the investments in the private insurance Y reported in columns (3) and (4), we find that observing high contribution in x from the other group members incite participants to reduce their investment in Y. As found for investments in x, we also find that people invest more in y (i.e. for their own protection) after being hit by an attack. Finally, columns (5) and (6) provide results concerning the determinants of investments in Z. A negative and significant coefficient associated to the variable “loss (lagged)” indicates that people invest less in z after an attack. It is interesting to notice that including demographic variables in specifications do not affect the experimental variables’ estimated coefficients. Demographics are not significant except “risk aversion” variable that attracts a negative and significant coefficient in estimate (6) showing that the more risk averse people are less likely to invest in z. 15.
(20) One average risk averse people contribute only 3.57 units in z while more risk lover participants contribute 4.28 units. This result is consistent with previous findings indicating that a part of the defection in collective policies against terrorism may be explained by the fact that countries may perceive threat of terrorism differently and that only the most risk averse countries would invest to deter terrorism (Sandler and Enders, 2004).. 3.2. The effects of sanctions and rewards on investments in protection This section investigates the effects of rewarding and sanctioning mechanisms on cooperation in collective anti-terrorist policy. Figure 1 shows the time series of the average group contributions in X for each group in the baseline, sanction and reward treatments, respectively. Figure 1 illustrates the existence of strong heterogeneity among groups in the sanction treatment. Some groups seem to be influenced by sanctions and tend to invest more in X. In contrast, some other groups seem to be less influenced by punishment and invest rather low levels of contribution in X. Figure 1 shows a rather different picture for the reward treatment. Indeed 4 of 6 groups seem to be significantly and positively influenced by rewards, while the two others groups react to rewards only at the beginning of the game. Table 4 also shows this heterogeneity between groups. In addition, In addition figures 2 illustrates the time path of aggregate average group investments by period and by treatment in X, Y and Z, respectively.. Invest in X Invest in Y. Invest in Z. 80 70 Average group investment in X. Figure 2. Average group invest. per treatment. 60 50 40 30 20 10 0 1. 3. 5. 7. 9 11 13 15 17 19 21 23 25 27 29 31 33 35 37 39 Periods reward. baseline. 80 Average group investment in Z. 80 Average group investment in Y. sanction. 70 60 50 40 30 20 10. 70 60 50 40 30 20 10 0. 0 1. 3. 5. 7. 1. 9 11 13 15 17 19 21 23 25 27 29 31 33 35 37 39. 3. 5. 7. 9 11 13 15 17 19 21 23 25 27 29 31 33 35 37 39 Periods. Periods reward. sanction. baseline. Baseline. Punishment. Reward. Table 6 shows the distribution of investments in X and Y by treatment. Overall the average investment in X is highest in the reward treatment (54.89) per group from a possible maximum of 80, followed in turn by the punishment treatment (35.86) and the baseline treatment (11.32). In the reward treatment, 3 of 6 groups contribute more than 80% of their endowment over the 40 periods, while no group in the baseline treatment does so. In the punishment treatment, 3 of 7 groups contribute more than 60% of their group endowment. In contrast, we observe an initial increase in the first 16.
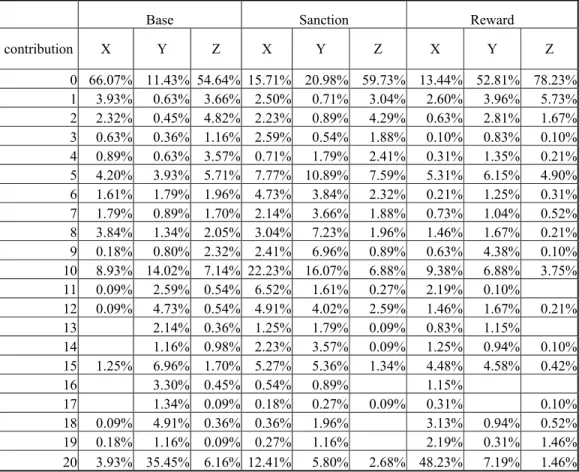
(21) few periods for the baseline with the level of contribution rapidly stabilizing at a rather high level as the game is repeated. Finally, figure 2 shows that the level of investment in X does not change appreciably in the punishment treatment as the game is repeated, remaining at an intermediate level between the reward and the baseline treatments. Turning next to the investments in Y, figure 2 indicates that investments in own protection are significantly higher in the baseline treatment compared to the other treatments. Finally, figure 2 shows that investments in Z are also influenced at a lower degree by the introduction of an incentive mechanism. These results suggest that introducing incentives systems affect all investments decisions including investments in protection and in alternative projects. The effects of punishment and reward on investments are summarized in Result 2.. Table 6: Distribution of investments in X, Y and Z by treatment. Base contribution. X. Y. Sanction Z. X. Y. Reward Z. X. Y. Z. 0 66.07% 11.43% 54.64% 15.71% 20.98% 59.73% 13.44% 52.81% 78.23% 1 3.93% 0.63% 3.66% 2.50% 0.71% 3.04% 2.60% 3.96% 5.73% 2 2.32% 0.45% 4.82% 2.23% 0.89% 4.29% 0.63% 2.81% 1.67% 3 0.63% 0.36% 1.16% 2.59% 0.54% 1.88% 0.10% 0.83% 0.10% 4 0.89% 0.63% 3.57% 0.71% 1.79% 2.41% 0.31% 1.35% 0.21% 5 4.20% 3.93% 5.71% 7.77% 10.89% 7.59% 5.31% 6.15% 4.90% 6 1.61% 1.79% 1.96% 4.73% 3.84% 2.32% 0.21% 1.25% 0.31% 7 1.79% 0.89% 1.70% 2.14% 3.66% 1.88% 0.73% 1.04% 0.52% 8 3.84% 1.34% 2.05% 3.04% 7.23% 1.96% 1.46% 1.67% 0.21% 9 0.18% 0.80% 2.32% 2.41% 6.96% 0.89% 0.63% 4.38% 0.10% 10 8.93% 14.02% 7.14% 22.23% 16.07% 6.88% 9.38% 6.88% 3.75% 11 0.09% 2.59% 0.54% 6.52% 1.61% 0.27% 2.19% 0.10% 12 0.09% 4.73% 0.54% 4.91% 4.02% 2.59% 1.46% 1.67% 0.21% 13 2.14% 0.36% 1.25% 1.79% 0.09% 0.83% 1.15% 14 1.16% 0.98% 2.23% 3.57% 0.09% 1.25% 0.94% 0.10% 15 1.25% 6.96% 1.70% 5.27% 5.36% 1.34% 4.48% 4.58% 0.42% 16 3.30% 0.45% 0.54% 0.89% 1.15% 17 1.34% 0.09% 0.18% 0.27% 0.09% 0.31% 0.10% 18 0.09% 4.91% 0.36% 0.36% 1.96% 3.13% 0.94% 0.52% 19 0.18% 1.16% 0.09% 0.27% 1.16% 2.19% 0.31% 1.46% 20 3.93% 35.45% 6.16% 12.41% 5.80% 2.68% 48.23% 7.19% 1.46%. Result 2: Introducing sanctions or reward systems significantly increases investments in X (i.e. international protection) and lowers both investments in Y (i.e. national protection) and in Z (investments in alternative projects). Support for result 2. A Mann-Whitney pairwise statistical test comparing contributions between treatments, maintaining the conservative assumption that each group’s activity over the session is a unit of observation shows that the difference in contributions in X between the. 17.
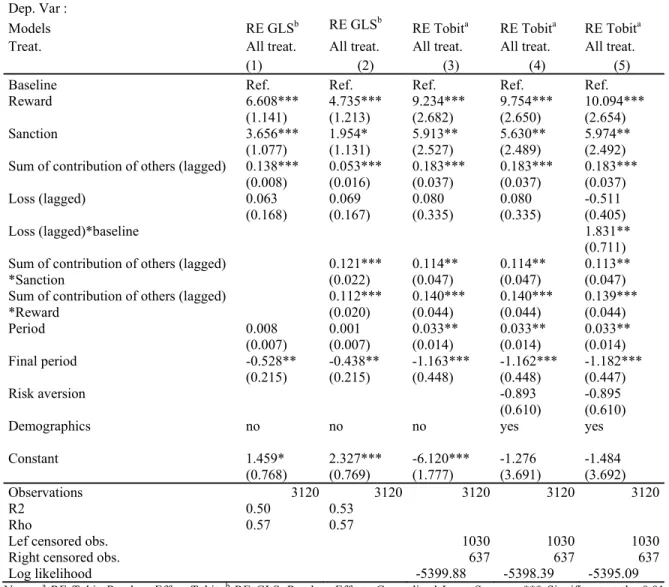
(22) baseline and the punishment treatment is significant at the p =0.018 level.15 Similarly, contribution in X is significantly higher under the reward treatment compared to the baseline treatment (p = 0.0027). Finally, we find that rewards induce higher contribution in X than punishment. However the difference is not significant (p = 0.15). Turning next to the investments in Y, we find that they are significantly higher in the baseline treatment compared to the punishment treatment (p =0.018) as well as compared to the reward treatment (p =0.0027). A borderline significance is found between the reward and the punishment treatments (p = 0.116). These findings indicate that introducing reward or sanctions lead the agents to substitute more investments in X compared to Y. Another interesting finding is that rewards and sanctions also affect investments in Z. In particular both sanctions and reward incite people to invest significantly less in Z. Note, however, that the incidence of incentives systems on Z is lower than its effect on Y. A MannWhitney pairwise test indicates that people contribute significantly more in Z in the baseline treatment than in the reward treatment (p = 0.086). However, difference between the punishment and baseline treatments is not significant (p =0.4062). To study in more details how decision-making behaviour of individuals is influenced by rewards and sanctions, we estimated in Table 7 the determinants of contribution levels to the international protection X. Columns (1) and (2) display the results of two GLS. Regression (1) controls for variables included in previous estimates presented above in Table 5. Dummy variables “Sanction” and “reward” were included to measure potential treatment effects. These variables are interpreted in relation to the omitted “baseline” treatment. Regression (2) adds two interactions variables “Sum of contribution of others (lagged)*sanction” and “Sum of contribution of others (lagged)*reward”. Columns (3) and (4) replicate previous models but using random effects Tobit models to account for both left- and right-censoring. Finally specification (5) includes demographic variables.. 15. The unit of observation is the average contribution of the group over the entire session (yielding seven observations per treatment except for the reward treatment with six observations, one per group), and the null hypotheses are that the group contributes an identical amount over a forty-period session.. 18.
(23) Table 7: Determinants of investment in X Dep. Var : Models Treat.. RE GLSb All treat. (2) Ref. 4.735*** (1.213) 1.954* (1.131) 0.053*** (0.016) 0.069 (0.167). RE Tobita All treat. (3) Ref. 9.234*** (2.682) 5.913** (2.527) 0.183*** (0.037) 0.080 (0.335). RE Tobita All treat. (4) Ref. 9.754*** (2.650) 5.630** (2.489) 0.183*** (0.037) 0.080 (0.335). 0.008 (0.007) -0.528** (0.215). 0.121*** (0.022) 0.112*** (0.020) 0.001 (0.007) -0.438** (0.215). 0.114** (0.047) 0.140*** (0.044) 0.033** (0.014) -1.163*** (0.448). Demographics. no. no. no. 0.114** (0.047) 0.140*** (0.044) 0.033** (0.014) -1.162*** (0.448) -0.893 (0.610) yes. Constant. 1.459* (0.768). Baseline Reward Sanction Sum of contribution of others (lagged) Loss (lagged). RE GLSb All treat. (1) Ref. 6.608*** (1.141) 3.656*** (1.077) 0.138*** (0.008) 0.063 (0.168). Loss (lagged)*baseline Sum of contribution of others (lagged) *Sanction Sum of contribution of others (lagged) *Reward Period Final period Risk aversion. Observations R2 Rho Lef censored obs. Right censored obs. Log likelihood. 0.50 0.57. RE Tobita All treat. (5) Ref. 10.094*** (2.654) 5.974** (2.492) 0.183*** (0.037) -0.511 (0.405) 1.831** (0.711) 0.113** (0.047) 0.139*** (0.044) 0.033** (0.014) -1.182*** (0.447) -0.895 (0.610) yes. 2.327*** -6.120*** -1.276 -1.484 (0.769) (1.777) (3.691) (3.692) 3120 3120 3120 3120 3120 0.53 0.57 1030 1030 1030 637 637 637 -5399.88 -5398.39 -5395.09. Notes: a RE Tobit=Random Effect Tobit; b RE GLS=Random Effects Generalized Least Squares; *** Significant at the 0.01 level; ** at the 0.05 level; * at the 0.1 level; Standard errors in parentheses. Period corresponds to the time periods (1-40) of the game. Final period is a dummy that takes the value 1 if period equals 40 and 0 otherwise. Loss is a dummy variable which is 1 when the participant is hit by a terrorist attack and 0 otherwise. Sum of contribution of others indicates the sum of contribution of all group members except participant i. Cost of received sanction indicates the cost of sanctions received by the participant; Gain of received sanction indicates the gain of rewards received by the participant; Demographics includes dummy variables for gender and for master. Risk aversion corresponds to the number of A lotteries chosen by the participant in the lottery game.. Table 7 confirms previous findings. It indicates that in all specifications indicating both reward and punishment significantly increase average contribution to the group account X. A t test indicates that the effects of rewards are higher than those of punishments. Table 7 also shows that participants are significantly and positively influenced by the levels of contribution of the others in the previous period. Note however that the positive and significant coefficient associated to the interaction variables “Sum of contribution of others (lagged)*sanction” and “Sum of contribution of others (lagged)*reward” shows that the effect of observation of group contribution in previous period is higher under reward and sanction treatment than in the baseline treatment. The variable “Loss (lagged)” is insignificant while the interaction variable “Loss (lagged)*baseline” attracts a positive and significant coefficient, suggesting that having been hit by a terrorist attack in previous period has a positive effect on contribution on x but only in the baseline treatment. A potential explanation is that contribution decisions in the reward and sanction treatment are mainly driven by received points and by observation of 19.
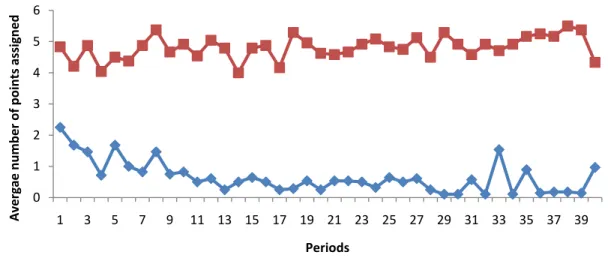
(24) contribution of others. Finally, we find that controlling for demographic variables in specification (4) and (5) does not change appreciably the results.. 3.4. The determinants of punishment and reward behaviours In stage two of the reward and punishment treatments, agents can observe the contribution decisions of all other individuals, and can condition their sanctioning/rewarding behaviors on this information. Our data indicate that most of people do not sanction others. On average only 14.73% of people assign one or more points of sanction. Moreover among those who sanction, most of them (74.5%) assign less than five points. Turning next to reward decisions, we find that in contrast, a large majority of people assign reward points (57.81%). More than 25% of people assign between 8 and 12 reward points. These results are consistent with previous studies that found that people generally prefer using rewards to sanctions (Sefton et al. 2007). One potential reason for this huge number of reward points is that people may condition their reward decisions on expectations that the others will also reward them even if rewarding is anonymous, which in turn translates into higher expected payoffs. In contrast, some players may be reluctant to sanction in order to avoid blind revenge. Another explanation is that rewarding someone may be perceived as more positive action as punishing another participant. Our findings concerning punishing and rewarding decisions are summarized in result 3.. Result3. Both sanction and reward decisions are influenced by deviations from average contribution of others. A non negligible part of these decisions seems to respond to willingness to reciprocate received points in previous period. Support for result 8: Figure 3 displays the evolution of the average number of punishment and reward points over time. It shows that sanction points decline over time while there is a slight upward trend in the reward points.. Avergae number of points assigned. Figure 3. Average number of punishment/reward points distributed over time 6 5 4 3 2 1 0 1. 3. 5. 7. 9. 11 13 15 17 19 21 23 25 27 29 31 33 35 37 39 Periods sanction . reward. Table 8 shows the results concerning the determinant of sanction decision. It contains the estimates from the following regression model: t t t +β5 t+β6W p i j 2 t = β 0 + β 1 c + β 2 m a x 0 , c − c j t + β 3 m a x 0 , c j t − c +β4 ∑ recdpoints. {. }. {. 20. }. t −1.
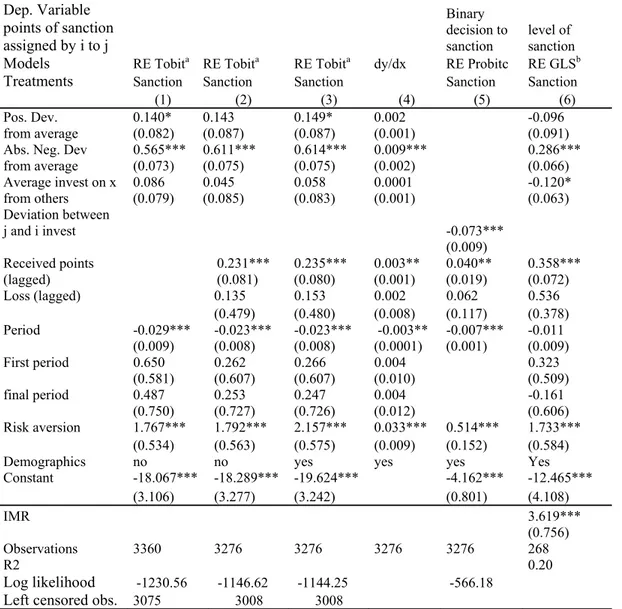
(25) j 2t The dependent variable pi is the quantity of punishment points that player i assigns to player. _ t j in the second stage of period t, c j is player j’s contribution in period t, and c t is the others' average contribution in period t. The variable “received points in t-1” indicates the total number of received points from other members in previous period. The sanction regression results are shown in Table 8. Table 8 consists of two panels. The left panel displays the results of three regressions in which the dependent variable is the sanction choice of subjects. The right panel, which we will discuss below, presents the results of alternative specifications that check the robustness of the results. The Tobit models account for both left- and rightcensoring. In addition, since each subject is observed a number of times (40 times), we appeal to panel data methods with random effects. A significantly positive coefficient on β2 in specifications (1) to (3) indicates that negative deviations from the average contribution on X from others are severely punished. The coefficient associated to the variable “received points in t-1” is positive and significant, indicating that a part of sanctioning decision can be explained by blind revenge. Note that our design prevented the possibility of direct revenge since players could not observe individual sanctioning decisions across periods. The positive and significant coefficient associated to the « risk aversion » variable indicates that the more risk averse people are those who punish the more. A possible explanation of this result is that this variable captures the fact that risk averse agents may be willing to incite free riders to cooperate more in collective protection and that such expectations may be strongly related to risk aversion. Note that additional estimates (not reported here) indicate that risk aversion variable remains significant even after controlling for player ’'s contribution. Column (4) shows the marginal effect of each explanatory variable from specification (3). To check the robustness of our experimental results, we have considered a number of alternative specifications, some of which are reported in the right-hand panel of Table 8. Previous regressions were based on the strong assumption that decisions to sanction and the choice of sanctioning level are made simultaneously. However it may be in fact important to respect the sequential structure in the sanctioning decisions separating binary decision to sanction from the intensity of punishment. Bearing this in mind, we proceed to an alternative two-step estimation procedure that respects the sequential nature of the decision in order to correct for any selection bias from the exclusion of the observations corresponding to the decisions not to sanction. We therefore ran additional estimations to dissociate the decision to punish from the intensity of punishment. We consider two separable decisions using a two-step estimation procedure: first the decision to sanction someone and second, conditional on the decision to sanction, the choice of the intensity of punishment. We first estimate the punishment probability using a random effects Probit as a selection equation, producing the inverse of the Mill’s ratio (IMR); we then explain the number of points distributed, conditional on the decision to punish, by means of a Generalized Least Squares model corrected for a potential selection bias via the inverse of the Mill’s ratio (the "IMR" variable) as an explanatory variable. The exogenous variables in the selection equation include deviations between the target's contribution and the punisher's contributions, “received sanction in t-1” as well as a time trend and demographic variables. Column (5) presents the results from the selection equation and column (6) displays the results of the GLS estimation for the sub-samples of observations in which the subject punishes a group member. The robustness checks deliver the same conclusion as the right-hand panel.. 21.
Figure
+7

Documents relatifs
In continuation of Kalliopi’s work, the OHCHR decided in resolution 2005/80 to appoint for three years a special rapporteur on the promotion and protection
The child’s right to privacy, data protection and protection from commercial exploitation re-visited
“There is a need for guidelines for AI technologies that take children’s rights into account, not only for the government and the private sector but also for parents and
protection status as a result of travels to the country of origin (and/or contacts with national authorities of the country of origin) and appeal procedures, possible consequences
Des traitements symptomatiques (chirurgie, radiothérapie et traitements topiques notamment) sont disponibles pour la prise en charge de ces lésions et permettent
We used the Grid’5000 platform to generate the state spaces for one and two sequencers, using various combinations of the modeling choices discussed previously. Table 1 summarizes
An integrated analysis of unemployment protection and family policies; following the criticism that it might be more fruitful to analyze welfare state stability or change by
Children’s rights7 that are potentially impacted (Lievens et al., 2018) are the rights to non-discrimination (Article 2 uncrc), the child’s best interests (Article 3 uncrc and
Compulsory Purchase Act 2004, countryside planning is organised at national level through the planning policy statement “Sustainable Development in Rural Areas” (PPS 7),
