COMPARISON OF BUILDING DAMAGE ASSESSMENT METHODS FOR RISK ANALYSIS IN MINING SUBSIDENCE REGIONS
SAEIDI Ali1, DECK Olivier2, VERDEL Thierry3
1 Centre d’études sur les ressources minérales, Université du Québec à Chicoutimi, Chicoutimi, Québec, Canada, [email protected]
2 Laboratoire environnement géomécanique & ouvrages, Nancy université, Parc de Saurupt CS 14 234, 54042, Nancy Cedex, France, [email protected].
3 Laboratoire environnement géomécanique & ouvrages, Nancy université, Parc de Saurupt CS 14 234, 54042, Nancy Cedex, France, [email protected].
ABSTRACT: The occurrence of subsidence phenomena in urban regions may induce small to severe damage to buildings. Many methods are provided in the literature to assess buildings damage. Most of these methods are empirical and use the horizontal ground strain as a subsidence intensity in the vicinity of a building. Application and comparison of these methods with a case study is the main objective of this paper. This comparison requires some harmonization of the existing methods and the development of a software, which combines the subsidence hazard prediction, the damage evaluation methods and a database of buildings with structural parameters as well as the geographical coordinates of the buildings An additional results is the development of a method for the prediction of the horizontal ground strain in the vicinity of each building. Results are given as a map of damaged buildings for the case study and the different existing methods with some statistical calculations such as the mean and the standard deviation of damage in the city. Comparison of these results allows identification of the “safer” method that give the higher mean of damage. The comparison of the calculated results and observed damage in Lorrain region show that, the Dzegeniuk et al. methods is more realistic in comparison of the other empirical methods.
KEYWORDS:Building vulnerability, mining subsidence, damage, horizontal ground strain.
1.
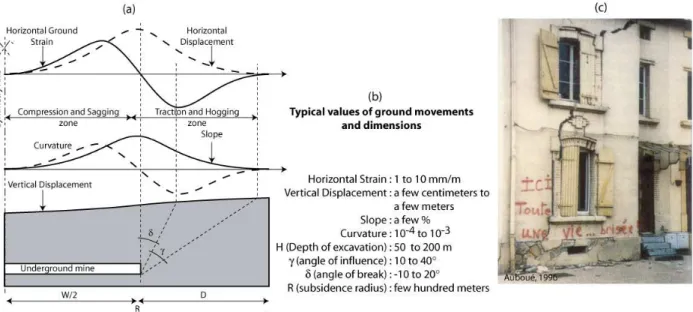
IntroductionThe extraction of ore and minerals by underground mining may induce ground subsidence phenomena. These phenomena lead to horizontal and vertical ground movements, and consequently to the deformation and damage to buildings in urban undermined regions. The maximum vertical displacement generally occurs at the center of the subsidence area and may reach several meters. This displacement is accompanied with horizontal strain in the ground, ground curvature, and slope, which make up the three types of movements that load structures and cause structural damage (Deck 2002). Therefore, subsidence may induce small to severe damage in buildings (see Fig. 1 c). Abandoned mines concern many countries and the mitigation of risk due to subsidence hazard is therefore an important issue. The Lorraine province in France is a region with more than 140 km2 of abandoned underground mines area.
The evaluation of building vulnerability is possible by the use of empirical or analytical methods. Analytical methods are based on the beam theory (Timoshenko 1956) to assess the global behavior of a building in relation to its geometry and mechanical properties (Boscardin and Cording 1989; Burland 1997; Boone 1996; Finno et al. 2005).
Empirical methods are based on the analysis of a large number of damages observed in subsidence regions. The simplest method is based on threshold values of the ground displacements (Skempton and MacDonald 1956 ), such as the National
Bhattacharya and Singh (1984), Yu et al. (1988), Dzegeniuk et al. (1997) and Kwiatek (1997). The comparison of these methods is very difficult because they each one use a different number of criteria and different threshold values. Some of them are really simple and some others are very detailed. These methods are presented in the section 2.1.
Fig. 1. Description of the main characteristics involved in mining subsidence a) description of ground movements, b) typical values of ground movements and dimensions (these values may significantly vary with each specific case), c) a very sever
building damage example
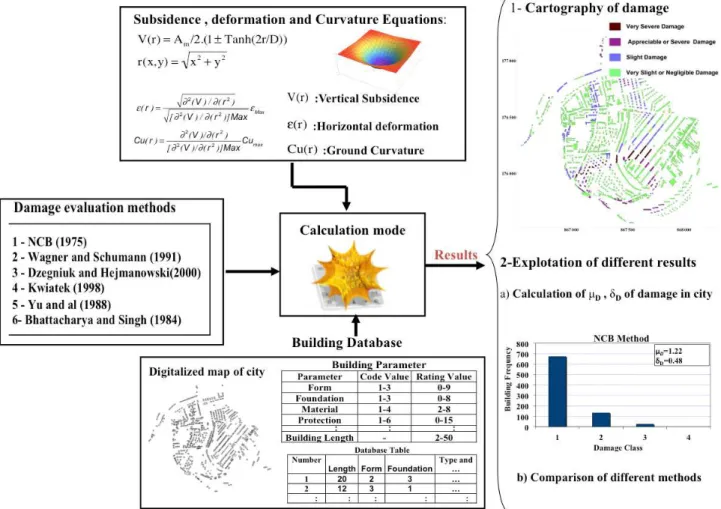
The objective of the present paper is the comparison of six empirical methods for buildings damage assessment. For this purpose these methods are implemented in a dedicated software (Fig. 2) based on:
• The use of a method for the evaluation of the subsidence parameters in a given territory and particularly the ground curvature and horizontal strain;
• The use of the six existing empirical methods;
• A digitalized map of the city with the coordinates of all the buildings;
• A building database of the city with some structural characteristics of all the buildings;
This software has been developed with Mathematica® (Wolfram, 2009) and allows to assess the damage of each building depending on both its characteristics, the local ground movements and the selected damage assessment method (Fig. 2). The following sections first present the considered methods of damage evaluation in subsidence zones and describe the required modifications for the implementation in the software. Results of a case study are then presented and existing methods of damage evaluation are compared.
Fig. 2. Architecture of the software developed for the comparison of the 6 empirical methods of damage assessment.
2. Implementation of existing methods of damage assessment
2.1.
Existing methods of damage assessmentMethods for building damage assessment have been developed in different countries where mining subsidence is known as a large-scale problem (e.g., England, USA, Poland, South Africa). Most of these methods are empirical and use observational data from damaged buildings. These empirical methods may be classified into two main types: abacus or rating methods (Deck 2002). Table 1 summarizes some characteristics of six of these methods.
Table 1. Summary of building damage assessment methods used in mining subsidence hazard areas.
Method Type Empirical/
Analytical
Damage scale Definition of vulnerability classes
NCB (1975) Abacus Empirical 5 levels (Fig. 3-a) No
Wagner and Schumann (1991) Abacus Empirical 5 levels (Fig. 3-b) No
Bhattacharya and Singh (1984) Rating Empirical 3 levels (Table 7) yes (4 classes) (Table 7) Yu et al. (1988) Rating Empirical 3 levels (Table 6) yes (4 classes) (Table 6)
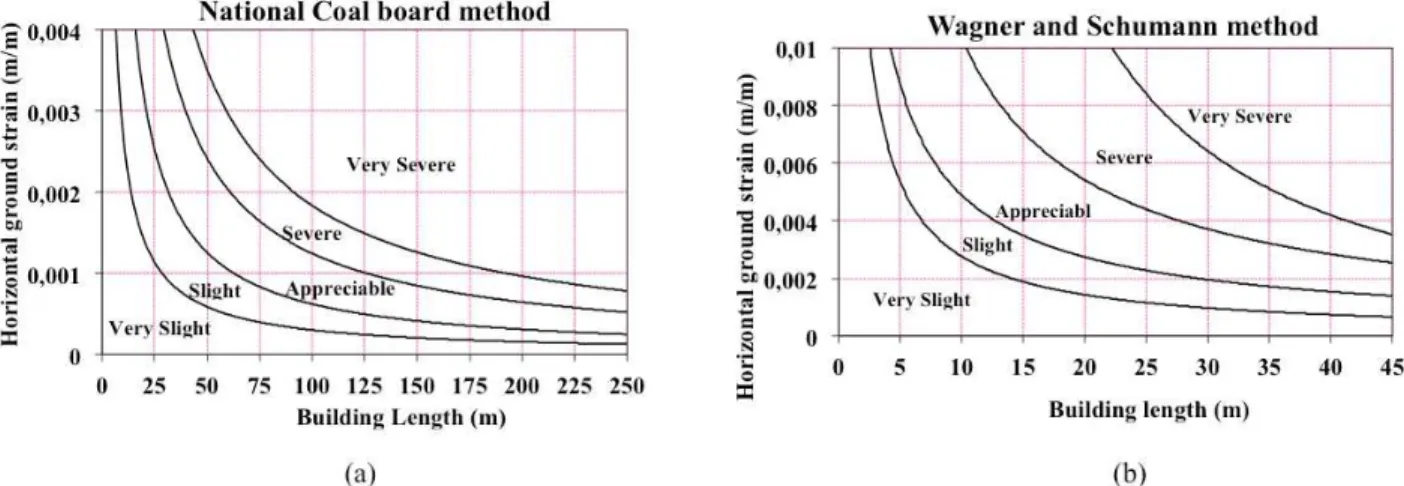
Dzegeniuk et al. (1997) Rating Empirical 5 levels (Table 8) yes (5 classes) (Table 8) Kwiatek (1998) Rating Empirical No damage scale yes (5 classes) (Table 9) The abacus methods, namely the National Coal board (NCB) method (NCB 1975) and the Wagner and Schumann method (1991) (Fig. 3a and b), link building damage to building length and the horizontal ground strain. These two methods are very similar, although they were developed from a database of observations resulting from coal mining in the UK and in South Africa, respectively.
Fig. 3. Schemes of NCB (1975), and of Wagner and Schumann (1991) for the assessment of building damage in mining subsidence hazard areas.
The rating methods consider several parameters such as building length, shape, typology and type of foundation, to define the vulnerability class of a given building. Rating methods developed in the USA include one by Yu et al. (1988, Table 6 in Appendix], and a second one developed by Bhattacharya and Singh (1984, Table 7 in Appendix). Two other methods were developed in Poland by Dzegniuk et al. (1997, Table 8 in Appendix) and by Kwiatek (1998, Table 9 in Appendix). A set of threshold values of the horizontal ground strain is then used to define the damage level. The main differences between these methods are the criteria used to define the vulnerability class, the number of vulnerability classes (between 4 and 5) and the number of damage classes (shown in Table 1 and Table 2).
A comparison of the existing methods shows that their use raises some difficulties. The most important points can be summarized as follows:
• All of these methods use the horizontal ground strain parameter as an intensity criterion of the subsidence. This criterion has then been selected for the development of our damage software.
• Methods use different criteria to assess the building resistance but the length of the building always appears to be the most important parameter. The abacus methods use only the building length, while the rating methods use a larger number of criteria to assess the building resistance. Other building parameters include building materials, existing reinforcements, shape of the building, building stiffness and type of building foundations.
• These methods use different damage scales, which may be compared with other scales used in mining subsidence (Pellisier et al. 1992; Bruhn et al. 1982 and Ji-Xian 1985 (Table 4). The number of damage levels varies from three to six.
• None of the rating methods is complete as regards the threshold values of the horizontal ground strain. Indeed, a method that consider x vulnerability classes and y damage classes should include x by y threshold values, whereas the rating methods mentioned above consider a lower number of values. Thus, the accuracy of the rating methods due to the large number of parameters used is counterbalanced by a set of missing threshold values that are necessary to assess the damage level.
• Different rating methods used different numbers of vulnerability classes: four classes for the Yu et al. (1988) and Bhattacharya and Singh methods, and five classes for the Dzegniuk et al. (1997) and Kwiatek (1998) methods. Consequently, the comparison of these different methods requires an harmonization in order to use the same number of damage levels and vulnerability classes, and some developments to complete the missing threshold values in all methods.
2.2.
Harmonization of existing methodsTo be compared, the different existing methods must first be adapted. In particular, they must use the same number of damage levels and the missing threshold values of the rating methods must be completed. For this purpose, we chose to develop a common harmonized damage scale, as well as similar vulnerability classes with associated common threshold values of the horizontal ground strain.
• Harmonization of damage scales
A four-level damage scale is chosen with “D1” for no or very slight damage, “D2” for slight damage (D1 and D2 are considered to be architectural damage according to Bhattacharya and Singh (1984)), “D3” for moderate damage (i.e. functional damage according to Bhattacharya and Singh 1984), and “D4” for severe and very severe damage (i.e. structural damage according to Bhattacharya and Singh 1984). This choice is compatible with usual scales used in building vulnerability estimate (D1 to D4 in the HAZUS method (1999) for instance). Secondly, it allows distinguishing small damage “D1” that may be due to other causes than settlement (natural aging, in particular) from greater damage that may be caused by a subsidence event. The levels of the selected damage scale are shown on Table 2.
• Harmonization of vulnerability classes for rating methods
Regarding the number of vulnerability classes (between 4 and 5) defined in the three rating methods, we suggest that rating methods be modified so that buildings may be classified into four vulnerability classes. This leads to grouping two classes into a single one for two of the methods. Indeed, a detailed analysis shows that the Kwiatek (1998) method is very similar to the Dzegniuk et al. (1997) method. Classes “C0” and “C1” defined in the Kwiatek (1998) method may be considered equivalent to the class “C1” of the Dzegniuk et al. (1997) method. Classes “C4” and “C5” defined in the Dzegniuk et al. (1997) method may also be considered equivalent to the class “C5” of the Kwiatek (1998) method. These results are deduced from a comparison of the threshold values of the horizontal ground strain in Table 7 and Table 8. Then, the resulting four classes obtained from these two methods are compared with the four classes of the Bhattacharya and Singh method. This comparison, based on the threshold values of the horizontal ground strain (Table 6, Table 7, Table 8, and Table 9) leads to the conclusion that the classes can be considered as equivalent.
• Harmonization of the threshold values of the horizontal ground strain for the rating methods
The determination of the damage level strictly depends on the building vulnerability class and the intensity of the horizontal ground strain. A total number of 16 threshold values is then required (4 damage levels x 4 vulnerability classes). Unfortunately, half of these values are missing in the most complete method of Yu et al. (1988, Table 6). Therefore, threshold values have been taken from other methods to complete Table 3. In particular, the threshold values of the Kwiatek (1998) method that corresponds to the maximum acceptable movement before significant damage is observed, were used to define the values corresponding to the damage class “D3”. The original threshold values of the Dzegniuk et al. (1997) method (Table 8) were used to define the threshold value of the damage class “D2” for the vulnerability class “C2”, the damage class “D3” for the vulnerability class “C3,” and the damage class “D4” for the vulnerability class “C4”.
Remaining threshold values were also slightly adapted to create a regular and logical increase in the values when increasing damage level or vulnerability class number. Finally, four building vulnerability classes, four damage classes (Table 2) and
sixteen threshold values of the horizontal ground strain have been defined for all the rating methods (Table 3).
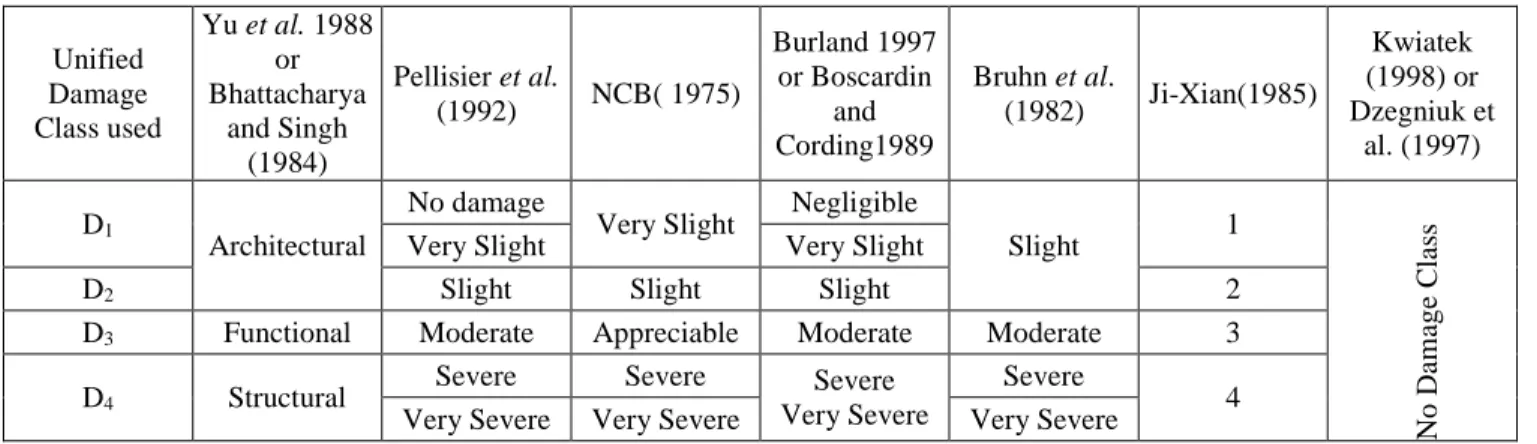
Table 2. Comparison between the four damage classes used and the damage classes defined in existing methods.
Unified Damage Class used Yu et al. 1988 or Bhattacharya and Singh (1984) Pellisier et al. (1992) NCB( 1975) Burland 1997 or Boscardin and Cording1989 Bruhn et al. (1982) Ji-Xian(1985) Kwiatek (1998) or Dzegniuk et al. (1997) D1 Architectural No damage
Very Slight Negligible
Slight 1 N o D am ag e C la ss
Very Slight Very Slight
D2 Slight Slight Slight 2
D3 Functional Moderate Appreciable Moderate Moderate 3
D4 Structural
Severe Severe Severe
Very Severe
Severe
4
Very Severe Very Severe Very Severe
Table 3. Threshold values of the horizontal ground strain used to assess building damage with the rating methods in relation to the vulnerability class of a given building.
Vulnerability Class Damage Class
C1 C2 C3 C4
D1(negligible or very slight) <0.5 mm/m <1.5mm/m <2.5 mm/m <3.5 mm/m
D2(Slight) 0.5-1.5 mm/m 1.5-2.5 mm/m 2.5-4.5 mm/m 3.5-6 mm/m
D3(Moderate) 1.5-2.5 mm/m 2.5-3.5 mm/m 4.5-6 mm/m 6-9 mm/m
D4(Severe and very severe) ≥2.5mm/m ≥3.5 mm/m ≥6 mm/m ≥9 mm/m
• Comparison with other methods
The resulting harmonized method can then be compared with Ji-Xian method (1985). The Ji-Xian (1985) method for instance, defines threshold values for buildings that may be classified into the third vulnerability class “C3”. Table 4 shows these values together with the corresponding values in our harmonized method and indicates a compatibility between the two methods.
Table 4. Building damage and threshold values of the horizontal ground strain defined in the JI-Xian method (1985) and in for buildings equivalent to the vulnerability class C3 of Table 3.
Threshold values of the horizontal ground strain <2 mm/m 2-4 mm/m 4-6 mm/m >6 mm/m
Damage category D1 D2 D3 D4
Threshold values in class C3 of the harmonized method (Table 3)
3. Evaluation of the horizontal ground strain
Mining subsidence induces different ground movements, in particular vertical displacement, ground curvature, ground slope and horizontal ground strains (Fig. 1). All methods investigated in this study use the horizontal ground strain as intensity parameters. There are few analytical methods that considered the ground curvature as like the intensity parameter for damage evaluation. It is then necessary to assess the value of this parameter in the vicinity of each building. Two options are available for this assessment. The first is based on modeling the underground mine and calculating the movements in relation to the dimensions of the underground collapse (Whittaker and Reddish 1989, Al Heib 2008). The second is based on analytical functions of the ground movements, in relation to the extent of the subsidence at the ground surface. In the following subsections, the second option is investigated and a methodology of calculation is described based on the correlation between the ground curvature and the horizontal ground strain.
3.1.
Methodology for the calculation of horizontal ground strainFew analytical functions exist for the description of the horizontal ground strain, while a large number of functions are available for the vertical subsidence profile (Van der Merwe and Madden 2002). Consequently, it is preferable to use the latter to estimate the former (Fig. 1).
Analytical functions of the vertical subsidence V are dependent on the characteristics of the underground mine and overburden: (Equation 1).
Equation 1
V(x)
=
f
(S
max,
W,
L,
H,
γ
,
δ
,
C)
With W and L the width and length of mine panel, H the depth of the mine, γ the influence angle, δ the failure angle, C one or several constant parameters and Smax the maximal subsidence at the center of subsidence zone in the critical and super critical mining case i.e., for ratios of the mining width W by depth H greater than 2×tanγ. The maximal subsidence may be calculated with Equation 2 (Whittaker and Reddish 1989, Saeidi 2010).
Equation 2 Smax =K×O×
τ
With O the thickness of the excavated layer, τ the extraction ratio (O ×τ is then the equivalent thickness of the void) and K an empirical coefficient. The K coefficient varies with the mining context but is roughly constant for mines excavated the same site with similar conditions. For example, a typical value of 0.9 is used for coal mines in England, and 0.68 is used for Provence Coal mines in France (Al Heib et al. 2001).
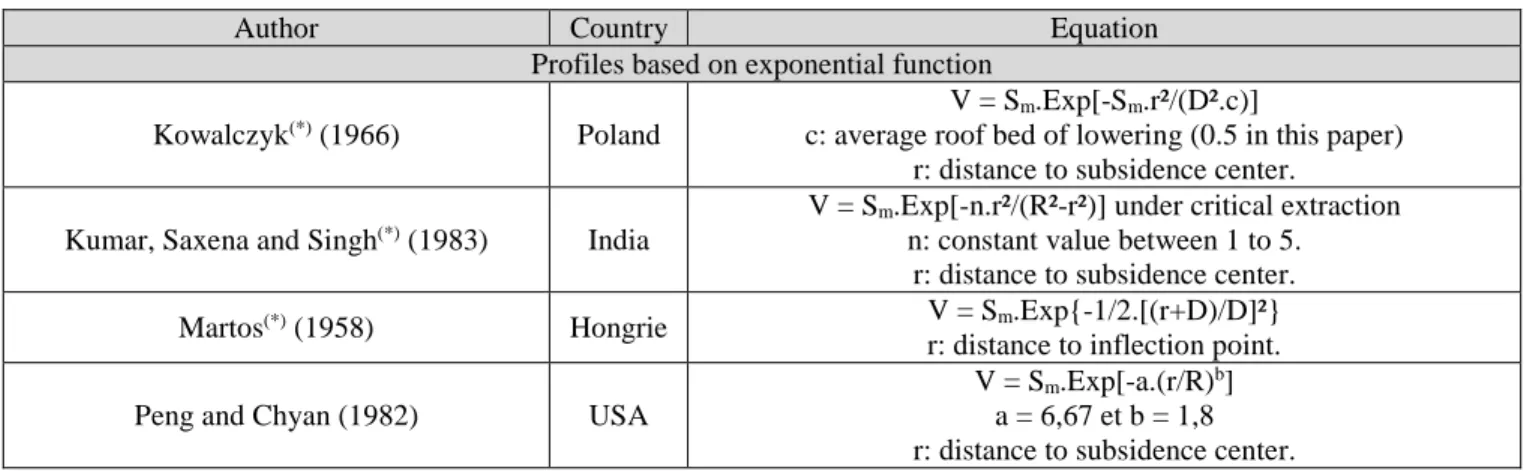
Most of the equations use exponential or tangent hyperbolic functions (Table 5).
Table 5. Several analytical functions of the vertical subsidence profile.(Deck 2002)
Author Country Equation
Profiles based on exponential function Kowalczyk(*) (1966) Poland
V = Sm.Exp[-Sm.r²/(D².c)]
c: average roof bed of lowering (0.5 in this paper) r: distance to subsidence center. Kumar, Saxena and Singh(*) (1983) India
V = Sm.Exp[-n.r²/(R²-r²)] under critical extraction n: constant value between 1 to 5.
r: distance to subsidence center.
Martos(*) (1958) Hongrie V = Sm.Exp{-1/2.[(r+D)/D]²}
r: distance to inflection point.
Peng and Chyan (1982) USA
V = Sm.Exp[-a.(r/R)b] a = 6,67 et b = 1,8 r: distance to subsidence center.
Urbanik and Osborne (1986) England
V = Sm.Exp[ln(a/Sm).(2r/W)²] r: distance to subsidence center.
a : vertical subsidence above the edge of the mine panel. Profiles based on tangent hyperbolic function
King and Whetton(*) (1957) England V = Sm/2.(1-tanh(2.r/D)) r : Distance to inflection point. Littlejohn et al. (1993) England V = Sm/2.[1-tanh(2r/(H.tanδ))]
r : Distance to inflection point. King, Whittaker and Shadbolt (1974) England V = Sm/2.(1 +/- tanh(5.r/H)
r: Distance relate to inflection point. Profiles based on other functions
Saxena (1980) – Niederhofer(*) (1962) India V = Sm.[1-r²/R²]² r: Distance to subsidence center. Gims(*) (1958) USSR V = Sm/2.[1-x/D-1/π.sin(π.r/D)] r: Distance to inflection point. V: vertical subsidence [m]
R: subsidence radius [m]
D: distance between the boundary of mine panel and boundary of the subsidence zone [m]
Smax: maximum subsidence at the center [m] W : width of mine panel [m]
H : depth of panel [m]
(*) : referenced by Whittaker and Reddish (1989)
For each function in Table 5, the ground curvature Cu(r) can be calculated with Equation 3. (Deck 2002; Kratzsch 1983).
Equation 3
{
}
[
2]
3 2 2)
(
/
)
(
1
)
(
/
)
(
)
(
r
V
r
V
r
Cu
∂
∂
+
∂
∂
=
Where r is the distance to the center of subsidence zone.For ground movements due to mining subsidence, the slope ∂(V)/∂(r) is generally of a few percent and the square of
) ( / ) (V ∂ r
∂ can be neglected compared to unity. Therefore, Equation 3 can be modified into Equation 4.
Equation 4
Cu
(
r
)
=
∂
2(
V
)
/
∂
(
r
2)
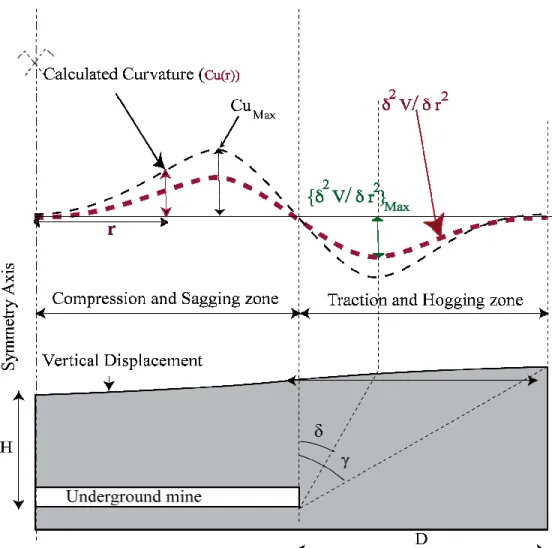
Equation 4 provides a suitable shape for the curvature (i.e. relative values), but it does not constitute an absolute estimate. This problem can be solved by adjusting Equation 4 with an independent assessment of the maximal value of the curvature Cumax (Fig. 4) so that it becomes possible to adapt the curvature profile to the most realistic value Cumax, i.e the maximum value of curvature in the subsidence.
Equation 5
[
]
max max 2 2 2 2)
(
/
)
(
)
(
/
)
(
)
(
Cu
r
V
r
V
r
Cu
∂
∂
∂
∂
=
The maximal value of the curvature Cumax can be calculated using Equation 6 from the minimum radius of curvature in the subsidence basin (Rmin) (Deck 2002).
Equation 6
Cu
max=
1
R
minR
min=
K
RH
2S
maxWith KR a constant coefficient that depends on each mining region, with typical values ranging from 0.05 to 0.3 (Deck 2002; NCB 1975).
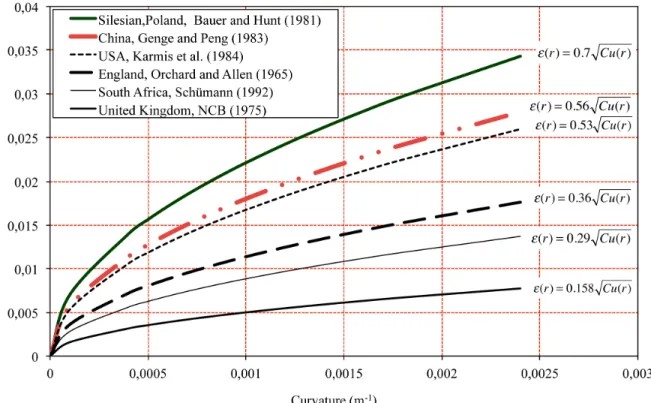
Fig. 4. Calculation of the ground curvature profile in relation to the second derivative of the vertical subsidence. The calculation of the horizontal ground strain can be carried out in a similar way. Empirical studies from different countries, for different geological contexts and for both longwall, and room and pillar mining methods provided a relation between the free-field horizontal ground strain ε(r) and the ground radius of curvature Cu(r) as given in Equation 7 (Fig. 5, Karmis et al. (1984), Orchard and Allen 1965).
Equation 7
ε
(
r
)
=
K
siteCu
(
r
)
With Ksite a coefficient that probably depends on the geological and mining context (mining method, mine geometry, overburden, …) but no studies have investigated this point and its determination is mainly based on empirical data. Typical values range from 0.1 to 0.9 (Fig. 4).
Fig. 5. Relations between the horizontal ground strain and the ground curvature
From Equations 7 and 5 and similarly to the estimate of the curvature, we get Equation 8 where εmax is an independent assessment of the maximal horizontal ground strain.
Equation 8
[
]
max max 2 2 2 2)
(
/
)
(
)
(
/
)
(
)
(
ε
ε
r
V
r
V
r
∂
∂
∂
∂
=
εmax can be assessed with empirical relations such as Equation 9. Equation 9H
S
K
max max εε
=
Where Kεε is a constant parameter that depends on the geological and mining context and usually range from 0,5 to 3 (Whittaker and Reddish1989). For instance, in the Lorraine iron-ore field in France we have Kε=1.5 (Al Heib 2003).
3.2.
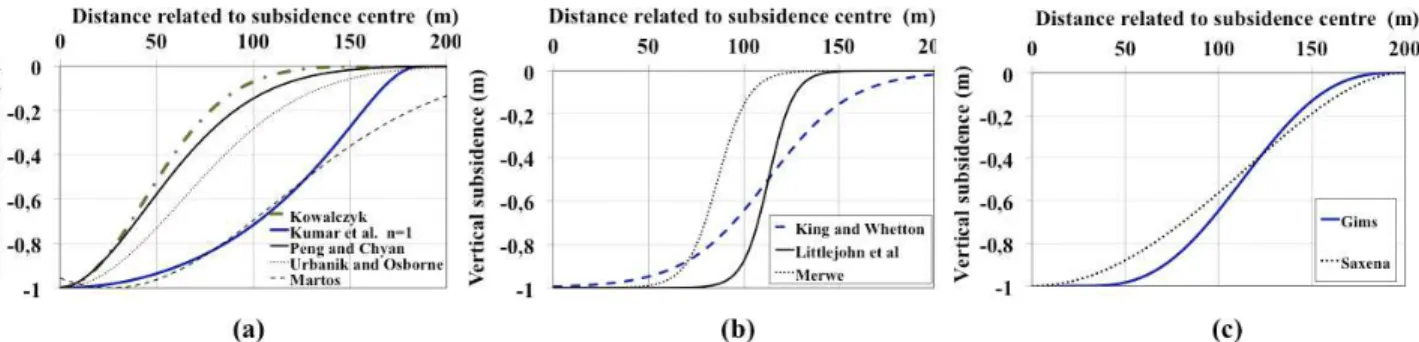
Comparison of the different functionsThe different functions provided in Table 5 can be compared. For this purpose, a theoretical case is considered with the following characteristics: Smax=1 m, H=150m, R=200m, γ=30°, δ=10°, D=H*Tan(γ)=87m and W=226m. These data correspond to a typical case as found in the Lorraine iron–ore field. The normalized predicted vertical subsidence (V/Smax) is calculated for the analytical equations presented in Table 5, where V(r) is the vertical subsidence and r the distance related to the center of the subsidence zone (Fig. 6). Then, from Equation 5, the normalized ground curvature (Cu(r)/Cumax) can be
calculated (Fig. 7), where Cumax is calculated using Equation 6 for a coefficient KR=0.15 (Cumax = 2.96×10⁻³).
Fig. 6 Vertical subsidence prediction a) Exponential functions b) Tangent hyperbolic functions c) Other functions
Fig. 7 Results of the curvature profiles a) Exponential functions b) Tangent hyperbolic functions c) Other functions A comparison of the theoretical profiles of the ground curvature (Fig. 1, Fig. 4), shows that the tangent hyperbolic functions give more realistic profiles of the ground curvature profile (Fig. 7). Consequently, the tangent hyperbolic equation developed by King and Whetton (1957) in the United Kingdom (Equation 10) is selected for the calculation of the horizontal ground strain.
Equation 10 max 2 2 ) , ( )), / ) 2 (( 1 .( 2 ) (r S Tanh W r D r x y x y V = + − = +
With x and y the cartesian coordinates related to the subsidence center and Smax the maximum vertical subsidence. In the cases of critical or super-critical mining operation Smax can be calculated with Equation 2..
4. Theoretical case study
The software and the methods presented above are applied to a theoretical case study in a small city in the Lorraine iron-field, in the North-East part of France. A theoretical circular but realistic subsidence event is simulated and the damages are assessed with the different methods presented in section 2. Required input data are Smax (or K, O and τ by application of Equation 10), εmax, H, γ, Kε, W, as well as the coordinates of both the center of the subsidence area and all of the buildings in the city.
4.1.
Presentation of the cityentire city at an average depth of 130 m, a thickness of 7 m and an extraction ratio of 40% (Al Heib 2002).
Many districts are workers’ housing estate with the same building types. Most of the buildings are masonry buildings with one or two floors and many of them are connected. Few of buildings are more recent with concrete materials and a global better quality. A database was developed that contains information about 829 buildings. Information is both quantitative and qualitative in order to make possible the use of each method of building damage assessment: length, height, foundation typology, material, shape… (Fig. 2, Saeidi 2010).
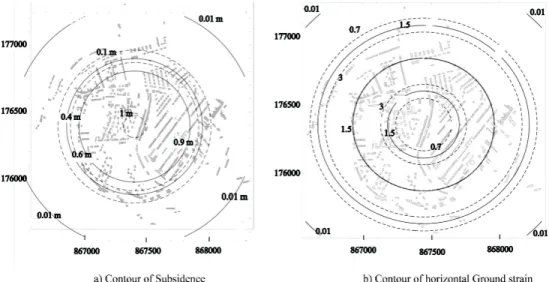
Mining subsidence is modeled with Equation 10. The model consists of a circular subsidence, whose center is located in the center of the city (coordinates 867465, 176358), with a width W of 300m, an influence angle γ of 30° and a maximum of horizontal ground deformation εmax of 4 mm/m. Both the vertical subsidence and the horizontal ground strain are shown in Fig. 8.
Fig. 8. Iso values of the vertical subsidence (a) and horizontal ground strain (b).
4.2.
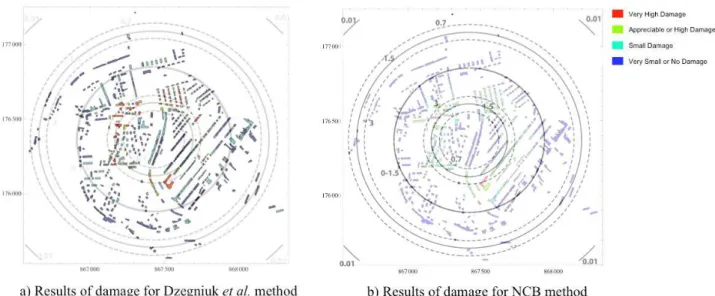
ResultsThe results given by the damage software are used to compare the different damage assessment methods. As examples of the results given by the Dzegeniuk et al. method (1997) and the National Coal Board method (NCB 1975) are shown on Fig. 9. The results are not directly comparable.
Fig. 9. Damage assessment given by a) the Dzegniuk et al. method, b) the National Coal Board method.
To facilitate the comparison of the five empirical methods of building damage assessment, results are summarized, for each method, through a histogram of the damage distribution and the average and standard deviation of the damage in the city (Equation 11, Equation 12). Both of these two indicators are used in earthquake engineering (Lagomarsino and Giovinazzi 2006). Equation 2
N
D
n
N i i i D∑
==
1µ
Equation 3 1. ( ) 1∑
= − = N i i D D D N µ σWith µD and σD the mean and standard deviation of building damages in the city, ni the number of buildings into the damage class Di (from 1 to 4) and N the total number of buildings (N = 828 building in this example).
Fig. 10. Histogram of damage categories frequency for the case study obtained by the different empirical methods of damage assessment.
As regard to Fig. 10, we first observe that the results of four methods (NCB 1975), Wagner and Schumann (1991), Dzegeniuk et al. (1997) and Yu et al. 1988) are globally close to each other with many damaged buildings in class 1 and a decreasing number of damaged buildings in higher damage classes. The number of buildings in class 3 or 4 is relatively small and less than 100 except in Kiwatek method (1998). This method also gives the greatest number of damage buildings in class 2 while the other methods put the greatest number in class 1. If we compare the global damage indicators (mean and standard deviation), the Kwiatek (1998) method gives a greater mean of damage (2.2), while other methods give a value between 1.2 and 1.6. The standard deviation is also higher in the Kwiatek method.
The NCB (1975) and Wagner and Schumann (1991) methods give very similar results because they both use the same criteria (length of building and horizontal ground strain) and because the two methods are almost identical (Fig. 3). The methods of Dzegeniuk et al. (1997) and Yu et al. (1988) give less damage in class 1 and more damage in class 2 than the two former mentioned. This difference can be explained by the number of different criteria and differences on the threshold values of the horizontal ground strain used in these methods.
If we consider that a method giving a higher mean of damage is a “safer” method, we can classify the methods from the safest to the least safe. The Kwiatek (1998) method appears then the safest, then come the Dzegeniuk et al. (1997), Yu et al. 1988, Wagner and Schumann (1991) and NCB (1975) methods.
5. Comparison with real damage monitoring
A comparison of results given by each method with observed damages in the Lorraine region in France has been considered. Between 1996 and 1999, five accidental subsidence events occurred, 30 to 50 years after the extraction stopped (two in the city of Auboué in 1996, two in Moutier in 1997, and the last one in Roncourt in 1999) and caused damage to more than 500 dwellings (Deck, (2002)). Many other cities and villages in Lorraine may still be affected by this phenomenon (Deck 2002). Information about the damage of each building has been collected for three of these events (Roncourt, Moutier-Haut and Moutier-Stade). A set of 178 buildings as been investigated in order to assess their damage. The Fig. 11 presents the percentage of buildings damage in each class of damage. A comparison of this result with the previous histograms (Fig. 10) shows that the Dzegeniuk et al. (1997) method seems more realistic. Both the mean of damage and percentages are closed.
Reasons of this result may be explained with comparisons of the methods. The NCB and Wagner and Schuman methods are very simplistic methods and only considered the length of buildings. The Kwiatek method considers a very large number of parameters, which determination may be complex and involves some uncertainties. In contrary, the Dzegeniuk et al. (1997) methods appears more realistic, probably because it uses a set of relevant and efficient parameters.
Fig. 11: Obseved buildings damage in lorrain region
6. Conclusion
In order to compare the existing empirical methods of building damage assessment due to mining subsidence, a software has been developed that incorporate a number of existing damage assessment methods. Five methods were investigated: the NCB (1975), Wagner and Schumann (1991), Yu et al. (1988), Dzegniuk et al. (1997), and Kwiatek (1998) methods. Because these methods are not directly comparable due to the use of different damage levels, different criteria, and different threshold values, modifications have been implemented for harmonization, so that all methods consider four building damage levels, four building vulnerability classes, and 16 threshold values of the horizontal ground strain.
A theoretical case study is presented concerning a city subjected to mining subsidence hazard in the French Lorraine iron-ore field. Subsidence was modeled with empirical functions and the developed software have been first used to plot the iso-contours of the horizontal ground strain and the vertical displacement. The damage according to five of the methods has been assessed using a database about the buildings in the city.
Results showed that NCB (1975), Wagner and Schumann (1991), Yu et al. (1988) and Dzegeniuk et al. (1997) methods yield comparable expected damage. On the contrary the results of Kwiatek (1998) method led to significantly greater expected damages than the other methods. Concerning the mean expected damage, the methods may be classified on a safety scale, the safest being the Kwiatek (1998) method, followed by the Dzegeniuk et al. (1997), the Yu et al. (1988), the Wagner and Schumann (1991), and the NCB (1975) methods.
A comparison of results with the statistical distribution of damage in the French iron-ore field shows that the Dzegeniuk et al. (1997) method appears more realistic.
Notation
K: Constant coefficient for determining maximum subsidence
τ: Extraction ratio for room and pillar mining method
γ : Influence angle
Smax: Maximum value of the vertical subsidence for critical and super-critical mining surface. S: Value of subsidence at each point of the surface
r: The distance in relate to subsidence center Cu(r): The ground curvature in each point of surface
Cumax: The maximum of ground curvature in subsidence basin
KR: The constant coefficient for calculation of maximum of ground curvature Kε: The constant coefficient for calculation of maximum of horizontal ground strain.
ε: Horizontal ground strain
Ksite: the constant coefficient in relation of horizontal grounds strain and ground curvature V: The function of determination of vertical subsidence
µD: The mean of damage in city
σ D: The standard deviation of damage in city R : subsidence radius [m]
D : Distance between the boundary of mine panel and boundary of subsidence curve [m] W: the width of mine panel
R: Subsidence radius
δ: Angle of break
7.
Appendix.Table 6. Yu et al. (1988) method (the number of points for each parameter is marked by (→); N = No damage, Ar = Architectural damage, F = Functional damage, St = Structural damage).
Foundations: Isolated footing (→ 1) ; Continuous footing (→ 4) ; Raft foundation (→ 8) ; Buoyancy foundation (→ 16)
Superstructure Material: Brick, Stone and Concrete (→ 4); Reinforced concrete (→ 4) ; Timber (→ 6) ; Steel (→ 8) L/R ratio (L: length of the building and R: Radius of the subsidence): <0.1 (→ 8) ; 0.1-0.25 (→ 6) ; 0.26-0.5 (→ 4) ;
>0.5 (→ 2)
H/L ratio (H: height of the building and L: length of the building): <1 (→ 8); 1-2.5 (→ 6); 2.6-5 (→ 4) ; >5 (→ 2) Building classification Total Rating 7-10 11-20 20-30 30-40 Vulnerability class C1 C2 C3 C4 Damage category N Ar F S N Ar F S N Ar F S N Ar F S Thresholds value horizontal strain [mm/m] < 0 .5 0 .5 -1 .5 1 .5 -3 > 3 < 2 ? ? ? < 3 ? ? ? < 4 ? ? ?
Table 7. The “Bhattacharya and Singh” method. Building classification
Brick and masonry structures/brick bearing walls /low rise structures C1
Timber frame structures C3 Massive structures of considerable rigidity/central core design C4
Threshold values of horizontal ground strain for damage evaluation
Damage category Architectural Functional Structural
Building class C1 C2 C3 C4 C1 C2 C3 C4 C1 C2 C3 C4
Threshold values of horizontal strain
0.5 ? 1 ? 1.5-2 ? ? ? 3 ? ? ?
Table 8. Dzegniuk et al. (1997) method (the number of points for each parameter is marked by (→)). Building Length (m) : ≤10m (→ 4) ; 11-15 (→ 7), 16-20 (→ 11) ; 21-25 (→ 16) ; 26-30 (→ 22) ; 31-35 (→ 29) ;
36-40 (→ 37) ; >40m (→ 42)
Building solid shape: Regular, compact (→ 0) ; Little dismembered (→ 3) ; Well dismembered (→ 6) ; Regular, vast (→ 6) ; Dismembered, vast (→ 8)
Building foundation: On flat level, buildings with or without basement (→ 0) ; On uneven elevation, surface (→ 3) ; On uneven elevation, surface with partial basement (→ 6) ;As above but with a passage gate (→ 8) Building ground foundation: Compressible (→ 0) ; Low-Compressible (→ 4) ; Uncompressible (→ 12)
Building Structure: Rigid (→ 0) ; Low-Rigid (→ 4) ; Non-Rigid (→ 8)
Existing protection for mining operation effects: Bolting (→ 0) ; Fractural bolting (→ 4) ; None (→ 6) Technical condition of the building: Good (→ 0) ; Average (→ 4) ; Bad (→ 12)
Building classification Total Score ≥48 37-47 28-36 21-27 ≤20 Vulnerability class C1 C2 C3 C4 C5 Horizontal ground strain 1.5 mm/m 1.5-3 mm/m 3-6 mm/m 6-9 mm/m >9 mm/m
Damage category Very slight or negligible
Slight damage
Moderate Severe damage
Very severe damage
Table 9. The Kwiatek (1998) method (the number of points for each parameter is marked by (→));
Building Length (m) : ≤10m (→ 2) ; 11-15 (→ 4), 16-20 (→ 7) ; 21-30 (→ 15) ; 31-40 (→ 20) ; 41-50 (→ 25) ;
51-60 (→ 30) ; 61-70 (→ 35) ; 71-80 (→ 40) ; 81-90 (→ 45) ; >91m (→ 50)
Building solid shape: Regular, compact block (→ 0) ; Regular, lying block (→ 2) ; Little dismembered, compact
block (→ 4) ; Well dismembered, lying block (→ 6) ; Well dismembered, compact block (→ 8) ; Well dismembered, lying block (→ 10)
Building foundation: On flat level, buildings (→ 0) ; On uneven elevation, surface (→ 5) ; Foundation with
carriage entrance, without cellar (→ 8)
Building ground foundation: Non rocky soils, except stones and rocks (→ 0) ; Backfilled ground (→ 4) ;
Foundation on a layer of amortization (→ 6) ; Stones and rocky soils, Except rock solid or slightly cracked (→ 10) Building Structure:
A - Foundation materials: Reinforced concrete (→ 0), Concrete (→ 2) ; Masonry brick (→ 3) ; Stones (→ 4)
B - Walls of cellars: Concrete (→ 0) ; Masonry brick, locks or hollow concrete blocks (→ 1) ; Masonry stone,
blocks hollow of reinforced concrete (→ 3)
C - Floor of the lowest storey: Reinforced Concrete, Ackermann, with crowns made of reinforced concrete (→ 0) ;
width of segment) (→ 2) ; Flooring with segments on steel beams, l/L<1/10 (→ 4) ; Wood beamed (→ 3) ; Vault without tie-beam, f / L> 1 / 5 (→ 4) ; Vault without tie-beam, f / L< 1 / 5 (→ 8)
D – Lintels: Reinforced Concrete (monolithic or prefabricated) or on steel beams (→ 0) ; Bricks, plan (→ 2) ;
Lintel arc, f/L>1/5 (→ 3) ; Lintel arc, f/L< 1/5 (→ 5)
E – Other elements of building: Arcs in bearing walls, L> 1.5 m (without tie beam) f/L>1.5 (→ 4) ; Arcs in bearing
walls, L> 1.5 m (without tie beam) f/L>1.5 (→ 8) ; Height of building blocks are different (→ 2) ; Level of floors are different (→ 3)
Existing protection for mining operation effects: Building protected at all foundations and floors (→ 0) ;
Building protected at the level of some foundations and floors (→ 2) ; Building protected at every floor (→ 8) ; Building protected in some floors (→ 10) ; Protection fragmented (→ 12) ; Without protection (→ 15)
Technical condition of the building:
Building State from naturally wear: Good (→ 0) ; Satisfactory (→ 1) ; Medium (→ 2) ; Bad (→ 3) ; Very Bad (→ 5)
Pre damage of building: No degradation in the construction (→ 0); Cracks <1 mm (→ 2); 1<Cracks <5 mm (→ 5); 5<Cracks <15 mm or gap of out off plumb <25 mm (→ 8) ; 15<Cracks <30 mm or displacement or gap of out off
plumb >25 mm (→ 12)
Others: buildings that are not intended for permanent residence without heating (for example, box room, cowshed, barn) (→ -12) ; buildings for the temporary stay of people (workshops, garages) (→ -6) ; public buildings for the
permanent or temporary residence of large groups of children, people, handicapped (→ 12) ; buildings with finishing equipment or sensitive to the influence of the exploitation (→ 6)
Building classification Total Score ≥60 47-59 34-46 21-33 ≤20 Vulnerability class C0 C1 C2 C3 C4 Horizontal ground strain ≤0.3 mm 0.5-1.5 2-3 4-6 mm 6-9 mm
Damage category No damage scale is given in the method.
8.
ReferencesAl Heib M, Linkov AM, Zoubkov VV (2001) On numerical modeling of subsidence induced by mining. In: Proceedings of the ISRM Regional Symposium EUROCK, Espoo/FINLAND. ISRM, pp 795-799
Al Heib M (2002). Prévision des conséquences des affaissements miniers dans basin ferrifère Lorrain. Rapport DRS-02-26146/RN02, INERIS, Nancy
Al Heib M, Josien JP, El Shayeb Y (2003) Paramètres d’affaissement pour la hiérarchisation des zones à risque dans le bassin ferrifère lorrain. Après –mines, Nancy.
Al Heib M. (2008). State of the art of the prediction methods of ground mouvements ( subsidence and sinkhole) for the mines in France. Coal geology research progress, editor Thomas Michel and Hugo
Bhattacharya S, Singh MM (1984) Proposed criteria for subsidence damage to buildings. Rock mechanics in productivity and protection, 25th Symposium on rock mechanics, pp 747-755
Boone, SJ (1996) Ground-movement related building damage. J. Geotech. Eng ASCE 122, 11:886-896
Boscardin MD, Cording EJ (1989) Building response to excavation – induced settlement. J. of Geotechnical Engineering. 115: 1-21
Northern Appalachian coal field. First int. conf. on stability in underground mining, chapter 47, pp 1022-1046
Burland JB (1997) Assessment of risk of damage to buildings due to tunneling and excavation. Earthquake geotechnical engineering, editions Ishihara, Balkema, pp 1189-1201
Deck O (2002) Etude des conséquences des affaissements miniers sur le bâti. Doctorate thesis, INPL University, Nancy, France.
Dzegniuk B, Hejmanowski R, Sroka A (1997) Evaluation of the damage hazard to building objects on the mining areas considering the deformation course in time. Proceedings of Xth International Congress of the International Society for Mine Surveying, Fremantle, Western Australia
Finno, RJ, Voss FT, Rossow E, Tanner B (2005) Evaluating Damage Potential in Buildings Affected by Excavations. Journal of Geotechnical and Geoenvironmental Engineering 131, 10:1199-1210
HAZUS (1999) Multi-hazard Loss Estimation Methodology Earthquake Model, Technical and User Manuals. Federal Emergency Management Agency, Washington, DC , chapter 2.
Ji-Xian C (1985) The effects of mining on buildings and structural precautions adopted. 3e Int. Conf. Large ground movements and structures (Cardiff), 404-419
Karmis M, Triplett T, Schilizzi P (1984) Recent development in subsidence prediction and control for the eastern U.S coalfield, 25 th. Symp. On rock mechanics, pp 713-721.
Kratzsch H (1983) Mining Subsidence Engineering. Springer-Verlag.
Kwiatek J (1998) Protection of constructions on surface ground mine. (Traduction in poland “Ochrona objektow budowlanych na terenach gorniczyych”). GIG, Katowice.
Lagomarsino S, Giovinazzi S (2006) Macroseismic and mechanical models for the vulnerability and damage assessment of current buildings. Earthquake Engineering 4: 415–44.
National Coal Board (1975) Subsidence engineering handbook. chapter 6, pp 45-56
Orchard RJ, Allen WS (1965) Ground curvature due to coal mining. Chartered surveyor 97: 622-631.
Pellisier JP, Williams AAB, Lunt BG (1992) Predicting and assessing undermining induced distress in typical south African buildings. COMA, Symp. on construction over mined areas, Pretoria, South Africa, pp 117-123.
Saeidi A (2010). La vulnérabilité des ouvrages soumis aux aléas mouvements de terrains : développement d’un simulateur de dommages. Doctorate thesis, Institut National Polytechnique de Lorraine, Nancy, France.
Saeidi A, Deck O, Veredel T (2011) Development of building vulnerability functions in subsidence regions from analytical methods. Géotechnique Journal doi: 10.1680/geot.9.P.028
Skempton AW, MacDonald DH (1956) Allowable settlement of building. Proc. INSTN. Civ. Engrs, 3, 5: 727-768. Timoshenko S (1957) Strength of material-part I. D. van Nostrand Co, London.
Van der Merwe JN, Madden BJ (2002) Rock engineering for underground coal mining. The south african institute of mining and metallurgy, Chapitre 9
Wagner H, Schumann HER (1991) Surface effect of total coal seam extractions by underground mining methods. J.S.Afr.Inst.Min.Metal. 91: 221-231
Whittaker BN, Reddish DJ (1989) Subsidence: Occurrence, Prediction, Control. Editions Elsevier. Wolfram S (2009) Mathematica software version 6. Wolfram Research, Inc. USA.
Yu Z, Karmis M, Jarosz A, Haycocks C (1988) Development of damage criteria for buildings affected by mining subsidence. 6th annual workshop generic mineral technology center mine system design and ground control, pp 83-92.