Determinants of Physicians' Decisions to Specialize
31
0
0
Texte intégral
(2) CIRANO Le CIRANO est un organisme sans but lucratif constitué en vertu de la Loi des compagnies du Québec. Le financement de son infrastructure et de ses activités de recherche provient des cotisations de ses organisationsmembres, d’une subvention d’infrastructure du ministère de la Recherche, de la Science et de la Technologie, de même que des subventions et mandats obtenus par ses équipes de recherche. CIRANO is a private non-profit organization incorporated under the Québec Companies Act. Its infrastructure and research activities are funded through fees paid by member organizations, an infrastructure grant from the Ministère de la Recherche, de la Science et de la Technologie, and grants and research mandates obtained by its research teams. Les organisations-partenaires / The Partner Organizations PARTENAIRE MAJEUR . Ministère des Finances, de l’Économie et de la Recherche [MFER] PARTENAIRES . Alcan inc. . Axa Canada . Banque du Canada . Banque Laurentienne du Canada . Banque Nationale du Canada . Banque Royale du Canada . Bell Canada . Bombardier . Bourse de Montréal . Développement des ressources humaines Canada [DRHC] . Fédération des caisses Desjardins du Québec . Gaz Métropolitain . Hydro-Québec . Industrie Canada . Pratt & Whitney Canada Inc. . Raymond Chabot Grant Thornton . Ville de Montréal . École Polytechnique de Montréal . HEC Montréal . Université Concordia . Université de Montréal . Université du Québec à Montréal . Université Laval . Université McGill ASSOCIÉ AU : . Institut de Finance Mathématique de Montréal (IFM2) . Laboratoires universitaires Bell Canada . Réseau de calcul et de modélisation mathématique [RCM2] . Réseau de centres d’excellence MITACS (Les mathématiques des technologies de l’information et des systèmes complexes). Les cahiers de la série scientifique (CS) visent à rendre accessibles des résultats de recherche effectuée au CIRANO afin de susciter échanges et commentaires. Ces cahiers sont écrits dans le style des publications scientifiques. Les idées et les opinions émises sont sous l’unique responsabilité des auteurs et ne représentent pas nécessairement les positions du CIRANO ou de ses partenaires. This paper presents research carried out at CIRANO and aims at encouraging discussion and comment. The observations and viewpoints expressed are the sole responsibility of the authors. They do not necessarily represent positions of CIRANO or its partners.. ISSN 1198-8177.
(3) Determinants of Physicians’ Decisions to Specialize* Robert Gagné, Pierre Thomas Léger‡ Résumé / Abstract Dans cette étude, nous analysons les décisions de spécialisation des médecins à l'aide de données portant sur la presque totalité des médecins canadiens en exercice au Canada entre 1989 et 1998. Contrairement à la plupart des études existantes, nous utilisons une mesure du revenu potentiel des médecins, selon qu'ils soient généralistes ou spécialistes, qui est véritablement exogène afin d'estimer l'effet du revenu sur les choix de spécialisation. De plus, notre procédure d'estimation nous permet de tenir compte des effets non pécuniers liés à certaines spécialités médicales (prestige, recherche scientifique, etc.) qui pourraient être corrélés avec les salaires. Nos résultats montrent que les médecins réagissent de manière significative au revenu potentiel au moment de choisir une spécialité médicale. En particulier, nos simulations révèlent que les provinces seraient en mesure d'accroître la proportion de diplômés en médecine choisissant une spécialité chirurgicale si elles augmentaient les tarifs pour les actes chirurgicaux.. In this paper, we study specialty physician decisions using several unique data sets which include information on almost all Canadian physicians who practiced in Canada between 1989 and 1998. Unlike previous studies, we use a truly exogenous measure of potential income across general and specialty medicine to estimate the effect of income on physicians’ specialty choices. Furthermore, our estimation procedure allows us to purge the income-effect estimates of nonpecuniary specialty attributes which may be correlated with higher paying specialties. Understanding the effect of potential income (and other variables) on choices is necessary if the desired mix across generalists and specialists as well as across specialties is to be achieved. Our results show that physicians respond to differences in income when making their specialty decisions. More specifically, our simulation exercise suggests that provinces could increase the proportion of graduates who select a surgical specialty by increasing the fees they pay to them. Mots clés : Choix de spécialisation des médecins Keywords: Physician Specialty Choice Codes JEL : I10, I18, J24, C30. * P. T. Léger thanks HEC Montréal (Fonds Mercure) and SSHRC for financial support. R. Gagné thanks FCAR (Quebec). We wish to acknowledge seminar participants at the SCSE annual meeting in Aylmer (Quebec), the Canadian Health Economics Study Group in Halifax, Peter Coyte, and Robert Clark. The usual caveats apply. ‡ Institute of Applied Economics, HEC Montréal, 3000 chemin de la Côte-Sainte-Catherine, Montréal (Québec),H3T 2A7, Canada and CIRANO; corresponding author: [email protected].
(4) 1. Introduction. Although health care constitutes an ever increasing share of public expenditures, in many countries, including Canada, complaints of longer waiting times and reductions in services are rampant. Many believe that the rationing of services is the result of physician shortages both in general care and in certain specialties. As a result, understanding how individual characteristics, institutional factors and, potential income di¤erences across specialties, impact physicians’ decisions to specialize and, conditionally, their choices among specialties, is important if we are to achieve the desired mix of physicians across general and specialty medicine as well as across di¤erent specialties. In particular, understanding whether or not, and to what extent, physicians respond to potential income di¤erences when making their specialty decisions is important if we are to consider ’income’ as a policy tool. Unlike previous studies, we use a truly exogenous measure of potential income across general and specialty medicine to estimate the e¤ect of income on physicians’ specialty choices. Furthermore, our estimation procedure allows us to purge the income-e¤ect estimates of non-pecuniary specialty attributes (such as status or research opportunities) which may be correlated with higher paying specialties. Several studies have examined the determinants of physician specialty choices. A number of these …nd that physicians react to di¤erences in income when making their specialty decision (Sloan (1970), Hadley (1975, 1977, 1979), Hay (1980, 1981), Hurley (1991)).. However, their elasticity. estimates are likely to be biased given that they use average income across specialties which may not (fully) account for unobserved di¤erences across physician pools such as productivity, skills, e¤ort or hours worked. In a recent paper, Nicholson (2002) estimates a model of physicians’ decisions to specialize using data from the 1992 National Resident Matching Program. He argues that capacity constraints in di¤erent residency programmes may yield inconsistent income elasticities. That is, although physicians may wish to react to di¤erences in expected income when choosing their specialty, their ability to do so may be limited by the availability of spaces in certain residency. 2.
(5) programmes. By using a data set which includes information on the physician’s desired specialty (which may not be the physician’s ultimate specialty), Nicholson …nds that medical students are very responsive to expected income di¤erences between specialties. Several limitations should, however, be noted. First, as in previous studies, expected income (conditional on a given specialty) is estimated without taking into account potential sample selection problems. Furthermore, elasticity estimates rely on the assumption that individual ability is uncorrelated with unobserved preferences for unmeasured non-pecuniary specialty attributes. In this study, we examine the determinants of specialty choices (both the decision to specialize and the choice among specialties) by addressing several of the limitations noted above. By using a unique data set which includes information on almost all Canadian physicians who practiced in Canada from 1989 to 1998, we attempt to identify the e¤ect of di¤erent characteristics (both personal and institutional) on physicians’ decisions to specialize and choices among specialities. Furthermore, the Canadian system, whereby physicians are paid on a fee-for-service basis, allows for a unique opportunity to estimate the e¤ect of potential income di¤erences across specialties on physicians’ choices without having to deal with selection issues. Since payments to physicians are based solely on the task performed and the physician’s specialty, and not on any other observed or unobserved individual characteristics, using such payments as proxies for potential income avoids the possible aforementioned bias when estimating income e¤ects. As a result, we are able to identify the e¤ect of income on the decision to specialize and the choice among specialties by exploiting the variation in exogenous ’fees’ across time, across provinces and across general and specialty care. Furthermore, because we identify the income e¤ect through variations in these exogenous fees, we avoid the potential bias which could be introduced if preferences for unmeasured specialty attributes are correlated with income. For example, if certain specialties exhibit both higher expected income and other unmeasured non-pecuniary bene…ts (such as prestige or a better research environment), then the income e¤ect estimates may be biased. However, because these non-pecuniary attributes are unlikely to change greatly over-time or across provinces, while the exogenous fees paid to 3.
(6) physicians do, using variations in income instead of di¤erences in levels, allows us to avoid this problem. Furthermore, we develop a two-stage model which allows us to control for both observable and unobservable characteristics which are speci…c to the physician’s market including rationing in residency programmes. The remainder of the paper is organized as follows. In section 2, data and summary statistics are presented. The theoretical model is presented in section 3. In section 4, we develop the empirical speci…cation and estimation strategy. Results are presented in section 5. Finally, conclusions are drawn in section 6.. 2. Data and summary statistics. The data set used in this paper is constructed from three main sources.1 The …rst, the Southam Medical Data Base, contains information on almost all Canadian Physicians who practiced in Canada at any time between 1989 to 1998.2 This data set contains information on the physician’s age, sex, year of graduation from medical school, the country of graduation, the medical school attended if the physician graduated from a Canadian University (and consequently the province of residence at the time of graduation), the practice specialty and, the physician’s self-identi…ed language. The second set of data (discussed in greater detail below) includes yearly, provincespeci…c information on the ’average cost-per-consultation’ (a measure of the fees paid to physicians per visit) for both general and specialty care. It also includes yearly, province speci…c information on hospitals, physicians, drugs and capital expenditures. These variables are used later as proxies for the ’state’ of the health care market in each province at the time of the physician’s specialty decision; variables which may in‡uence a physician’s decision to specialize and, his or her choice between surgical and non-surgical specialties. The third data set, from OECD health data …les 1. See Section 7 (Data Appendix) for a detailed description of the data. The initial data set contains information on all Canadian physicians who practiced in Canada at anytime between 1989 and 1998. Excluded from our study are physicians with incomplete …les and those who requested that their date of birth be removed from the data …le (via a formal request). We also exclude all physicians whose year of graduation was either (i) before 1975 or (ii) after 1991, because of estimation considerations discussed later on. 2. 4.
(7) (2000), includes information on the Canadian population and Canadian practising physicians. The model, presented below, is estimated using a sample of 30,184 physicians who practiced in Canada between 1989 and 1998 and whose year of graduation from medical school is between 1975 and 1991.3 As we are studying the decision to specialize and the choice among specialties by physicians at the time of graduation from medical school, we focus exclusively on physicians who graduated from Canadian Universities.4 Descriptive statistics on physicians, including the number (and share) of females and males, and, the number (and share) of Francophones and Anglophones per graduating cohort are presented in Table 1. In our sample of physicians, 76.3 per cent identify English, rather than French, as their spoken language and 63.4 per cent of the population studied are male. However, as expected, the percentage of males per graduating cohort falls substantially over time.. For example, women constitute 44.9 per cent of the graduating class in 1993 but. only 22.9 per cent in 1975. In Table 2, we present the number (and share) of physicians who specialized, and conditionally, the number (and share) of specialists in surgical and non-surgical …elds (per graduating cohort). It is also important to note that, in our sample, 49 per cent of physicians are coded as Specialists. Furthermore, among Specialists, 26.1 per cent are coded as surgical specialists.5 Summary statistics suggest that many de…ning characteristics of the physician pool -including the number (and share) of females, the number (and share) of physicians who chose to specialize, and the number (and share) of specialists who chose a non-surgical rather than a surgical specialty 3 Although the original data set is a panel with information for each physician on each year between 1989 and 1998, one single year of information is contained in the data set used for estimation. The year of information is irrelevant given that we use variables which are time invariant (for example: the age of the physician at graduation, the specialty practiced and the medical school he or she graduated from). 4 These numbers do not re‡ect all physicians who graduated from Canadian Universities between 1975 and 1991, nor can we be sure that they represent a random sample of such physicians given that a Canadian physician may have emigrated and that the probability of emigrating is unlikely to b e independent of physician characteristics (such as specialty type). 5 Physicians are coded as surgical specialists if they identi…ed their specialty as: general surgery, cardiovascular and thoracic surgery, neurosurgery, obstetrics and gynecology, ophthamology, otolaryngology, orthopedic surgery, plastic surgery, or urology. Physicians are coded as non-surgical specialists if they identi…ed their specialty as: internal medicine and sub-specialties, dermatology, neurology, pediatrics, physical medical and rehabilitation, psychiatry, public health, emergency medicine, anesthesia, nuclear medicine, medical microbiology, pathology, radiology, occupational medicine, medical biochemistry, medical scientist or medical genetics. 5.
(8) - have changed over time. The model, presented below, will attempt to identify the determinants of these changes. We use both provincial and national level variables which may in‡uence physicians’ decisions to specialize and choices of specialty. Although the most natural exogenous measure for physicians’ potential incomes would be to use provincial fee-for-service schedules across time for both generalists and specialists, what constitutes a consultation (i.e., what is covered by a particular fee) lacks consistency across provinces and has changed considerably over time. As a result, we use the average-cost-per consultation for generalists and specialists which explicitly deals with these inconsistencies.6 That is, they are based on well de…ned consultations which are consistent across time and across provinces. The average-cost-per-consultation, is simply the total expenditures paid to Generalists (GPs) or Specialists for well de…ned consultations divided by the number of such consultations. It is important to emphasize here that using an average-cost-per consultation, instead of average within-specialty income, avoids potential selection biases which have lead to much debate on the validity of prior results. That is, average incomes in certain specialties may be higher than in others, not because they o¤er higher incomes per say, but rather, because they attract individuals who have unobserved di¤erences such as productivity or work e¤ort (Bhattacharya, 1998). Given that physicians are in fact paid on a fee-for-service basis, the Canadian system allows for the estimation of the e¤ect of income on specialty choice without having to explicitly control for selection issues. Table 3 reports summary statistics for the average cost-per-consultation for GPs in each province across time (in 1995 dollars). Similarly, Table 4 reports summary statistics for the average cost-perconsultation for Specialists in each province across time. These …gures show considerable variation in the cost-per-consultation within and across provinces.7 Variation within and across provinces of these variables, as well as variation in provincial expenditures on physicians, hospitals, capital, 6. These data were constructed using the National Physician Database in order to deal explicitly with the consistency issues discussed above. We thank the Canadian Institue for Health Information (CIHI) for providing these data. 7 We thank CIHI for providing these data.. 6.
(9) and drugs, will be used to identify the e¤ect of both pecuniary and non-pecuniary bene…ts related to specialization. We include the latter set of variables since a physician who observes that his or her province has increased such expenditures (hospital, capital, drug, and/or physician), may view it as an increased investment in the health care system and thus may make specializing more (or less) attractive.. 3. Theoretical model. In this section, we present a theoretical model which forms the basis of our estimation strategy. A utility maximizing physician must make a decision on whether or not to specialize and conditionally, which specialty to choose. Both decisions are made simultaneously at the time of graduation (that is, at the time of graduation, the physician either begins to practice or decides to undertake further studies). We subdivide the ’specialty type’ into two broad types - surgical and non-surgical. We do this to re‡ect the within specialty-type similarities in training and requirements and because of limitations in the data. More formally, at the time of graduation from undergraduate medical training (t = 1), physician i in province j must choose his or her specialty type s (no specialty s = 0, non-surgical s = 1, and surgical s = 2), hours worked h and consumption C (for t = 1; :::; T) in order to maximize his or her expected discounted life-time utility:. max si ;hit. T X. s ¯ t¡1U (l it; Cit ; Bjt );. (1). t=1. where l denotes leisure and where B denotes non-pecuniary bene…ts associated with specialty s (including status and research opportunities). The budget constraint at time t is given by:. Cit = hit wsjt ¡ Kits ;. (2). where w denotes the wage rate which is specialty s and province j speci…c and where K s denotes the. 7.
(10) …xed costs associated with subsequent training if the physician has decided to become a specialist (i.e., if s = 1 or 2). Leisure, is de…ned by: lit = 1 ¡ hit ;. (3). where total time available is normalized to 1: The wage rate (or fee-per-consultation) is given by:. wjst = w(Pj ; s; t);. (4). which is province j, time (year) and specialty s speci…c. Notice that the wage rate (a fee per hour worked or per consultation) is independent of the physician’s personal characteristics (i.e., is exogenous to potentially unobserved characteristics) and re‡ects the fee-for-service setting in Canada. It is important to consider that a physician who decides to specialize must incur a …xed cost which includes forgone income as well as training costs. As a result, K is de…ned as: 2. 3 b it if s = 1 and t = 1; :::; t1 K e it if s = 2 and t = 1; :::; t2 5 ; Kits = 4 K 0 if s=0. (5). where the …xed cost is dependent on the type of specialty (if any) and the amount of years in training (ts ). In order to solve the model, the physician will compare the lifetime utility across the three di¤erent scenarios and choose the specialty which yields the largest lifetime utility at optimally chosen hours of work and consumption. That is, physician i will choose specialty s¤ such that. V s¤ = argmax V s (wsjt ; Kits jXit ; j); s. (6). where V s is the indirect utility function associated with specialty choice s. We take the decision to specialize and the choice among specialties as a once-and-for-all decision to re‡ect the fact that. 8.
(11) transiting from general care to specialty care during the course of a physician’s career is a rare occurrence and to simplify the model. Several comparative statistics are worth mentioning. First, if potential earnings increase under a particular practice type (relative to the other 2 practice types), the probability that the physician will choose that specialty increases. Thus, we should see the likelihood of specializing increase as specialty average-cost-per-consultation increases. Similarly, if the …xed cost associated with a particular specialty increases, the probability that the physician will choose that specialty will decrease.. Thus, we expect that women (because of child bearing and rearing costs) and older. physicians (because of shorter careers) should be less likely to specialize.. 4. Empirical Model. In this section, we present an econometric model which is consistent with the theoretical model presented above. We de…ne the utility for physician i who chooses specialty choice s as:. Uits = Xit¯ sj + Wjts °st + µsj + ®sjt + "sit. (7). where the province is denoted by j = 1; ::; J; the year of graduation is denoted by t = 1; :::; T and, the individual is denoted by i = 1; :::; nj ; Xit denotes a vector of observable individual characteristics including the physician’s age at graduation, sex, medical school attended and language spoken; Wjts denotes all observable characteristics which are province and specialty-type speci…c including the wage rate as well as provincial expenditures on drugs, capital, hospitals and physicians.8 We divide the unobserved component of the utility function into three di¤erent terms: (i) µsj which represents a non-pecuniary unobserved province-specialty speci…c component (such as status), (ii) ®sjt which represents unobserved province-time speci…c e¤ects, and (iii) "sit which represents an iid error term. 8. Although wages in competing markets (i.e. di¤erent provinces and abroad) may in‡uence a physician’s decision to specialize and choice of specialty, our estimates are based solely on the e¤ect of changes in fees in the province in which the physician graduated. In a new paper, we are examining how physicians in one jurisdiction may b e in‡uenced by fees in other jurisdictions in both their decision to specialize and their choice to immigrate.. 9.
(12) Thus, the probability that physician i in province j will choose specialty s is given by:. Pr(Uits > Uitk ) for all other k 6= s. (8). Although we do not observe the utility associated with each alternative for each physician across time, we do observe the physician’s choice. From this, we could estimate the model using a Multinomial Logit approach for all individuals of the same province (i.e., we could estimate the model J times). Given that the model can be estimated separately for each province, we could rewrite (7) to include a time-dummy variable in order to deal with the component which is common to all individual physicians of specialty s of the same province (®sjt ). That is, we could rewrite (7) as:. Uits = Xit ¯ sj + Wjts °st + Asjt ¨(t) + µsj + "sit :. (9). where Asjt represents the province-time speci…c e¤ect for specialty s. However, by including such an e¤ect, (9) would no longer be estimable (identi…ed) since it also includes observable variables which are province-time speci…c for specialty s (Wjst). Because of this, we develop a two-stage approach for estimating the model where we …rst specify the utility associated with specialty s at time t in province j for individual i as:. esjt¨(t) + µsj + ²sit : Uits = Xits ¯ sj + A. (10). Note that in (10) we omit all observable province-time-speci…c variables (i.e., we omit the Wjts vector) and include instead a set of year dummies ¨(t) (one for each specialty in each year), i.e., the year dummies subsume all variables (both observable and unobservable) which are common to a given specialty in a given province in a given year. As previously noted, we include a µ sj component in the error term to capture unobserved non-pecuniary specialty-speci…c bene…ts which are constant over time such as status. Given that we include only individuals of the same province and that the 10.
(13) unobserved component µsj is constant over time, it becomes part of the estimated constant term. Finally, in (10) ²sit denotes an iid error term which may include unobserved physician characteristics such as ability.9 The estimation strategy is as follows. We …rst estimate (10) separately for each province with a medical school using a Multinomial Logit. In the Multinomial Logit speci…cation we assume that the unobserved utility associated with each specialty is a function of individual characteristics (Xit) including the individual’s age at the time of graduation (and the square of the age at graduation), the sex, the medical school attended, and the language spoken.. The age at graduation and its. square are included to re‡ect the fact that sunk costs associated with specialization are likely to be more important for older physicians since they have fewer years of practice to recover such costs as well as potentially higher opportunity costs due to such things as familial obligations. The sex of the individual is included to capture both potential di¤erences in opportunities to specialize, di¤erent sunk costs (for example due to childbearing and rearing) and preferences. We also include language to re‡ect potential di¤erences in opportunities and preferences.10 Furthermore, we include the medical school attended as it may capture, among other things, the potential di¤erences across training opportunities (for example, di¤erences in availability in residency programmes). As noted es above, the dummy variables ¨(t) are included (setting A j t=1975 = 0 for identi…cation purposes). to capture the manner in which elements which may di¤er across provinces and across time can in‡uence the physician’s decision to specialize and choice of specialty. These variables could include both pecuniary as well as non-pecuniary bene…ts which change over time; some of which are observable to the econometrician and some of which are not. Given that we re-estimate the model separately for each province, all elements which are specialty and time speci…c, are captured in the ¨(t) terms; these elements could include non-pecuniary elements such as the working environment, resources available, as well as rationing in physician spe9. 10. As long as unobserved ability is uncorrelated with our explanatory variables, no bias is introduced by its omission. A language dummy is included only for Quebec, Ontario and Manitoba residents.. 11.
(14) cialty programmes (we return to the issue of rationing in greater detail below). By doing so, we es (one per year per specialty for each province). obtain consistent estimates for each A jt. In the second stage of the model, we decompose the ’year e¤ects’. That is, we wish to identify. how variations across provinces and across time in variables such as the proxies for fees paid to GPs and Specialists can help explain physicians’ decisions to specialize as well as choices among e1 and Ae2 (denoted A b1 and Ab2 ) in (10), specialties. From the Multinomial Logit estimates of A jt jt jt jt we next estimate:. and:. b1j t = Wj1t° 1 + ¹1jt A. (11). Ab2j t = Wj2t° 2 + ¹2jt:. (12). b1 and A b2 are both vectors of length J ¤ T (where J denotes the total In (11) and (12), A jt jt. number of provinces with a medical school and T denotes the total number of years in our sample). and where superscripts 1 and 2 denote the choice of a non-surgical and surgical specialty respectively. Furthermore, the vector Wjts includes a list of observable province-time speci…c variables and national-time speci…c variables which may a¤ect a physician’s decision to specialize and his or her choice of specialty including: (i) the ratio of the average cost-per-consultation for GPs and the average cost-per-consultation for Specialists11 ; (ii) provincial wide macro level health care variables including total hospital expenditures, total capital expenditures, total drug expenditures, and total physician expenditures; and (iii) Canadian-wide macro level variables including the proportion of GPs and Specialists per 1000 population in Canada. All of these variables are included to capture 11 It is likely that the average-cost-per-consultation (ACPC) does not fully re‡ect the potential net-income in each specialty. That is, although the ACPC may re‡ect the payment received for a consultation by a specialist, it does not take into account expenses incurred by the physician per consultation. Given that these expenses are likely to be di¤erent for generalists and specialists, it would seem reasonable to construct a net-cost-per-consultation variable. However, this is not necessary in our setup as our estimation strategy exploits the variation in these variables overtime (i.e., relative to a base year). Thus, as long as expenses vary as a proportion of the cost-per-consultation, the average-cost-p er-consultation remains a valid proxy for potential income.. 12.
(15) the di¤erences in the health care market conditions across time at the provincial level as well as at the national level. In the above discussion, we did not explicitly consider rationing in specialty residency programmes. As pointed out by Nicholson (2002), residency positions are often rationed and as a consequence, physicians may not be able to enter the specialty which would yield them the highest utility. Although rationing may be an important issue, it is unlikely to play a large role here given that we aggregate all non-surgical specialties and aggregate all surgical specialties. Consequently, the probability that a physician who is not admitted into a particular surgical (non-surgical) specialty is unable to specialize in any surgical (non-surgical) specialty should be relatively small. Nonetheless, our estimation strategy does partially control for any remaining rationing in residency programmes. If rationing is province-specialty speci…c (i.e., it is constant across time within a province), then estimates of the Asjt will not be contaminated by rationing since they are estimated bsjt = Asjt ¡ Aj;1975 ). However, if rationing varies greatly relative to the base year of 1975 (i.e., A. bsjt parameters likely capture some of the e¤ect of rationing. across time within a province, then the A Given that the available spaces in residency programmes are negotiated with the federal government. and do not vary much over time, it is likely that most of the rationing is in fact province-specialty speci…c. Another important issue is the possibility that earnings by specialty are correlated with unobserved non-pecuniary specialty-attributes (such as status).. That is, physicians may be more. likely to specialize in higher paying specialties, not exclusively because they o¤er higher expected incomes but, because they also o¤er other non-pecuniary bene…ts such as status or a challenging work environment. If this is the case, then income e¤ects may be biased. This, however, is unlikely to be an issue in our setup as we identify the income e¤ect through variations in the ratio of exogenous fees across provinces and across time. These variations are unlikely to be correlated with non-pecuniary bene…ts, given that non-pecuniary bene…ts are relatively stable across time and across provinces and controlled for in the µsj term. 13.
(16) In the above speci…cation, we. assume that ¹1jt. and. ¹2j t. follow a N(0; -) where - =. ·. ¾21 ¾1;2 ¾2;1 ¾22. ¸. :. Given that we use the same set of explanatory variables in both regressions, we run OLS on both equations controlling for autocorrelation using the Cochran-Orcutt procedure assuming an AR(1) process.. 5. Results. In the following section we report results from the above model, including the e¤ect of individual characteristics, institutional factors and potential income, on physicians’ decisions to specialize and choices among specialties.. In section 5.1 we simulate the e¤ect of an increase in cost-per-. consultations for specialists on these decisions.. 5.1. Estimation Results. The results from the …rst-stage Multinomial Logit model are presented in Tables 5 and 6. Table 5 presents the estimation results for the probability of entering into a non-surgical specialty, whereas Table 6 presents the estimation results for the probability of entering into a surgical specialty. In the following discussion, all results should be interpreted relative to the baseline group which is not specializing. Estimates suggest that in most provinces, women are less likely to choose a non-surgical specialty relative to practising as a GP - such is the case for female physicians in Nova Scotia, Quebec, Ontario, Alberta and British Columbia. However, women in Manitoba appear to be more likely to specialize in a non-surgical specialty than to enter general practice. Results also indicate that women in all provinces are less likely to enter into a surgical specialty than to be a GP. Given that opportunity costs of specialization are likely to be greater for women, due to childbearing and child-rearing, this result is not surprising. This result may also re‡ect di¤erences in preferences for specialization across sexes or barriers to entry into specialization for women. Estimates also suggest that older physicians are less likely to choose a non-surgical specialty in. 14.
(17) Nova Scotia, Quebec, Ontario, Saskatchewan and Alberta (yet positively correlated in Manitoba) and, less likely to choose a surgical specialty (although not signi…cantly in all provinces). That in most provinces age plays a role is not surprising given that older physicians have, ceteris paribus, a shorter professional life to recover expenses and lost income associated with specialization. Furthermore, older individuals may be more likely to have outside obligations such as family which may make foregoing income for several years more di¢cult. Again, consistent with our priors, the e¤ect of age at graduation on non-surgical and surgical specialization increases as the physician’s age at graduation increases in many provinces. It is also important to note here that in both Quebec and Ontario, Francophones are signi…cantly less likely to specialize (relative to not specializing at all) than are their English counterparts. Several reasons may account for this disparity. First, given that some Francophones may be unable to train in a language other than French, the number of residency programmes available to them is much smaller. Furthermore, Francophones may be less mobile after graduation (because of the language barrier or because of attachment to a Francophone environment). Given their smaller market in which to practice as a specialist, the bene…ts of specializing may be reduced, either because they are subject to local market conditions or because their ability to emigrate to other markets in the future is reduced. Although individual characteristics are likely to play an important role in the physician’s decision to specialize, it is also likely that the medical school attended is an important element in the decision making process. Several e¤ects may be at work here. First, certain medical schools may provide more opportunities for future specialization to their students - for example, by being more research oriented. It may also be the case that certain medical schools (given their location, a¢liation to certain hospitals, or because of their faculty) recruit individuals who are more likely to specialize after medical school. Multinomial Logit estimates for the di¤erent provinces indicate that, in fact, attending a particular medical school is associated with the choice of specializing both in a non-surgical and a surgical specialty. For example, in Quebec, a province with four medical 15.
(18) schools, graduates from Quebec City’s Laval University are less likely to choose a non-surgical specialty compared to University of Montreal graduates. However, McGill University and University of Sherbrooke graduates are more likely to specialize in a non-surgical specialty relative to their University of Montreal counterparts. In Ontario, where there are …ve medical schools, and in Alberta where there are two, physicians are more likely to specialize in both surgical and non-surgical specialties if they attend a particular medical school (relative to not specializing at all).12 With respect to the ’year e¤ect’ variables, which are subsequently used to measure the impact of variations in province-speci…c variables (such as potential income) on the decision to specialize in both non-surgical and surgical specialties, they appear to account for much of the variation in non-surgical and surgical specialty decisions. That is, it appears that at least some of the variation in the decision to specialize (either in a non-surgical …eld or in a surgical …eld) is explained by factors which are time-varying. It is also important to note that this variation appears to be di¤erent across provinces. Thus, it is likely that province-speci…c variables which vary over time are playing an important role in physicians’ decisions to specialize and choices of specialty. This is not surprising given that health care in Canada is a provincial responsibility, i.e., where such things as fees paid to physicians are negotiated at the provincial level. Disaggregating these time e¤ects is the focus of the second stage of our estimation strategy. In the second stage, we attempt to explain the aforementioned variation across time and across provinces in physicians’ decisions to specialize by disaggregating the ’year e¤ects’ from the …rststage for both non-surgical and surgical specialties. In this second stage, we estimate the e¤ect of variations across time in (i) average-cost per consultation for specialists and GPs, (ii) provincial hospital, drug, physician and capital expenditures, and (iii) the proportion of specialists and GPs per 1000 population at the national level, on the decision to become a non-surgical specialist and the decision to become a surgical specialist. With respect to the average-cost per consultation, we include the ratio of the average-cost-per-consultation of Specialists to the average-cost-per12. Results for surgical specialties are similar.. 16.
(19) consultation of GPs. By doing so, we are able to capture the relative change in the cost-perconsultation of Specialists to GPs. Thus, if Specialists cost-per-consultation increased faster than costs-per-consultation of GPs, we should expect the ratio to be negatively correlated with the likelihood that a physician specializes. Estimation results (presented in Table 7) suggest that much of the variation in the ’year e¤ects’ can be explained by the variation in several province- and national-level variables. More speci…cally, the second-stage estimates suggest that physicians are more likely to enter a non-surgical specialty (relative to not specializing) as provincial hospital expenditures increase. Hospital expenditures may be positively correlated with non-surgical specialties for several reasons. First, increases in hospital expenditures may be correlated with the demand for in-hospital care which should be correlated with the demand for those who provide such care. As a result, such increased demand may lead to upward pressure on fees paid to specialists and thus increase a physician’s likelihood to specialize. It may also re‡ect other non-pecuniary bene…ts which may make specializing particularly attractive (i.e., better working environments). However, estimates suggest that physicians are less likely to enter a non-surgical …eld as total expenditures on physicians increase. Because information on the share of physician expenditures directed towards GPs and the share directed towards Specialists is unknown, interpreting this …nding is di¢cult. One surprising result it that there does not appear to be an income e¤ect when graduates decide to specialize in a non-surgical specialty. With respect to surgical specialists, the results are considerably more dramatic. First, as with the non-surgical case, physicians are more likely to specialize in a surgical specialty as hospital expenditures increase. Again, given that surgeons practice mainly in hospital settings, an increase in hospital expenditures should lead to physicians choosing such a specialty both for pecuniary and non-pecuniary bene…ts. Furthermore, there appears to be a density e¤ect when physicians decide on whether or not to enter a surgical specialty. More speci…cally, the probability of entering into a surgical specialty is increasing in the per capita number of surgical specialists. This could either re‡ect the fact that (i) physicians enter surgical specialties when there exists a critical mass which 17.
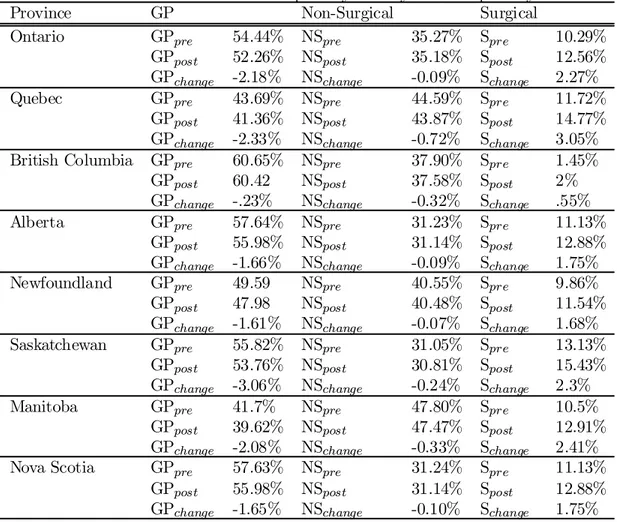
(20) may be able to negotiate favourable working conditions (both pecuniary and non-pecuniary), or (ii) this type of medicine is of increasing importance. One of the most striking results is that physicians are signi…cantly more likely to enter into surgical specialties as the ratio of generalist to specialist average-cost-per-consultation decreases. That is, as the average-cost-per-consultation for specialists increases relative to the average cost-perconsultation for generalists, physicians are more likely to specialize in a surgical specialty (relative to remaining a generalist). This suggests that, when it comes to choosing a surgical specialty, relative to not specializing at all, physicians do in fact respond to increases in potential income. Again, it is important to emphasize the fact that the income e¤ect measured here does not su¤er from a selection bias which we would expect if we were to use ’average-income within specialty’ as a measure of potential income. Furthermore, it is unlikely to capture unmeasured non-pecuniary specialty attributes, such as status, as these are unlikely to vary with the ratio of exogenous fees.. 5.2. Estimated Income Elasticity. In this section, we calculate an estimated income elasticity for both non-surgical and surgical specialties by simulating an increase in average-cost-per-consultation for specialists (relative to generalists) and examining its e¤ect on the decision to specialize and the choice among specialties. More speci…cally, by using the results presented above, we simulate a 10 per cent increase in specialty average-cost-per-consultation and calculate the predicted change in specialty decisions for the 1991 graduating cohort. That is, we …rst predict the probability of specializing and the choice of specialty using the actual average-cost-per-consultation data for 1991, then we repeat the exercise, increasing the average cost-per-consultation for specialists by 10 per cent in 1991. Results, presented in Table 8, suggest that increasing the average-cost-per-consultation for specialists will lead to a decrease in the proportion of physicians who choose not to specialize (i.e., practice as a GP) and an increase in the proportion of physicians who choose to specialize in a surgical …eld (with only marginal decreases in the amount of physicians who choose a non-surgical …eld). For. 18.
(21) example, in Quebec, a 10 per cent increase in average-cost-per-consultations for specialists leads to a predicted decrease of 2.33 per cent in GPs, a 0.72 per cent decrease in non-surgical specialists and a 3.05 per cent increase in surgical specialists. On the other hand, the predicted increase of surgical specialists of 0.55 per cent in British-Columbia is considerably smaller.. 6. Discussions. In this paper, we estimate the determinants of physicians’ specialty decisions. By using data on virtually all Canadian physicians in Canada from 1989 to 1998, and by exploiting the fee-for-service setting in Canada, we estimate the e¤ects of various factors including expected income on physicians’ decisions to specialize, and their choice of specialty.. Because we use a truly exogenous. measure of income (average-cost-per-consultation) for generalists and specialists, we avoid the potential sample-selection bias associated with prior results found in the literature. Furthermore, because we measure the income e¤ect through variations in potential-income and not di¤erences in levels, our income-elasticity estimates are not contaminated by potential non-pecuniary bene…ts which could be correlated with potential pecuniary bene…ts. Finally, we address the potential problem associated with rationing in residency programmes which may have lead to downward-biased income-elasticity estimates in the past. Our results suggest that physicians do in fact respond to di¤erences in income when making their specialty decisions. More speci…cally, our simulation exercise suggests that provinces could increase the proportion of graduates who select a surgical specialty by increasing the fees they pay to them.. References [1] Bhattacharya, Jayanta (1998) ’What Are the Returns to Specialization in Medicine?,’ RAND working paper. [2] Ernst, R.L. and Donald E.Y. (1985) Physician Location and Specialty Choice (Ann Arbor, Michigan: Health Administration Press) 19.
(22) [3] Hadley, J. (1975) ’Models of Physicians’ Specialty and Location Decisions,’ Ph.D. Dissertation, Yale University [4] Hadley, J. (1977) ’An Empirical Model of Medical Specialty Choice,’ Inquiry 14 (December), 384-401 [5] Hadley, J. (1979) ’A Disaggregated Model of Medical Specialty Choice,’ In Research in Health Economics, ed. R.M. Sche-er (Greenwich, Conn: JAI Press) [6] Hay, J. (1980) ’Occupational Choice and Occupational Earnings: Selectivity Bias in a Simultaneous Logit-OLS Model,’ PhD Dissertation, Yale University [7] Hay, J. (1981) ’Selectivity Bias in a Simultaneous Logit-OLS Model: Physician Specialty Choice and Specialty Income,’ (Farmington, Conn.: University of Connecticut Health Center). [8] Hurley, J.E. (1991) ’Physicians’ Choice of Specialty, Location, and Mode: A Reexamination within an Independent Framework,’ Journal of Human Resources 26, 47-71 [9] Nicholson, Sean (2002) ’Physician Specialty Choice Under Uncertainty,’ Journal of Labor Economics, forthcoming. [10] Sloan, F.A. (1970) ’Hospital Demand for Residents,’ Inquiry 7 (September), 65-68. 20.
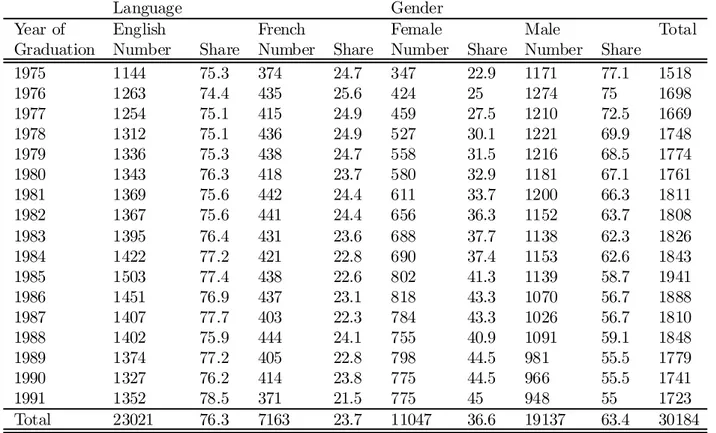
(23) Table 1: Summary statistics on the year of graduates per ’language’ and per gender Language Gender Year of English French Female Male Graduation Number Share Number Share Number Share Number Share 1975 1144 75.3 374 24.7 347 22.9 1171 77.1 1976 1263 74.4 435 25.6 424 25 1274 75 1977 1254 75.1 415 24.9 459 27.5 1210 72.5 1978 1312 75.1 436 24.9 527 30.1 1221 69.9 1979 1336 75.3 438 24.7 558 31.5 1216 68.5 1980 1343 76.3 418 23.7 580 32.9 1181 67.1 1981 1369 75.6 442 24.4 611 33.7 1200 66.3 1982 1367 75.6 441 24.4 656 36.3 1152 63.7 1983 1395 76.4 431 23.6 688 37.7 1138 62.3 1984 1422 77.2 421 22.8 690 37.4 1153 62.6 1985 1503 77.4 438 22.6 802 41.3 1139 58.7 1986 1451 76.9 437 23.1 818 43.3 1070 56.7 1987 1407 77.7 403 22.3 784 43.3 1026 56.7 1988 1402 75.9 444 24.1 755 40.9 1091 59.1 1989 1374 77.2 405 22.8 798 44.5 981 55.5 1990 1327 76.2 414 23.8 775 44.5 966 55.5 1991 1352 78.5 371 21.5 775 45 948 55 Total 23021 76.3 7163 23.7 11047 36.6 19137 63.4. 21. Total 1518 1698 1669 1748 1774 1761 1811 1808 1826 1843 1941 1888 1810 1848 1779 1741 1723 30184.
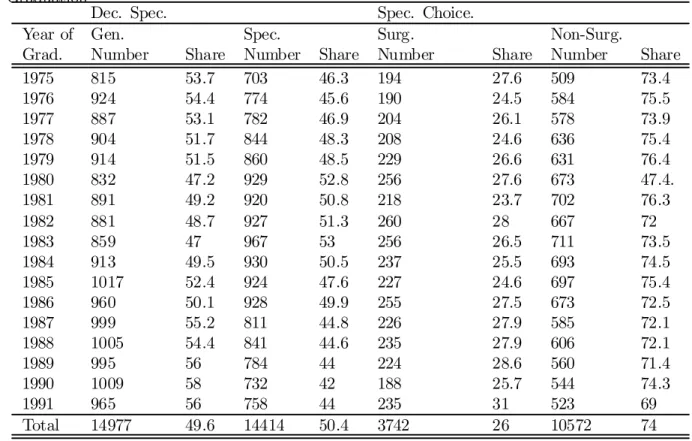
(24) Table 2: Summary statistics on the Decision to Specialize and on the Type of Specialty by year of Graduation Year of Grad. 1975 1976 1977 1978 1979 1980 1981 1982 1983 1984 1985 1986 1987 1988 1989 1990 1991 Total. Dec. Spec. Gen. Number 815 924 887 904 914 832 891 881 859 913 1017 960 999 1005 995 1009 965 14977. Share 53.7 54.4 53.1 51.7 51.5 47.2 49.2 48.7 47 49.5 52.4 50.1 55.2 54.4 56 58 56 49.6. Spec. Number 703 774 782 844 860 929 920 927 967 930 924 928 811 841 784 732 758 14414. Share 46.3 45.6 46.9 48.3 48.5 52.8 50.8 51.3 53 50.5 47.6 49.9 44.8 44.6 44 42 44 50.4. 22. Spec. Choice. Surg. Number 194 190 204 208 229 256 218 260 256 237 227 255 226 235 224 188 235 3742. Share 27.6 24.5 26.1 24.6 26.6 27.6 23.7 28 26.5 25.5 24.6 27.5 27.9 27.9 28.6 25.7 31 26. Non-Surg. Number 509 584 578 636 631 673 702 667 711 693 697 673 585 606 560 544 523 10572. Share 73.4 75.5 73.9 75.4 76.4 47.4. 76.3 72 73.5 74.5 75.4 72.5 72.1 72.1 71.4 74.3 69 74.
(25) Table 3: Average-Cost-Per-Consultations for GPs per Province for the period 1976-1991 Province Min Max Mean Std. Dev. British Columbia 19.85965 26.86008 23.63442 2.491298 Alberta 18.27851 27.59816 22.71749 2.945301 Saskatchewan 13.70614 18.96403 16.5001 2.15093 Manitoba 15.04624 19.00308 16.84445 1.287865 Ontario 14.97302 26.18131 20.65059 4.269397 Quebec 16.16886 21.04008 18.53719 1.368644 Nova Scotia 14.42389 20.12364 17.47883 2.298705 Newfoundland 12.92171 16.87351 15.25827 1.585122 Table 4: Average-Cost-Per-Consultations for Specialists per Province for the period 1976-1991 Province Min Max Mean Std. Dev. British Columbia 36.93046 53.52246 43.7504 5.305364 Alberta 20.8333 38.66598 31.68855 5.676567 Saskatchewan 25.62061 34.31855 30.08789 3.414675 Manitoba 20.73796 29.17887 24.86598 3.16826 Ontario 24.65132 40.63964 31.93857 6.361952 Quebec 22.12 26.72251 24.27642 1.558948 Nova Scotia 22.72832 41.43885 31.29941 7.08552 Newfoundland 22.81798 35.10804 29.14358 4.046635. 23.
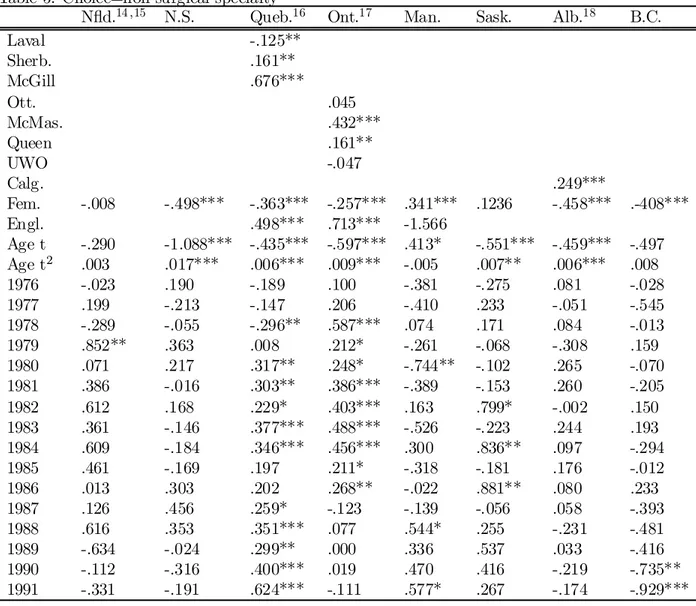
(26) Table 5: Choice=non-surgical specialty13 N‡d.14 ;15 N.S. Queb.16 Laval -.125** Sherb. .161** McGill .676*** Ott. McMas. Queen UWO Calg. Fem. -.008 -.498*** -.363*** Engl. .498*** Age t -.290 -1.088*** -.435*** Age t2 .003 .017*** .006*** 1976 -.023 .190 -.189 1977 .199 -.213 -.147 1978 -.289 -.055 -.296** 1979 .852** .363 .008 1980 .071 .217 .317** 1981 .386 -.016 .303** 1982 .612 .168 .229* 1983 .361 -.146 .377*** 1984 .609 -.184 .346*** 1985 .461 -.169 .197 1986 .013 .303 .202 1987 .126 .456 .259* 1988 .616 .353 .351*** 1989 -.634 -.024 .299** 1990 -.112 -.316 .400*** 1991 -.331 -.191 .624***. Ont.17. Man.. Sask.. Alb.18. B.C.. .1236. .249*** -.458***. .-408***. -.551*** .007** -.275 .233 .171 -.068 -.102 -.153 .799* -.223 .836** -.181 .881** -.056 .255 .537 .416 .267. -.459*** .006*** .081 -.051 .084 -.308 .265 .260 -.002 .244 .097 .176 .080 .058 -.231 .033 -.219 -.174. -.497 .008 -.028 -.545 -.013 .159 -.070 -.205 .150 .193 -.294 -.012 .233 -.393 -.481 -.416 -.735** -.929***. .045 .432*** .161** -.047 -.257*** .713*** -.597*** .009*** .100 .206 .587*** .212* .248* .386*** .403*** .488*** .456*** .211* .268** -.123 .077 .000 .019 -.111. 13. .341*** -1.566 .413* -.005 -.381 -.410 .074 -.261 -.744** -.389 .163 -.526 .300 -.318 -.022 -.139 .544* .336 .470 .577*. * coe¢cient signi…cant at the 10% level, ** coe¢cient signi…cant at the 5% level, *** coe¢cient signi…cant at the 1% level. 14 In Newfoundland, the Medical School is omitted as the province has only one medical school. Such is also the case for Nova Scotio, Manitoba, Saskatchewan and Bristish Columbia. 15 In Newfoundland, as in Nova Scotia, Manitoba, Saskatchewan, Alberta and British Columbia, the English Variable is excluded as the French population is insigni…cant. 16 For Quebec, the University of Montreal serves as the comparison medical school. 17 For Ontario, the University of Toronto serves as the comparison medical school. 18 In Alberta, the University of Calgary serves as the comparison medical school.. 24.
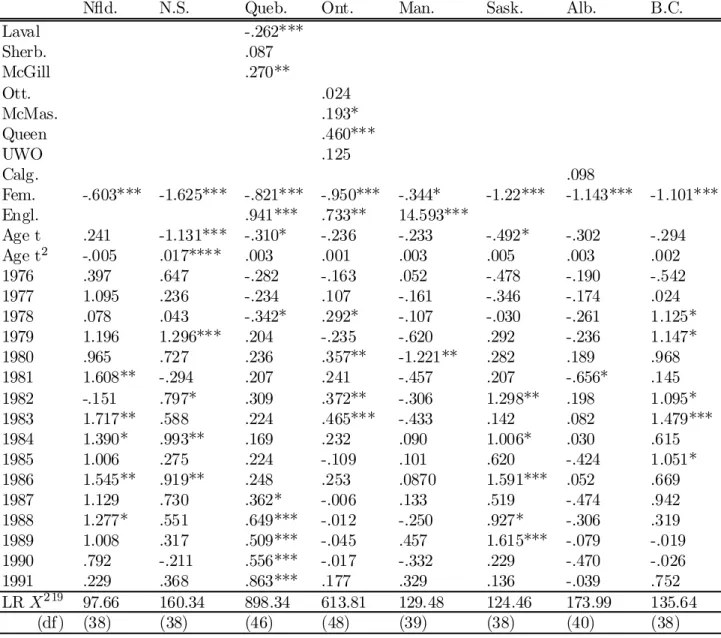
(27) Table 6: Choice=surgical specialty N‡d. N.S. Queb. Laval -.262*** Sherb. .087 McGill .270** Ott. McMas. Queen UWO Calg. Fem. -.603*** -1.625*** -.821*** Engl. .941*** Age t .241 -1.131*** -.310* Age t2 -.005 .017**** .003 1976 .397 .647 -.282 1977 1.095 .236 -.234 1978 .078 .043 -.342* 1979 1.196 1.296*** .204 1980 .965 .727 .236 1981 1.608** -.294 .207 1982 -.151 .797* .309 1983 1.717** .588 .224 1984 1.390* .993** .169 1985 1.006 .275 .224 1986 1.545** .919** .248 1987 1.129 .730 .362* 1988 1.277* .551 .649*** 1989 1.008 .317 .509*** 1990 .792 -.211 .556*** 1991 .229 .368 .863*** 2 19 LR X 97.66 160.34 898.34 (df) (38) (38) (46). 19. Ont.. Man.. Sask.. Alb.. B.C.. -1.22***. .098 -1.143***. -1.101***. -.492* .005 -.478 -.346 -.030 .292 .282 .207 1.298** .142 1.006* .620 1.591*** .519 .927* 1.615*** .229 .136 124.46 (38). -.302 .003 -.190 -.174 -.261 -.236 .189 -.656* .198 .082 .030 -.424 .052 -.474 -.306 -.079 -.470 -.039 173.99 (40). -.294 .002 -.542 .024 1.125* 1.147* .968 .145 1.095* 1.479*** .615 1.051* .669 .942 .319 -.019 -.026 .752 135.64 (38). .024 .193* .460*** .125 -.950*** .733** -.236 .001 -.163 .107 .292* -.235 .357** .241 .372** .465*** .232 -.109 .253 -.006 -.012 -.045 -.017 .177 613.81 (48). Note that for all provinces, Prob>X 2 = 0:0000:. 25. -.344* 14.593*** -.233 .003 .052 -.161 -.107 -.620 -1.221** -.457 -.306 -.433 .090 .101 .0870 .133 -.250 .457 -.332 .329 129.48 (39).
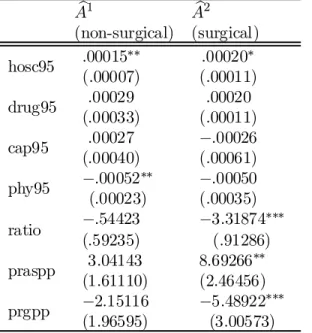
(28) Table 7: OLS Results from for the ’year e¤ects’: Ab1 Ab2 (non-surgical) (surgical) :00015¤¤ :00020¤ hosc95 (:00007) (:00011) :00029 :00020 drug95 (:00033) (:00011) :00027 ¡:00026 cap95 (:00040) (:00061) ¤¤ ¡:00052 ¡:00050 phy95 (:00023) (:00035) ¡:54423 ¡3:31874¤¤¤ ratio (:59235) (:91286) 3:04143 8:69266 ¤¤ praspp (1:61110) (2:46456) ¡2:15116 ¡5:48922¤¤¤ prgpp (1:96595) (3:00573). 26.
(29) Table 8: Predictions for 1991 increased Specialty Fees by 10% on Province GP Non-Surgical Ontario GPpre 54.44% NSpre 35.27% GPpost 52.26% NSpost 35.18% GPchange -2.18% NSchange -0.09% Quebec GPpre 43.69% NSpre 44.59% GPpost 41.36% NSpost 43.87% GPchange -2.33% NSchange -0.72% British Columbia GPpre 60.65% NSpre 37.90% GPpost 60.42 NSpost 37.58% GPchange -.23% NSchange -0.32% Alberta GPpre 57.64% NSpre 31.23% GPpost 55.98% NSpost 31.14% GPchange -1.66% NSchange -0.09% Newfoundland GPpre 49.59 NSpre 40.55% GPpost 47.98 NSpost 40.48% GPchange -1.61% NSchange -0.07% Saskatchewan GPpre 55.82% NSpre 31.05% GPpost 53.76% NSpost 30.81% GPchange -3.06% NSchange -0.24% Manitoba GPpre 41.7% NSpre 47.80% GPpost 39.62% NSpost 47.47% GPchange -2.08% NSchange -0.33% Nova Scotia GPpre 57.63% NSpre 31.24% GPpost 55.98% NSpost 31.14% GPchange -1.65% NSchange -0.10%. 27. specialty choice. Surgical Spre 10.29% Spost 12.56% Schange 2.27% Spre 11.72% Spost 14.77% Schange 3.05% Spre 1.45% Spost 2% Schange .55% Spre 11.13% Spost 12.88% Schange 1.75% Spre 9.86% Spost 11.54% Schange 1.68% Spre 13.13% Spost 15.43% Schange 2.3% Spre 10.5% Spost 12.91% Schange 2.41% Spre 11.13% Spost 12.88% Schange 1.75%.
(30) 7. Data Appendix. Source. Southam Data Base. Variable Age t Age t2 Sex 1976,...,1991 Laval Sherb. McGill. Ott. McMas. Queen UWO. Calg.. Description Denotes the physician’s age at graduation Constructed from data on (1) the physician’s date of birth and, (2) the Physician’s age at graduation Denotes the square of physician’s age at graduation Denotes the physician’s sex Dummy variables constructed for the year of graduation from medical school (graduated in 1975 is the comparison group) Dummy variable =1 if the physician graduated from Laval University Dummy variable =1 if the physician graduated from the University of Sherbrooke Dummy variable =1 if the physician graduated from McGill University (graduated from the University of Montreal is the comparison group fophysicians who graduated from a Quebec University) Dummy variable =1 if the physician graduated from the University of Ottawa Dummy variable =1 if the physician graduated from McMaster University Dummy variable =1 if the physician graduated from Queen’s University Dummy variable =1 if the physician graduated from the Univesity of Western Ontario (graduated from the University of Toronto is the comparison group for physicians who graduated from an Ontario University) Dummy variable =1 if the physician graduated from the University of Calgary (graduated from the University of Alberta is the comparison group for physicians who graduated from an Alberta University). 28.
(31) Source. OECD Health Data (2000). National Physician Database. Variable hosc95 drug95 cap95 phy95 praspp prgpp ratio. Description Per capita hospital expenditures in 1995 dollars Per capita drug expenditures in 1995 dollars Per capita capital expenditures in 1995 dollars Per capita physician expenditures in 1995 dollars Proportion of Specialists per 1000 population Proportion of GPs per 100 population Ratio of the average-cost-per-consulation for GP services to the average-cost-per-consulation for Specialist services. 29.
(32)
Figure
+3
Documents relatifs
LOFT’s youth-directed Transitional Age Youth Programs offer case management, peer support and group programming for emerging adults living with mental health and/or substance
The New Zealand Immigration and Protection Tribunal made a point of saying that the effects of climate change were not the reason for granting residency to the family, but
He told me how he has now pushed the motorcycle company into cars, a small-scale car company in China but a big exporter to countries such as Vietnam, Uruguay and Iran.. These
In addition to per- formance considerations, ontology learning tools need to be fully integrated into the knowledge engineering life-cycle, working in the background and providing
Current French breeding schemes are pyramidal: at bottom, a large number of sheep breeders are only users of genetic progress, above, a selection nucleus is composed of
10 copies (+ 2 AP) deluxe limited edition of this book, accompanied by a signed and numbered photo by the artist is available from onestar press. Photos: Olga
Working with a fine team of physicians: Dr Julie Auger is Medical Program Director of the Continuing Care Program at Timmins and District Hospital.... 1194 Canadian Family
OBJECTIVE To compare the scope of practice and degree of personal and professional satisfaction of rural women family physicians with their rural male, urban female, and urban
