Science Arts & Métiers (SAM)
is an open access repository that collects the work of Arts et Métiers Institute of
Technology researchers and makes it freely available over the web where possible.
This is an author-deposited version published in: https://sam.ensam.eu
Handle ID: .http://hdl.handle.net/10985/16792
To cite this version :
Damien FAUX, Olivier THOMAS, Sébastien GRONDEL, Éric CATTAN - Dynamic simulation and
optimization of artificial insect-sized flapping wings for a bioinspired kinematics using a two
resonant vibration modes combination Journal of Sound and Vibration Vol. 460, p.114883
-2019
Any correspondence concerning this service should be sent to the repository
Administrator : [email protected]
Dynamic simulation and optimization of artificial insect-sized
flapping wings for a bioinspired kinematics using a two
resonant vibration modes combination
D. Faux
a, O. Thomas
b,*, S. Grondel
a, É. Cattan
aaUniv. Valenciennes, CNRS, Univ. Lille, YNCREA, Centrale Lille, UMR 8520 - IEMN, DOAE, F-59313 Valenciennes, France bArts et Métiers ParisTech, LISPEN UMR 7515, 8 Boulevard Louis XIV, 59046 Lille, France
a r t i c l e i n f o
Article history:
Received 30 November 2018 Revised 23 July 2019 Accepted 3 August 2019 Available online 7 August 2019 Handling Editor: Ivana Kovacic
Keywords:
Resonant motion
Micro/Nano electromechanical system (M/NEMS)
Modal combination Design of structural vibration Optimization
a b s t r a c t
This paper addresses the design of the elastic structure of artificial wings to optimize their dynamical behaviour to reproduce insect wings kinematics. Our bioinspired kinematics is based on the original concept of using the resonant properties of the wing structure in order to combine the motion of two vibration modes, a flapping and a twisting mode, in a quadra-ture phase shift. One way of achieving this particular combination is to optimize the geometry and elastic characteristics of the flexible structure such that the two modes are successive in the eigenspectrum and close in frequency. This paper first proposes a semi-analytical model, based on assembled Euler-Bernoulli beams, to understand, compute and optimize the artificial wing dynamic vibrations. Then, using this model, it is shown that it is possible to obtain sev-eral artificial wing structures with a flapping and a twisting mode close in frequency. Finally, experimental validations are performed on micromachined insect-sized prototypes to vali-date the model and the concept.
© 2019 Published by Elsevier Ltd.
1. Introduction
Over the course of their evolution, flying insects have developed and improved their fly mechanisms and demonstrate impressive capacities in terms of agility and maneuverability. Indeed, among flying species, insects show remarkable perfor-mances in regard to hovering, backward flight or sudden acceleration and are unrivaled in terms of weight and scale. The key to such abilities mainly relies on their wings motions, and more particularly on their specific trajectories. Hence, it is now well established, thanks to the substantially improvement of the insects flight mechanisms understanding, that the generated lift results of a wide range of unconventional aerodynamic mechanisms [1] as well as specific kinematics induced by the flexible characteristics of the wings [2]. Moreover, the enhancement of the high-speed camera technologies provided the possibility to describe more precisely this particular wing kinematics [3,4].
An other central element in the understanding of the insect flight relies on their wings structure made of a thin membrane supported by flexible veins. In fact, this structure flexibility is a key element of the insects flight capacities since this character-istic notably allows the wing deformation in order to adapt its shape dynamically during flight [5]. However, the exact role of this particularity on the aerodynamic performances remains controversial. In literature, some studies [2,6,7] demonstrate that this flexibility enables a camber of the wing during the flapping which generates higher lift forces than with rigid wings [8,9].
* Corresponding author.
E-mail address:[email protected]( Thomas).
https://doi.org/10.1016/j.jsv.2019.114883
On the contrary, other simulation works [10] expose a reduction of aerodynamic performances with higher flexibility for small angles of attack. Furthermore, as discussed by Refs. [11,12], this flexibility property is also contributing for their solidity or their resistance to impacts.
Much discussions are also oriented about the resonant mechanisms developed by some insects. Several studies [13–16] highlight the use of the wing structure natural frequencies to amplify a small amplitude motion. While on the other hand, some works [5,17] tend to indicate that a wing beat that is different from the wings structure resonant frequencies is used. However, it is also demonstrated that the resonant mechanism relies on other body parts such as the thorax [18].
When creating an artificial flapping wing prototype, there is a broad design space ahead, outlined by the number of fly-ing insects, and designers have to crawl through it before findfly-ing out the correct combination of parameters meetfly-ing their requirement. This approach is even more critical when original technology choices are introduced and no known-how is avail-able paving the way, as it is the case for the resonant wings proposed in our original concept [19]. To alleviate this bur-den, analytic and numerical tools can be envisioned to assist and hasten these preliminary design tasks. Obviously, most of the numerical tools published until today are dedicated to model accurately insect flight [20–26]. Those attempts provide a good understanding of the physics involved in flapping wings but seem too specific and accurate for design purpose. Of course, more practical numerical tools [27–29] are existing but they are devoted to computational intensive studies such as flight mechanisms. Few of them have been used for sizing purposes [21,30–33] and even fewer for preliminary design tasks [34,35].
Within this context, this article focuses on the design and the optimization of the elastic structure of the artificial wings of a micromachined insect-sized prototype. Following the concept introduced in Ref. [19], we propose to generate a motion inspired by the particular insects wings kinematics with fully flexible artificial wings. More precisely, the leading idea is to combine the motion of two vibration modes, a flapping mode and a twisting mode, close to their resonance, to artificially create a wing kinematics similar to the one of insects. This situation is obtained by designing the geometry and the elastic structure of the wings such that the two modes are successive in the eigenspectrum and close in frequency. Then, only one actuator is necessary and the particular motion of the wings is solely a result of the elastic properties of the wings, actuated at a single well chosen frequency.
The purpose of this paper is first to propose and describe a semi-analytic model to optimize the flexible wing structure of the wings. Then, we aim at demonstrating that it is possible to obtain two vibration modes – a flapping and a twisting mode – successive in the eigenspectrum and close in frequency. This is achieved by selecting several classes of geometry and optimizing their parameters. The paper reports the result of this theoretical study. Finally, for selected optimized geometries, some micromachined insect-sized prototypes have been built. For each ones, the paper reports their vibration properties, that have been experimentally measured, in order to validate the proposed model and the concept.
2. Vibration mode combination concept
Generally, flapping micro and nano air vehicles feature artificial wings composed of an articulated rigid leading edge attached to the thorax and a flexible membrane [36,37]. To produce an appropriate wing slope and lift off [38] the most common mech-anism is to impose a large flapping motion on the rigid leading edge, by using a mechanical amplifier [36,39,40], and to exploit the passive twisting of the wings. In this case, the wing is equivalent to a single degree of freedom system in twisting, with the flapping displacement of the leading edge prescribed by the actuator.
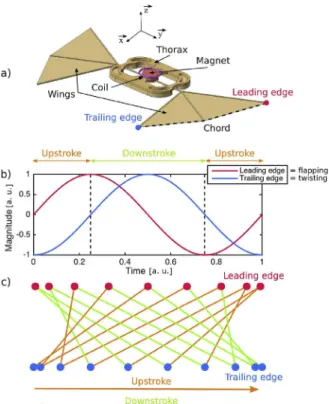
Conversely, the approach followed here is based on an actuation principle without any mechanism to transmit and transform the actuator motion. Following the concept introduced in Ref. [19], we propose to consider fully flexible artificial wings and to actuate them in a particular resonant motion, similar to the kinematics of real insect wings. In particular, we consider our wings as a deformable vibrating structure featuring two particular vibration modes, with shapes of the form of a flapping motion for the first mode and a twisting motion for the second one. This structure must be designed in such a way that the eigen frequencies of these two modes appear successive in the eigenspectrum and are close enough to enable their combination. Then, by selecting a particular driving frequency between the two resonances of the modes, it is possible to actuate the two modes simultaneously with a quadrature phase shift between the two motions. Basically, the main idea is to obtain a flapping mode shape which is providing the leading edge displacement and a twisting mode shape which is impacting on the trailing edge one. As shown inFig. 1with the motions amplitudes (b) and the associated wing tip tracking (c), by reaching the quadrature (phase shift equal to
𝜋
∕2) between the two motions, it is theoretically possible to obtain an asynchronous kinematics close to those observed on insects. Indeed, the wing slope is maximal in the middle of a half flapping cycle and the slope reversal occurs at its end.This concept, introduced and detailed in Ref. [19], has then two remarkable properties: the capacity to reproduce an insect wing kinematics thanks to a combination of flapping and twisting structural deformations and the possibility to obtain large amplitude since the actuation on a quadrature frequency is close to the resonances of the modes. However, all this is possible (i) if two modes in the spectrum have the shape of a flapping mode and a twisting mode; (ii) if those modes appear successively in the spectrum and (iii) if their resonances are close enough so that the quadrature frequencies are also close enough to the two resonances peaks for the two modes to be actuated with a suitable amplitude. The remaining of the paper addresses those three points.
Fig. 1. Illustration of quadrature mode combination concept. a) Example of a prototype design with the wing tracked leading edge, trailing edge and chord. Periodic
oscillations of leading (red) and trailing (blue) edges in a quadrature phase shift during flapping motion: (b) leading and trailing edges motion magnitude versus time for a flapping cycle (a. u. means arbitrary units), (c) associated wing motion tracking from a wing tip perspective (wing membrane plotted in orange for the upstroke, left to right half flapping cycle, and in green for the downstroke, right to left half-cycle). (For interpretation of the references to color in this figure legend, the reader is referred to the Web version of this article.)
Fig. 2. Exploded view of the prototype ofFig. 1(a), top view and proposed modelling of the flexible structure of the wings with an assembly of beams clamped to the thorax.
3. Wing structure modelling
The developed prototypes (a design example is shown inFigs. 1(a) and 2) are composed of several parts. The wings are based on a polymeric flexible skeleton, which has the shape of assembled beams, on which a thin membrane is deposited. The skeleton is linked to a thick thorax, also made in the same polymeric material. A single electromagnetic actuator, composed of a magnet glued on the central part of the skeleton and a coil supported by the thorax, creates the necessary force to drive the wings in vibration.
As explained in the previous section, our concept is based on the actuation of two vibration modes of the flexible wings. We choose to consider in our modelling only the flexible structure of the wings, clamped to the thorax, that is assumed infinitely rigid since its thickness is ten times the one of the beams of the skeleton. Moreover, we also choose to neglect the wing mem-branes in our modelling. Their structural influence, in term of added mass and stiffness, can be neglected since they are very thin (400 nm for the membrane, 80μm for the beams of the skeleton, giving a 200 ratio between thicknesses) and not stressed
Fig. 3. (a) Spectrum of the velocity signal measured on one point of the wings, for several air pressures (as specified on the graph) (b) Estimated quality factor and (c)
resonance frequency of the low frequency mode as a function of the air pressure.
at rest. However, their aerodynamic influence has to be carefully addressed. When the wings are vibrating, their membranes stir the fluid, the effect of which is mainly to add mass and aerodynamic damping to the vibration. Those effects are experi-mentally addressed in section3.1. It is shown that the added mass effect of the fluid lowers the resonance frequencies of the structure whereas the aerodynamic damping lowers their amplitude and sharpness. However, the main resonant response of the system does not change fundamentally, the two resonance peaks staying close to each other. Those aerodynamic effects are theoretically difficult to take into account in a simple model. Since our goal is the design of the flexible structure of the wings to bring close two particular vibration modes, we simply choose to neglect in our model the influences of the membranes, both structural and aerodynamic, on the dynamics of the wing structures. It will be shown in section4.3that this modelling can be successfully used as a pre-design tool.
Our design procedure is thus mainly based on a modal analysis of the wing structure, to identify its vibration modes. The wing structure is modeled by an assembly of Euler-Bernoulli beams, with degrees of freedom restricted to bending, in the flapping – out of plane – direction (z inFig. 1(a)), and twisting. We opt for a semi-analytic modelling, for which the exact solution for the deformation of each straight beam is combined to suitable boundary and assembly conditions. In comparison with a finite elements modelling with a commercial code, this kind of method allows to easily restrict the number of degrees of freedom to exploit, and so to limit the number of calculated non-contributory modes. In this way, only the modes inducing a deformation in the out of plane – flapping – direction (direction z inFig. 1(a) perpendicular to the wing plane) are considered, the others (with deformed shapes in the in plane directions) being useless, especially since the chosen actuation solution cannot allow their excitation (the actuator imposes a force in z direction). This restriction is mandatory when an optimization loop is under concern, as described in section4.4. With the results of the modal analysis, it is then possible to compute the frequency response function (FRFs) of the structure to identify the driving frequencies that leads to a quadrature phase shift between the two modes under interest. To obtain FRFs similar to the one obtained experimentally at air pressure, we simply add a linear damping in the model, with a quality factor of the order of 10, as observed inFig. 3(b) (refer to section3.1for more details).
It must also be noted that the structure of the wings of our prototypes are similar to those of real insects: a skeleton with a membrane. Moreover, as shown in Refs. [11,41,42], the SU-8 polymer material selected for our wings has mechanical properties very close to those of natural insects. Despite of that, since we rely on the mode combination mechanism to create the suitable wing kinematics and produce lift, and also because our design procedure is based on parametric optimization, our wing struc-tures are much simpler that those of real insects, with less beam members and a geometry that could be considered different from that of insects, although there is a very important variety of insect wing shape. According to this point, we thought that our wings will get closer and closer to some insect wings.
3.1. Aerodynamic effects on the vibration
To experimentally estimate the aerodynamic effects on the vibratory response of the wings, we measured the frequency response of one point of the wing structure for several air pressures, by using a vacuum chamber. Precisely, a prototype is placed in a vacuum chamber with a glass window, through which the laser beam of a laser vibrometer (Polytec OFV-5000) enables to measure the velocity signal of a selected point of the wing structure of the prototype. The latter is driven in vibration by a white noise signal sent to the electromagnetic actuator. Several measures are performed for selected values of the air pressure, from 6μbar to the atmospheric pressure (1 bar).Fig. 3(a) shows some spectrum of the velocity signal (obtained by a simple fast Fourier transform), on a frequency band around the two modes of interest, for seven values of the air pressure. One can observe
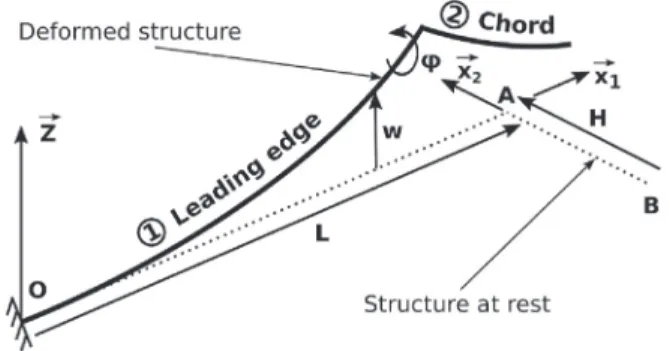
Fig. 4. Scheme of a “L” shaped wing modeled by a two Euler-Bernoulli beams assembly in bending (w) and twisting (𝜙).
that the two resonances are clearly visible. Moreover, there is an attenuation of the two resonances and a frequency shift to the low frequencies, as the air pressure increases. With a simple fit of the low frequency resonance peak with a Lorentzian function, its resonance frequency f1and quality factor Q are estimated.Fig. 3(b and c) show the evolution of f1and Q as a function of the air pressure. This quantitatively assess the effect of the aerodynamic on the vibratory response of the prototype: an increase of the damping and a frequency shift of the resonances toward the low frequencies.
Quantitatively, the obtained results on the increase of the quality factor and the decrease of the resonance frequencies are related to a given prototype at a given driving amplitude (the aerodynamic force is at first order a quadratic function of the amplitude, which leads to a linear increase of the quality factor as a function of the amplitude). More qualitatively, (i) the two peaks are still visible at atmospheric pressure and (ii) they show almost the same frequency shift, which leads to a frequency difference almost independent of the atmospheric pressure. We choose to consider those two qualitative results valid for any of the proposed prototype architecture.
3.2. Continuum problem
We first consider a simple “L” shaped wing structure to explain our modelling strategy. It is modeled with an assembly of two linear Euler-Bernoulli beams with deformations in bending and twisting, as shown inFig. 4with beams 1 and 2 representing the leading edge and the chord respectively.
Based on classical mechanical vibrations theory [43], we consider a straight beam i with a transverse displacement along z axis wi(xi
,
t)and a section twisting rotation along the beam axis𝜙
i(xi,
t)(with xithe coordinate along the beam axis t the time). They satisfy the following differential equations:∀xi
,
∀t { EIiw′′′′ i +𝜌
Siẅ
i=Pi GJi𝜑
′′ i −𝜌
Jï𝜑
i=0,
i=1,
2 (1) with•′ = ∂ • ∕∂x and• =̇
𝜕
• ∕𝜕
t. Pi(xi
,
t)represents the transverse force (no external forcing in twisting is considered), E thematerial Young’s modulus, S the beam cross section area, I and J the cross section moment in bending and twisting respectively,
𝜌
the material density, and G = E∕(2(1 +𝜈
))the Coulomb modulus with𝜈
the Poisson ratio.With the beams oriented with x1 = OA∕ ∥OA∥and x2 = −AB∕ ∥AB∥, the bending moment Mi, the twisting moment Ni
and the shear force Tiare expressed as:
⎧ ⎪ ⎨ ⎪ ⎩ Mi =EiIiw′′ i Ni =GiJi
𝜑
′i Ti = −Mi′= −EiIiw′′′i (2)Recalling that the section bending rotation for a linear Euler-Bernoulli beam is defined by w′, we can write this assembled beams
system with the following boundary and continuity conditions: Beam 1 clamped end (x1 = 0 in O)
⎧ ⎪ ⎨ ⎪ ⎩ w1(0) =0 w′1(0) =0
𝜑
1(0) =0 (3)Continuity beam 1/beam 2 (x1 = L, x2 = 0 in A) ⎧ ⎪ ⎪ ⎪ ⎪ ⎨ ⎪ ⎪ ⎪ ⎪ ⎩ w1(L) =w2(0) w′1(L) = −
𝜑
2(0)𝜑
1(L) =w′2(0) M1(L) =N2(0) N1(L) = −M2(0) T1(L) = −T2(0) (4)Beam 2 free end (x2 = −H in B)
⎧ ⎪ ⎨ ⎪ ⎩ M2(−H) =0 T2(−H) =0 N2(−H) =0 (5)
Eq.(3)describes the clamped condition of beam 1 with a null transverse displacement, bending section rotation and twisting rotation. Continuity Eq.(4)represent the coupling between the bending of one beam and the twisting of the other one (and inversely) by binding on the connection an equal transverse displacement for the two beams, a twisting rotation of a beam equal to the bending section rotation of the other one (in absolute value), a twisting moment of one equal to the bending moment of the other (in absolute value), and the shear forces equilibrium. Finally, Eq.(5)describe the free condition of beam 2 with a null bending moment, twisting moment and shear force.
3.3. Modal analysis
A modal analysis of the structure is performed with the aim of determining its eigenmodes (eigenfrequencies and mode shapes). In order to generalize and simplify the development, equations are rendered dimensionless with regard to a character-istic length, chosen as the length L of the leading edge (beam 1), which also defines the wingspan. Dimensionless variables (with an overline) are then written:
x=x L
,
t= t L2 √ EI1𝜌
S1,
Pi= Pi L,
Qi= Qi L H= H L,
wi= wi L (6)To simplify the reading of the equations, the dimensionless variables will now be written without the overline (except the length ones as H to avoid any misleading).
For the modal analysis, Eq.(1)are rewritten dimensionless and in free vibrations (Pi = 0 and Qi = 0), as:
∀xi
,
t { w′′′′i +𝛿
4iẅ
i=0𝜑
′′ i −𝛾
2̈𝜑
i=0,
i=1,
2 (7) with𝛿
4 1=1, 𝛿
4 2= S2I1 S1I2, 𝛾
2 = EI1 GS1L2.
(8)Variables
𝛿
iand𝛾
represent the stiffness ratio in bending and twisting respectively, and the choice of the variable t give𝛿
14=1.It can be noted that
𝛾
is not dependent of the considered beam.By separating space and time variables, the deformations in bending and twisting are expressed as:
{
wi(x
,
t) = Φi(x)q(t)𝜑
i(x,
t) = Ψi(x)q(t),
i=1,
2 (9)with q(t)the modal coordinate. Eq.(1)in bending and twisting are then turned into:
⎧ ⎪ ⎪ ⎨ ⎪ ⎪ ⎩
̈
q= −𝜔
2q Φ′′′′i − (𝛿
i𝛽
)4Φi=0 Ψ′′i − (𝛾𝛽
2)2Ψi=0,
i=1,
2 (10)with
𝛽
4 =𝜔
2and𝜔
the angular frequency of the associated eigenmode. The solutions of the system are then expressed as:{
Φi(x) =Aicos(
𝛿
i𝛽
x) +Bisin(𝛿
i𝛽
x) +Cicosh(𝛿
i𝛽
x) +Disinh(𝛿
i𝛽
x) Ψi(x) =Eicos(𝛾𝛽
2x) +Fisin(𝛾𝛽
2x),
i=1,
2 (11)where Ai, Bi, Ci, Di, Ei, Fiare constants. Based on Eq.(2), the boundary and continuity conditions of the structure can then be turned into: ⎧ ⎪ ⎪ ⎪ ⎪ ⎪ ⎪ ⎪ ⎪ ⎪ ⎪ ⎪ ⎪ ⎨ ⎪ ⎪ ⎪ ⎪ ⎪ ⎪ ⎪ ⎪ ⎪ ⎪ ⎪ ⎪ ⎩ Φ1(0) =0 Φ′1(0) =0 Ψ1(0) =0 Φ1(1) = Φ2(0) Φ′1(1) = −Ψ2(0) Ψ1(1) = Φ′2(0) EI1 GJ2Φ ′′ 1(1) = Ψ ′ 2(0) GJ1 EI2 Ψ′1(1) = −Φ′′2(0) EI1 EI2 Φ′′′1(1) = −Φ′′′2 (0) Φ′′2(−H) =0 Φ′′′2 (−H) =0 Ψ′2(−H) =0 (12)
To determine the eigenmodes, Eq.(11)and the above conditions are written under the following matrix form:
M(
𝛽
)V=0 (13)with V= [A1B1C1D1A2 B2C2D2E1F1E2F2]T, and the matrix M(
𝛽
)defined by:M= ⎡ ⎢ ⎢ ⎢ ⎢ ⎢ ⎢ ⎢ ⎢ ⎢ ⎢ ⎢ ⎢ ⎢ ⎢ ⎢ ⎢ ⎢ ⎢ ⎢ ⎢ ⎢ ⎢ ⎢ ⎢ ⎣ 𝚽1(0) 0 0 0 0 0 0 0 0 𝚽′ 1(0) 0 0 0 0 0 0 0 0 0 0 0 0 0 0 0 0 𝚿1(0) 0 0 𝚽1(1) −𝚽2(0) 0 0 0 0 𝚽′ 1(1) 0 0 0 0 0 0 𝚿2(0) 0 0 0 0 −𝚽′2(0) 𝚿1(1) 0 0 EI1𝚽′′1(1) 0 0 0 0 0 0 −GJ2𝚿′2(0) 0 0 0 0 EI2𝚽′′2(0) GJ1𝚿′1(1) 0 0 EI1𝚽′′′1(1) EI2𝚽′′′2 (0) 0 0 0 0 0 0 0 0 𝚽′′2(−H) 0 0 0 0 0 0 0 0 𝚽′′′2 (−H) 0 0 0 0 0 0 0 0 0 0 0 0 0 0 𝚿′2(−H) ⎤ ⎥ ⎥ ⎥ ⎥ ⎥ ⎥ ⎥ ⎥ ⎥ ⎥ ⎥ ⎥ ⎥ ⎥ ⎥ ⎥ ⎥ ⎥ ⎥ ⎥ ⎥ ⎥ ⎥ ⎥ ⎦ (14)
with each line corresponding to a condition and each column to one of the coefficients[AiBiCiDiEiFi]. To enhance the matrix read-ing, the vectors𝚽and𝚿correspond to𝚽i(x) = [cos(
𝛿
i𝛽
x) sin(𝛿
i𝛽
x) cosh(𝛿
i𝛽
x) sinh(𝛿
i𝛽
x)]and𝚿i(x) = [cos(𝛾𝛽
2x) sin(𝛾𝛽
2x)]).To determine the structure’s eigenmodes, we are looking for the non-trivial solutions of system (13), so the ones which provide det(M) = 0.
𝛽
values which nullify the M matrix determinant then correspond to the eigenfrequencies of the structure, with the following formula which results from𝛽
4 =𝜔
2and Eq.(6):f=
𝛽
2 2𝜋
L2 √ EI1𝜌
S1.
(15)The mode shapes associated to those eigen modes, corresponding to the solutions(11), can then be determined by calculat-ing the unknown coefficients[AiBiCiDiEiFi]for a given
𝛽
value. To this end, since the determinant det(M)is null, system(13)is homogeneous and singular and have an infinity of solutions V. In order to determine the non-null values of the solutions
V = [AiBiCiDiEiFi], it is possible to normalize the eigenmodes by setting arbitrarily the value of one of them (for example
F2 = 1), then define a non-homogeneous new system (with a unique solution) to solve. Once the coefficients are determined, we can obtain the mode shapes by introducing them in Eq.(11). It must be noticed that their amplitudes will be relative to the value of the used normalization coefficient.
The above described methodology is a special case of spectral methods [44]. Eq.(13), solved by the proposed method, can result in a badly conditioned problem which prevents the solving and the obtention of the coefficients. In order to overcome this kind of problems, some other algorithms [45,46] can be used with an indirect determination of the eigen frequencies. In the particular case of the structures described in this article, no such problems have been encountered. The
𝛽
values are simply obtained in two steps. First, several initial values of𝛽
that nullify det(M)are obtained by computing det(M)in a given𝛽
range with a coarse sampling. Then, for each initial beta value, a Newton-Raphson algorithm is used to obtained𝛽
with a given suitable accuracy.3.4. Frequency response functions
In order to compute the deflection shapes of the structure at a given driving frequency, we will now focus on the Frequency Response Functions (FRF) in bending. Based on the classical vibratory mechanics [47], bending and twisting deformations vari-ables w(x
,
t)and𝜙
(x,
t)verify Eq.(1)and can be expressed as a modal superposition as following:⎧ ⎪ ⎪ ⎨ ⎪ ⎪ ⎩ wi(xi
,
t) = N ∑ n=1 Φ(n)i (xi)qn(t)𝜑
i(xi,
t) = N ∑ n=1 Ψ(n)i (xi)qn(t) (16)with i the beam number, n the mode number, N the number of modes taken into account,Φ(n)i (xi)andΨ(n)i (xi)the mode shapes in bending and twisting of the mode n, and qn(t)the modal coordinate. By substituting Eq.(16)into Eq.(1)and using the following orthogonality properties: ⎧ ⎪ ⎪ ⎨ ⎪ ⎪ ⎩ 2 ∑ i=1∫ Li 0 [
𝜌
SiΦ(p)i Φ(q)i +𝜌
JiΨ(p)i Ψ(q)i ]dx=mp𝛿
pq,
2 ∑ i=1∫ Li 0 [EIiΦ(p)i Φ′′′′(q)i +GJiΨi(p)Ψ′′(q)i ]dx=𝜔
2pmp𝛿
pq,
(17)with Lithe ith beam length,
𝛿
pqthe Kronecker symbol (𝛿
pq = 1 for p = q and 0 for p≠q) and mnthe modal mass of mode n, the nth modal coordinate verify:̈
qn+2𝜉
n𝜔
nq̇
n+𝜔
2nqn= En mn,
En= 2 ∑ i=1 ∫ Li 0 PiΦ(n)i dx (18)with
𝜉
nthe damping ratio of mode n and Enthe modal forcing.By modelling the structure forcing as a local periodic force applied at a point x0of the kth beam with an amplitude P0such as Pj(x
,
t) = P0𝛿
(x − x0)cos(Ωt), we can then obtain from Eq.(16)the expression of the FRF at a point x of beam i such as:H(x
,
Ω) =ŵ
i(x,
Ω) P0 = N ∑ n=1 Φ(n)i (x)Φ(n)k (x0) mn⏟⏞⏞⏞⏞⏞⏞⏟⏞⏞⏞⏞⏞⏞⏟
A(in) 1𝜔
2 n− Ω2+2j𝜉
nΩ𝜔
n⏟⏞⏞⏞⏞⏞⏞⏞⏞⏞⏞⏟⏞⏞⏞⏞⏞⏞⏞⏞⏞⏞⏟
Hn(Ω) (19)wherew
̂
(x,
Ω)is the complex amplitude of w(x,
t), such that:w(x
,
t) =Re[ŵ
(x,
Ω)ejΩt].
(20)The extension of this modelling methodology to the entirety of a prototype skeleton is obtained by considering more beams and nodes.Appendix Agives as an example the M matrix for a four beams node.
4. Wing geometry design
In this section, we apply the modelling strategy exposed in the previous section to simple wing geometries for which full parametric studies are at hand, to analyse their frequency response and the frequencies of its eigenmodes. Then, a general optimization strategy is introduced for more complex wing geometries with more than two free geometry parameters.
Fig. 5. “L” shaped wing with thorax links and actuation.
4.1. ”L” shaped wing
On a first approach, a simple geometry is selected to illustrate the methodology and to perform a parametric analysis. A wing with a “L” shaped geometry is chosen, as shown inFig. 5, which could look like an insect wing with its leading edge and chord modeled by equivalent beams (respectively beams 4 and 5). This wing model is completed with the flexible thorax links (beams 2 and 3) and the actuation beam (beam 1), based on prototypes tested in section6. Since our prototypes and their actuation are symmetrical, we can only model half of them. As depicted inFig. 5, this symmetrical condition is a guided boundary conditions on beam 1 such as:
⎧ ⎪ ⎨ ⎪ ⎩ w′ 1(0) =0 T1(0) =0 N1(0) =0 (21)
These conditions ensure a free transverse displacement with a locked bending rotation and a free twisting rotation on this end of the beam.
We assume the thorax as a completely rigid element since it is at least three times thicker than any other part of the pro-totype. The boundary conditions used on the thorax links (beams 2 and 3) are then clamped ones. These conditions ensure no transverse displacement and a locked rotation in bending like in twisting on these beams ends. As seen in the previous section, the chord end (beam 5) is set as a free end. The continuity between the different beams is ensured with the continuity conditions depicted in Eq.(A.12).
The material parameters used are those of the SU-8 polymer with a density of
𝜌
= 1227 kg m−3, a Young modulus of E = 2 GPa and a Poisson ratio of𝜈
= 0.
22 (ratio used to define Coulomb modulus G = E∕(2(1+𝜈
)))4.2. Modal analysis
We use a length L = 1 cm, characteristic of our prototypes, which defines the leading edge length l4(beam 4), an actuating
spacing from the thorax of 5 mm (length of beam 1, l1 = L∕2), thorax links of 1 mm long (length of beams 2 and 3, l2,3 = L∕10) and a chord length of 5 mm (length of beam 5, l5 = L∕2). Square sections of 80
𝜇
m×80𝜇
m for the veins (beams 1, 4 and 5) and 40𝜇
m×40𝜇
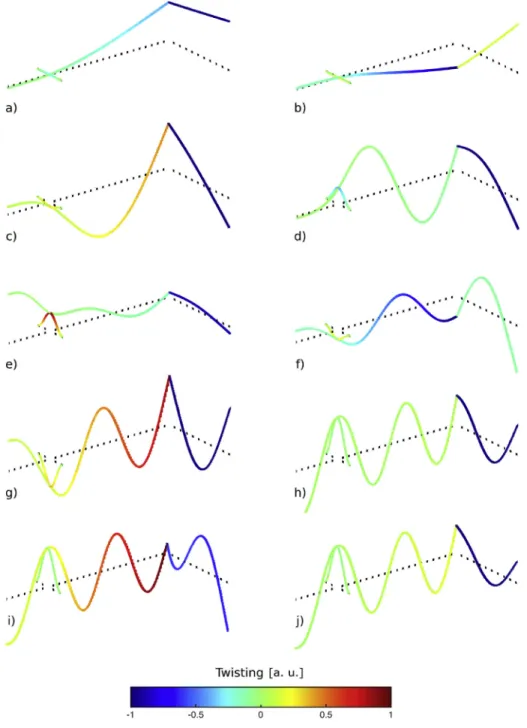
m for the links (beams 2 and 3) are chosen since the fabrication process impose to use parallelepipedic sections.The mode shapes of this wing structure, obtained with the modal analysis depicted in section3, are shown inFig. 6. The structure shows at low frequencies two eigenmodes with mode shapes corresponding to the seeked motions: a flapping mode (Fig. 6a), with leading edge and chord ends in phase, and a twisting mode (Fig. 6b), where these ends are in phase opposition. By observing the higher eigen modes (Fig. 6(c)–6(j)), we can note that these are mostly characterized by an ondulation of the leading edge beam. These deformations of the leading edge render them unusable for our application. We can also notice that for the flapping mode, the twisting along the leading edge stays almost constant while for the twisting mode it increase monotonously by moving away from the thorax links. In addition, no mode made of only pure twisting can be observed. This behaviour seems logical since the first twisting modes of a beam are generally higher in frequency than the bending ones. In our case, from Eq.(10)
and for a unique beam of length L and thickness h, we can deduce the ratio between the bending and the twisting frequencies as:
𝜔
twist𝜔
bend =𝛿
2𝛾
= √ 6 1+𝜈
L h.
(22)Then, since L
≫
h,𝜔
twist≫ 𝜔
bend.This modal analysis highlights three remarkable property of this kind of structure. Firstly, there are two modes with mode shapes which reproduce the two required motions: a flapping and a twisting. Secondly, those two modes appear successively in the spectrum and thirdly, they are the two fundamental modes (the two first ones in the spectrum). It is then possible to look for
Fig. 6. Mode shapes in bending (beams deformations) and twisting (color variations) of the 10 first modes of a “L” shaped wing structure (undeformed structure in dotted
lines) (a. u. means arbitrary units). (For interpretation of the references to color in this figure legend, the reader is referred to the Web version of this article.)
a design that brings those two modes with closer eigenfrequencies, to apply our strategy of mode combination. In the following, we explore this idea successively with a parametric analysis and a numerical optimization.
4.3. Parametric analysis
Since the previous modal analysis demonstrates that the two first modes are suitable, we can then narrow our study on the frequency range which contains them. The two selected modes are illustrated inFig. 6(a) and (b). Notice that the wing membrane is only plotted as an interpolation of the beams positions to ease the understanding of the deformed shapes, reminding that its structural effect is neglected in this study. By looking at the FRF between the leading edge end point and the actuator (Fig. 7(c))
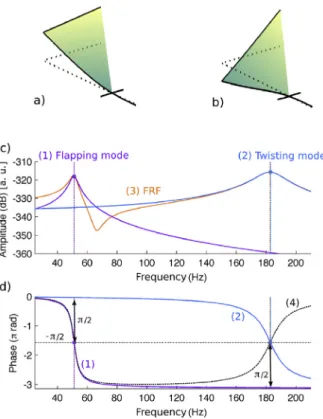
Fig. 7. Simulation of a “L” wing structure with thorax links and actuation. a) Flapping and (b twisting mode shapes (undeformed structure in dotted lines). FRF taken on
the leading edge end: c) modal coordinates amplitudes in (1) flapping and (2) twisting and their (3) superposition amplitude; d) phases in (1) flapping and (2) twisting and their (4) difference (a. u. means arbitrary units).
as well as its modal components, we can observe that the two modal frequencies are quite far from each other, with a gap above 100 Hz.
The outcome of this frequency gap is highlighted by the phases given inFig. 7(d). Indeed, by examining the phase shift (curve (4)) between the flapping (curve (1)) and the twisting (curve (2)) modes, it clearly appears that the quadrature frequen-cies (
𝜋
∕2 phase shift) between the two modes are practically the same as their eigen frequencies. By looking at the modes amplitudes on these frequencies (Fig. 7(c)), we also notice that this frequency gap implies that, on each quadrature frequency, one of the modes own by far a larger amplitude than the other one. Therefore, an actuation at these frequencies will result in a deformation in which the mode shape of the corresponding mode will be predominant. Thus the first quadrature will only provide a flapping kinematics with practically no twisting while the second one will produce a twisting motion without any flapping. Consequently, this wing configuration do not allow to combine properly the two modes of flapping and twisting as wanted.This observation then demonstrates that it is mandatory to bring closer in frequencies the two modes in order to produce a combination of their mode shapes in a quadrature phase shift. Thus it is essential to identify the relevant geometrical parameters of the structure regarding this frequency criterion. For this purpose, as shown inFig. 8(a), we process to a parametric study in order to observe the influence of two geometrical parameters of the structure: the chord length H and its position along the leading edge x. Links positions and beams sections are kept constant and beams 1,2 and 3 lengths stay the same as in the previous example in order to limit the number of parameters. The frequency evolution of each mode regarding these two parameters is given inFig. 8(b) and (c). From the parametric surface describing the twisting mode frequency evolution (Fig. 8(c)), we can notice that the position x variation along the leading edge practically do not impact the twisting mode frequency while the chord length H variation affects it in a much more relevant way. Indeed, an increasing chord length is followed by a lowering of the twisting mode frequency regardless of the chord position. These trends can be explained by the monotonous evolution of twisting rotation along the leading edge. Thus, the chord position can not impact the twisting mode frequency since the added inertia on this motion does not vary in regard of the chord position. However since a chord length variation modifies this inertia it will then impact the associated mode frequency.
The flapping mode frequency, given inFig. 8(b), shows on the other hand a high dependency to the two parameters. While the flapping mode frequency is not that much sensitive to the chord length H when it is located near to the thorax links (i.e. small x∕L ratio), this sensitivity arises with its distance from the thorax. Hence, the raise of the distance chord-thorax (x∕L ratio)
is followed by a growing impact of the chord length on the flapping mode frequency, which is then lowering relevantly. These trends could be explained by the transverse displacement rise along the leading edge, in such a way that an inertia located on
Fig. 8. Parametric study processed on “L” shaped wing with thorax links and actuation: a) used geometrical parameters diagram; variations of b) flapping mode frequency,
c) twisting mode frequency and their d) difference according to chord length H (ordinate) and position x (abscissa); optimal area in dotted circles.
a small displacement area (i.e. close to thorax) will have a small impact on the frequency while an inertia located on a high displacement area (i.e. on the leading edge end) will get a strong influence on the mode frequency.
As the aim is to get the two modes close in frequency, by raising the flapping mode and lowering the twisting mode, these observations imply the following settlement: getting a wing structure with a chord near to thorax, in order to mini-mize its length impact on the flapping mode, while keeping a sufficient length to lower the twisting mode frequency. This length should though be less than the leading edge one. Indeed, we can notice inFig. 8(b) that, for a chord length longer than the leading edge one, the flapping mode frequency will fall off even combined with a chord position close to the tho-rax.
The calculation of a wing structure in agreement with these criteria, shown as dot circles inFig. 8(b) and (c), confirms this choice since we can still observe the two modes with the seeked motions, as shown inFig. 9(a) and (b). By studying the FRF observed on a point at the end of the leading edge (given inFig. 9(c and d)), it appears that the two modes are closer in frequency as predicted (20 Hz gap against more than 130 Hz inFig. 9(c and d)). Moreover, as an achievement, the amplitudes of each modes are not anymore neglectible at the quadrature frequencies.
To temper this result, by comparingFig. 9(b) and (c) withFig. 7(b) and (c), we can see that the twisting mode show less leading edge bending deformation than in the previous configuration. This deformation loss will then be materialized as a loss in amplitude on the actual prototype. Additionally, it can also be noticed that this wing geometry seems not suitable to produce
Fig. 9. Simulation of an “inverted L” wing structure. a) Flapping and (b twisting mode shapes (undeformed structure in dotted lines). FRF taken on the leading edge end: c)
modal coordinates amplitudes in (1) flapping and (2) twisting and their (3) superposition amplitude; d) phases in (1) flapping and (2) twisting and their (4) difference (a. u. means arbitrary units).
some lift. Indeed, it does not look like insects ones and does not possess any membrane on the high amplitude area which produce the maximum lift force [48,49] (i.e. on the leading edge and chord ends). So, even if this wing geometry is adapted to generate the wanted kinematics, this parametric study shows the necessity of a further optimization process according to other criteria than only getting the two studied modes close in frequency.
4.4. Numerical optimization
In order to improve the wings kinematics, we choose to process to a parametric optimization on a more complex geome-try shown inFig. 2. This choice is motivated according to our objective which is to trig on the geometrical parameters of the wings, as shown inFig. 2, which are the position (H1) and length (L) of thorax links, the position (H2), the angles (
𝜃
1,𝜃
2and𝜃
3) and length (W1, W2and W3) of the different veins of the structure. This optimization is based on the minimization of anon-metaheuristic cost function settled accordingly to the criteria chosen to obtain an optimal solution. Indeed, although meta-heuristic cost functions allow to obtain a global solution by using algorithms based on physical analogy, as genetic algorithms, they stay relatively complex to implement and present a sizeable calculation time [50,51]. Consequently, even if it will provide local solutions depending on the starting point, the choice of this cost function type is motivated by the small calculation time required. To this end, the Matlab optimization function “fminsearch” (which is minimizing a Rosenbrock’s function) will be used.
In order to define the adapted cost function, we need to specify the criteria to fulfill. As exposed in section2and demonstrated in section4.2, to combine properly the two flapping and twisting modes, it is necessary to ensure their frequency closeness. Thus, our first criterion is to get the two quadrature frequencies as close as possible. The second criterion is to set a working frequency range for the prototype, with a frequency target around 100 Hz. This criterion also ensures that the algorithm will not provide absurd results such as a null frequency. The third criterion is finally to be able to generate the largest motion amplitude while keeping an equivalent contribution of each mode in the combined kinematics. Indeed, a combined motion with a largely predominant mode would be pointless. It is then mandatory to ensure an equivalent excitability (ratio between the wing and the actuator amplitudes) in order to produce a kinematics composed of flapping as well as twisting. The following cost function is then settled to fulfill these criteria:
C=
𝛼
|ftarget−fquad1| +𝛽
|fquad2−fquad1| +𝛾
|||||
max∣f(Aflap) −max∣f(Atwisting)
max(max∣f(Aflap)
,
max∣f(Atwisting)|| ||
max∣f(•)corresponds to the maximal value of(•)on the frequency range f. The different terms of this function are defined as: –
𝛼
,𝛽
and𝛾
: weight coefficients to emphasize or devalue a criterion regarding the others with respect to its influence on thecost function, those criteria are here taken as equal importance such that the coefficient set
𝛼
=𝛽
=𝛾
= 1 is chosen. – ftarget: the target frequency for the two modes, it is arbitrarily settled to 100 Hz, ensuring that the algorithm will not convergeon a physically absurd frequency such as a null one (Fig. 10(a)).
– fquad1and fquad2: the two quadrature frequencies, they are deduced from Eq.(19)by evaluating the phase shift between the two modal coordinates (arg[Htwist(fquad)] − arg[Hflap(fquad)] =
𝜋
∕2), the objective is to get them close from each other(Fig. 10(b)). It must be noticed that trigging directly on the two modes frequencies to get them close could be harmful in regard of this criterion. Indeed, by looking at the two unimodal phases (1) and (2) and their difference (3) provided in
Fig. 10(c), we can observe that if the two modes are too close in frequency their phase shift will never reach the quadrature value
𝜋
∕2 which then lead to the impossibility to combine properly the two modes in the seeked way. The choice is thus made to minimize the frequency gap between the two quadrature frequencies which will ensure the modes frequencies closeness with the warranty of at least one existing quadrature frequency.– Since these optimization criteria rely on one FRF data, it is essential to choose the used structure point wisely. The chosen point (shown in red inFig. 2) is located on the leading edge extremity in order to ensure that the flapping and twisting amplitudes are well evaluated by avoiding to observe a vibration node which could distort the amplitudes comparison. Aflap
and Atwistare then the flapping and twisting amplitudes of the respectives unimodal FRFs, they are obtained by considering
only the given mode in Eq.(19). The term|max∣f(Aflap) − max∣f(Atwist)|is employed to ensure an equivalent contribution of each mode in the wing kinematics by minimizing the gap between the flapping mode amplitude at the resonance max∣f(Aflap)
and the twisting mode at the resonance max∣f(Atwist), as illustrated inFig. 10(c). This criterion is then a tool to avoid the
predominance of one mode in regard of the other one on the quadrature frequencies by enforcing equivalent amplitudes. Finally, the 1∕ |||max(max∣f(Abattement)
,
max∣f(Atorsion)|||term allows to maximize the two modes amplification by maximizing their amplitudes at the resonance. This last criterion then warrants the largest amplitude possible during the prototype actuation.The prototype geometry shown inFig. 18has been obtained by this optimization method.
5. Experimental setup
In order to validate these theoretical conclusions and results, we tested several prototypes and used specific experimental protocols. The fabrication of the prototypes and the experimental setup are described here. The prototypes are fabricated with dedicated MEMS technologies and are composed of a 3D skeleton made of multiple layers of SU-8 photoresist, with thicknesses ranging between 40
𝜇
m and 150𝜇
m, and wings membranes, made of a 400 nm thin film of Parylene C, which results in a 20 mm–30 mm wingspan. All the details can be found in Refs. [12,52]. The obtained fully polymeric wings structure can be con-sidered as equivalent to natural insect wings [11,41,42]. The wings are then driven simultaneously by a single electromagnetic actuator placed at the middle of the thorax and actuated by a sine current. This electromagnetic actuator has the advantage of being easy to manufacture and integrate into the prototypes, having a simple geometry, fast response speed, high bandwidth, and more particularly, the possibility of tuning a wide range of frequencies. The total weight of the prototypes vary from 15 mg to 30 mg, which places them in the insects dimensions range.The experimental study of these prototypes wings kinematics is then divided in two steps. The first, processed at small amplitude, is used to acquire the FRF on several points of the wings in order to reconstruct their mode shapes. The second one has then for purpose to record and study the high flapping amplitude kinematics.
5.1. FRF and mode shapes acquisition
To study the kinematics of a prototype and compare it to the theoretical results, we are looking to measure its structure FRFs and especially of its wings. The purpose of this measurement is then to detect the different existing vibration modes and to observe the quadrature motions. In order to limit the prototype handling, a single measurement bench (shown inFig. 11) on which the prototype is glued on a cantilever beam has been developed.
The FRFs are measured with a scanning laser vibrometer (Polytec PSV400), which has the advantage of being a non contact measurement method. This device, based on laser interferometry, allows to measure the velocity on a point of a vibrating structure. It is then possible to calculate the FRF on this point by comparing the Fourier decomposition of the velocity signal to the actuation force one. In our case, this force signal is replaced by the supply current in the coil, since this one is linearly related to the magnet displacement and so to the actuation force. From those measurements on different points of the structure, it is then possible to observe the deformed shapes of the prototype wings, since these shapes are deduced from amplitudes and phases values on the measured points for a given frequency.
Given that this measurement is based on the interference of the emitted laser beam with the reflected one, this reflected beam must then be precisely directed on the vibrometer sensor. According to this constraint, it is necessary to use a small
Fig. 10. Optimization criteria applied on the flapping (1) and twisting modes (2) FRFs and their phase difference (3): (a) proximity with a target frequency ftarget, (b)
closeness of the two quadrature frequencies fquad1and fquad2, (c) equivalent amplitudes of the two modes and (d) maximization of the flapping amplitude (a. u. means
arbitrary units).
Fig. 11. Experimental setup for FRFs and deformed shapes acquisition.
flapping amplitude for this measurement. Indeed, a high flapping amplitude will result in a wing angle unsuitable to redirect the reflected beam in the sensor, thus the flapping angle must stay small to enable this measurement.
5.2. High amplitude kinematics recording
In order to observe the high amplitude motions, unlike the previous setup, the prototype is actuated at a given frequency with a high intensity sinusoïdal current (300 mA) without damaging the coil. As illustrated inFig. 12, a speedcam Vision Phantom V 7.4 is used to record the wing motion. This kind of camera allows to record 9152 frames per second with a resolution of 400×800 pixels. Since the prototypes working frequency range is between 0 and 300 Hz, we can then obtain at least 30 frames per wings motion cycle and so study its kinematics. As shown inFig. 12, a lighting system is also added with a reflecting panel to ensure an appropriated light exposure as needed for this kind of recording.
6. Experimental results and discussion
In this section, we describe the results of both theoretical design and experimental analysis for three selected families of prototypes, of increasing complexity. The aim is to validate the model and optimization results exposed in section4. The first family of “L wing” prototypes has the simplest shape. Then, the “F wing” family is the result of the parametric optimization of the “L wing”, by changing the chord length and position. Finally, the “Wind rider” family is the result of a numerical optimization on nine free parameters.
6.1. “L wing” prototypes
Since the main objective of this research is to develop a bio-inspired nano air vehicle, the first prototype features “L” shaped wings with a geometry close to those observed on insects as shown inFig. 13. As discussed in section4.2, this type of
geom-Fig. 12. Experimental setup for high amplitude wing kinematics recording.
Fig. 13. Scheme and photography of a “L Wing” prototype.
etry provides effectively a flapping and a twisting modes. However, we also show that the frequencies of these two modes do not allow to combine properly their motions with enough amplitude to reproduce the seeked kinematics, although, it is still necessary to confirm experimentally these theoretical conclusions as well as to validate the wing structure modelling and its hypothesis. For this purpose, we then crafted and tested firstly these “L Wing” prototypes. Results are given inFig. 14.
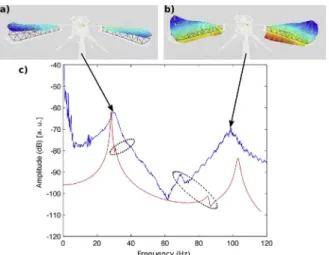
As expected, we can observe on the experimental FRF (blue lineFig. 14(c)) the existence of two resonance peaks located at 30 Hz and 100 Hz. The deformed shapes at these frequencies are illustrated inFig. 14(a) and (b) respectively. We can easily notice that these two deformed shapes are well corresponding to a flapping motion for the first one and to a twisting motion for the second one. Indeed,Fig. 14(a) shows that the leading edge and the chord ends are moving in phase while onFig. 14(b)
Fig. 14. Calculation/measurement comparison for a “L Wing” prototype: a) flapping mode experimental deformed shape, b) twisting mode experimental deformed shape,
c) theoretical (red line) and experimental (blue line) FRFs obtained on a point of the leading edge, antisymmetrical modes marked by dotted ellipses (a. u. means arbitrary units). (For interpretation of the references to color in this figure legend, the reader is referred to the Web version of this article.)
Fig. 15. Scheme and photography of a “F Wing” prototype.
these ends are moving in a phase opposition. This observation then validates the existence of the two wanted motions as well as the structure dynamic behaviour predicted by the modelling. Furthermore, by comparing the experimental (blue lineFig. 14(c)) and theoretical (red lineFig. 14(c)) FRFs, it clearly appears that the resonance frequencies predicted by the modelling and the measured ones are relatively close. Indeed, the flapping mode is theoretically located at 28 Hz against 30 Hz on the measurement while the twisting mode is estimated at 105 Hz by the modelling and measured at 100 Hz. These gaps between theoretical and experimental frequencies can be explained by the fact that the used modelling only takes into account the prototype skeleton dynamic behaviour and neglects the aerodynamic effects linked to the wings membranes. However even if this part, which can seem primordial in the prototype behaviour, is neglected the modelling still demonstrates its reliability for the identification of the two modes. These observations then validate this dynamic modelling for prototypes dimensioning.
Other resonance peaks can also be noticed, with smaller amplitudes, between the flapping and twisting modes (dotted ellipsesFig. 14(c)). These two resonances correspond to the prototype antisymmetrical modes. Their existence is linked to the magnet positioning during the prototype assembling. Indeed, if the magnet is perfectly centered these modes cannot be excited neither observed. If we induce a small dissymmetry in its positioning to produce a dissymmetrical forcing, it will imply the emer-gence of this supplementary modes in the calculation as well as in measurements. This observation then shows that the magnet is lightly misplaced on the tested prototype. However, it still must be noticed that these antisymmetrical modes amplitudes are far smaller than the symmetrical ones and so that their influence on the prototype dynamic behaviour is neglectible.
The important experimental frequency gap (70 Hz) and the significant amplitude fall between the two modes linked to this gap then confirming that this wing design is not suitable to combine properly the two motions with enough amplitude.
Fig. 16. Calculation/measurement comparison for a “F Wing” prototype: a) flapping mode experimental deformed shape, b) twisting mode experimental deformed shape,
c) theoretical (red line) and experimental (blue line) FRFs obtained on a point of the leading edge (a. u. means arbitrary units). (For interpretation of the references to color in this figure legend, the reader is referred to the Web version of this article.)
Fig. 17. Frame by frame high-speed camera recording for a “F Wing” prototype with an actuation frequency of 130 Hz. Wing membrane colored in red, wing extremity
initial position in dotted blue line, wing extremity current position in dotted orange line, slope reversal occurring around sequences 1 and 4. (For interpretation of the references to color in this figure legend, the reader is referred to the Web version of this article.)
6.2. ”F wing” prototypes
In order to obtain a suitable mode combination, we choose to get the two modes close in frequency by modifying the wing design. The parametric study on the chord length and position described in section4.3leads to a wing design based on an inverted “F” wing geometry with high length chord located near the thorax, as shown inFig. 15. Like in the previous results, we can notice on an experimental FRF of this new prototype (blue lineFig. 16(c)) the existence of two resonance peaks. Again and as expected these two resonance frequencies correspond to a flapping and a twisting modes of which measured deformed shapes are illustrated inFig. 16(a) and (b) respectively. As previously, we can observe that in the case ofFig. 16(a) leading and trailing edges ends are well in phase while they are in phase opposition inFig. 16(b).
By comparing the experimental (blue lineFig. 16(c)) and theoretical (red lineFig. 16(c)) we can notice that, like for the previ-ous prototypes, the modelling allows to estimate accurately the frequency range in which the two modes are located. However, contrarily to the previous case, although theoretical and experimental frequencies of flapping mode are still close (respectively 100 Hz and 105 Hz), the inaccuracy on the twisting mode frequency estimation is on the contrary amplified (estimated at 120 Hz and measured at 145 Hz). These results point out the modelling limits. Indeed this modelling is firstly a pre-design tool but is not made for a precise prediction of the measurement. It is called to suggest the most suitable geometries for a proper modal combination, the experimental tests then allowing to measure amplitudes and adjust frequencies. These errors of estimation are then not harmful.
The main result of this experimental FRF is that the two modes are effectively closer in frequency than in the previous wing configuration. Moreover, the analyse of this FRF shows that the amplitude between the two modes does not fall off as roughly
Fig. 18. Scheme and photography of a “Wind Rider” prototype.
Fig. 19. Calculation/measurement comparison for a “Wind Rider” prototype: a) flapping mode experimental deformed shape, b) twisting mode experimental deformed
shape, c) theoretical (red line) and experimental (blue line) FRFs obtained on a point of the leading edge (a. u. means arbitrary units). (For interpretation of the references to color in this figure legend, the reader is referred to the Web version of this article.)
as for the “L Wing” prototype. The essential effect is that the amplitude on the quadrature combination frequencies is then non-neglectible (same order as for resonance frequencies).
With a frequency sweep and by looking at the deformed shapes obtained with the laser vibrometer, it is then possible to determine the frequencies which feature a modal combination. A recording of this combined motion, made with an actuation frequency of 130 Hz, is shown frame by frame inFig. 17. By tracking the chord motion (dotted orange line) and comparing it with its initial position (dotted blue line), we can observe that the wing (colored in red) kinematics is well composed of a flapping motion providing the lateral displacement (i.e. right to left in sequences 1 to 3 and left to right in sequences 4 to 6) and a twisting motion acting on its slope (i.e. the slope reversal occurs around sequence 4). This recording confirms that the concept of combining these two modes in a quadrature phase shift is exploitable for the purpose of reproducing a kinematics close to insects wings one, although a few restrictions must be noticed. Firstly, the flapping amplitude obtained is still far smaller than insects one since the recorded flapping angle is here of 10◦against near 60◦for insects. Moreover, this wing design is departing from the ones observed in nature and from an aerodynamic perspective this configuration does not seems adapted to
lift generation. Indeed this wing geometry does not feature a lot of membrane surface in the high amplitude area, and so with high velocity, which are the leading and trailing edges ends.
These prototypes then validate experimentally the combination concept from a kinematical point of view. These results demonstrate the feasibility of designing a structure which allows to combine two motions in a quadrature phase shift when vibrating. Hence, the keypoint is to improve these results in terms of amplitudes, frequencies and useful wingspan to produce lift.
6.3. “Wind rider” prototypes
A new family of prototypes is proposed here in order to improve the vibratory behaviour of the previous “F wing” prototypes. The new geometry features an added vein and a tilted leading edge which enable to extend noticeably the wing surface as illustrated inFig. 18. This configuration permits to redistribute the membrane surface on the high velocity area while preserving the seeked dynamic behaviour. Inspired by insects wings specificities [53–55], a section variation along the leading edge and intermediate veins are also added. It provides to insects a rigidity modulation along the leading edge and enable to maximize its flapping amplitude. For this “F wing” prototypes, we also leave free up to nine parameters, defined inFig. 2, and we perform a numerical optimization as described in section4.4. The purpose of the optimization stays unchanged. We aim to get the flapping and twisting modes frequencies close while maximizing their amplitudes and keeping a working frequency range in the order of 100–150 Hz.
A theoretical FRF of this optimized wing is given inFig. 19(c) (red line). We can verify with the deformed shapes, illustrated inFig. 19(a) and (b), that the two measured modes are well corresponding to flapping and twisting modes of the wing. By comparing theoretical and experimental FRFs (respectively red and blue lines inFig. 19(c)), we can observe that once again
Fig. 20. Frame by frame high-speed camera recording for a “Wind Rider” prototype with an actuation frequency of 190 Hz. Wing membrane colored in red, wing extremity
initial position in dotted blue line, wing extremity current position in dotted orange line, slope reversal occurring around sequences 1 and 5. (For interpretation of the references to color in this figure legend, the reader is referred to the Web version of this article.)