Handle ID: .http://hdl.handle.net/10985/13516
To cite this version :
Nicolas CONIGLIO, Sabeur MEZGHANI, Mohamed EL MANSORI, J. CABRERO - Effect of nano-penning surface texturing on self-cleaning function - Surface and Coatings Technology - Vol. 353, p.126-134 - 2018
Any correspondence concerning this service should be sent to the repository Administrator : [email protected]
ACCEPTED MANUSCRIPT
1
Effect of Nano-Penning Surface Texturing on Self-Cleaning Function
N. Coniglio1, S. Mezghani2 M. El Mansori1 and J. Cabrero3
1Arts et Métiers ParisTech d’Aix-en-Provence, Laboratory of Mechanics, Surface and Materials Processing (MSMP-EA7350), 2
cours des Arts et Métiers, 13617 Aix-en-Provence – France
2
Arts et Métiers ParisTech de Châlons-en-Champagne, Laboratory of Mechanics, Surface and Materials Processing (MSMP-EA7350), Rue Saint Dominique - BP 508, 51006 Châlons-en-Champagne– France
3
Saint Gobain, CREE, 550, Avenue Alfred Jauffret, BP 224, 84306 CAVAILLON Cedex, France
ABSTRACT:
Surface texturation at micro- and meso-scales plays an important role in applications where cosmetic, aesthetic and self-cleaning functionalities are specified. This research paper deals with a multiscale surface, in which texturing and texture have a larger influence because they are scaled differently. The experimental approach highlights the important effect of texture and texturing on the anti-fingerprinting performance rated in term of surface wettability. We examine first, in detail, the wetting response of surfaces textured on aluminum alloy 6063 plates using nano-peening with various processing parameters. Roughness was measured by atomic force microscopy (AFM) and interferometry. Surface wettability was quantified using the sessile drop method. The calculation takes into account the wetting behavior of the textured surfaces at different scales. Correlations were made between the surface roughness and its functionality.
1. INTRODUCTION
Nano peening processes are applied to materials for manufacturing functional surfaces. The process consists in impacting the surface of a component by multiple high velocity shots that induce plastic deformation on the surface layer and subsequently affecting the surface properties such as its wettability [1]. The self-cleaning and Anti-Fingerprint (AF) functions are often demanded today for engineered surfaces. These surfaces are amphiphobic surfaces that possess
ACCEPTED MANUSCRIPT
2 non-wetting behavior simultaneously against water (hydrophobicity) and fats (oleophobicity) [2]. Amphiphobic properties are achievable by specific chemical composition and topography design, such as lowering surface free energies [3][4][5] and designing functional surface textures [6][7][8]. From a thermodynamic point of view, the solid-liquid system, free of any chemical reaction, tends to minimize its free energy via physical interactions and bonding formation [9]. Lowering the solid surface energy enhances the hydrophobicity. However a specific roughness is required for achieving superhydrophobic surfaces [10][11][12][13][14][15][16][17][18][19]. A designed roughness affects the surface wettability by changing the solid-liquid contact line geometry or the quantity of air trapped in the asperities underneath the liquid drop (air-solid composite surface) [9][20]. Hierarchical surfaces with nano, micro, and macro multi-scale structures are in particular relevant for achieving liquid repellent properties [21][22]. The surface structure [23][24] and roughness [25][26][27] are important for producing non-wetting behaviors. The evaluation of the fingerprint properties is usually restricted to the surface wettability against water, hexadecane, oleic acid [2] and artificial fingerprint liquid [28].
Sand blasting [29][30], surface mechanical attrition treatment (SMAT) [1], and shot peening [31] are currently used for modifying the wettability of metal surfaces by controlled generation of specific roughness and texture profiles. A rough and hydrophilic surface is created by deforming the surface by particle impacts. Nevertheless, the correlation between the process parameters and the induced wetting properties remains not well defined.
The present work investigated the anti-fingerprint properties of aluminum surfaces manufactured using various nano-peening process parameters. These parameters being confidential, the surfaces were characterized by roughness measurements and electronic microscopy observations. Their wettability was measured with the sessile drop method using two known liquids and compared to the polished aluminum as prior to peening performance.
ACCEPTED MANUSCRIPT
3
2. THEORETICAL BACKGROUND 2.1. Roughness Characterization
The deformed nano-peened surfaces can be described quantitatively using the common roughness criteria [32]. The heights Yi of the profile at each position (x,y) are calculated relatively to the
nominal shape of the surface. The arithmetic mean deviation of the assessed profil Sa is the most
used parameter: Sa = 1 N(∑ |Y𝑖| N i=1 ) (Eq.1)
However, a single roughness value may not be enough informative to describe the topography of a surface. Thus additional parameters should be used.
In order to study the symmetry and peakedness of the profiles, two parameters of skewness (Ssk)
and kurtosis (Sku) have been defined. Skewness is a measure of the symmetry of the curve
describing the height distribution. A profile with a majority of valleys has negative skewness. A symmetrical height distribution with as many peaks as valleys has zero skewness. The numerical formula used to calculate is as follow:
Ssk = 1 NSq3(∑ Yi 3 N i=1 ) (Eq.2)
, where Sq is the root mean square (RMS) of a profile composed of N points of height Yi.
Sq = √1
N(∑ Yi 2 N
i=1 ) (Eq.3)
Kurtosis parameter Sku represents the peakedness of a profile. A surface with a narrow height
distribution has a kurtosis value greater than 3, while a surface that has a well spread out height distribution has a kurtosis value of less than 3. A surface with a Gaussian height distribution has a kurtosis value of 3. The kurtosis parameter is calculated by:
Sku= 1
NRq4(∑ Yi 4 N
ACCEPTED MANUSCRIPT
4 Finally the roughness parameter Sdr characterizing the developed interfacial area ratio is estimated
as the ratio of the real (Areal) to projected (Aproj) surface areas:
𝑆𝑑𝑟 = 𝐴𝑟𝑒𝑎𝑙
𝐴𝑝𝑟𝑜𝑗− 1 (Eq.5)
Surface irregularities induced by nano-peening process are formed by intersections of the craters generated by each single impact. Although the shot impacts are random during the process, observations have revealed that for high surface coverage, the shot impacts are distributed on the treated surface in a relatively regular manner. Accordingly the mentioned standard roughness parameters are appropriate to characterize the surface topography of nano-peened specimens.
2.2. Wettability Measurement
The wettability of a surface by a liquid in a gaseous environment results in part from the interactions between the gas, liquid and solid surface energies. Among the numerous methods existing to characterized wettability [33][34], the sessile drop method is well adapted to the characterization of the wetting properties of solid surfaces by known liquids. Measurements of liquid advancing or receding angles are acquired by imaging a liquid drop placed on a flat, unwetted solid surface. Historically analyzed using the Laplace equation and the Bashforth-Adams tables [33], the norm AFNOR EN 828 [35] proposes the use of various known liquids to deduce the solid surface energy. The analysis is founded on the Young-Dupré equation for a perfectly flat homogeneous solid surface wetted by a liquid drop. The measured contact angle results from the three interfacial energies in mechanical equilibrium:
SV =LS +LV cos (Eq.6)
, whereSV et LS are the solid-vapor and liquid-vapor superficial tensions, respectively. A
practical disadvantage of Young’s equation is that it contain only two readily measurable quantities : the contact angle and the liquid vapor surface tension LV.
ACCEPTED MANUSCRIPT
5 Several semi-empirical approaches have been developed to calculate the solid surface tension. The most popular is the approach developed by Owens and Wendt [35]. They extended Fowkes’ concept of surface tension components by dividing the total surface energy into two components, a dispersion force component and a hydrogen bonding component. The latter component consists of both hydrogen bonding and dipole-dipole interactions. Implementing the polar (subscript P) and dispersed (subscript D) components of the surface tensions SV and LS into Eq. 6
leads to [35]: (1+𝑐𝑜𝑠𝜃)∙𝜎𝐿𝑉 2√𝜎𝐿𝑉𝐷 = √𝜎𝑆𝑉𝑃 ∙ √𝜎𝐿𝑉𝑃 𝜎𝐿𝑉𝐷 + √𝜎𝑆𝑉𝐷 (Eq.7)
, where 𝜃 is the contact angle for a given liquid drop. Linear best-fitting of (1+𝑐𝑜𝑠𝜃)∙𝜎𝐿𝑉
2√𝜎𝐿𝑉𝐷
versus √𝜎𝐿𝑉𝑃
𝜎𝐿𝑉𝐷 estimates the polar 𝜎𝑆𝑉
𝑃 (slope) and dispersed 𝜎
𝑆𝑉𝐷 (residue) components. In this approach,
the contact angles of at least two liquids with known surface energy components, such as deionized water and glycerol, are required in order to calculate the dispersive and polar components of the solid surface energy.
2.3. Wettability of Rough Surfaces
The wettability of a solid surface is partly controlled by its roughness, as indicated in reviews on the subject [36][37][9][38][39]. A theoretical model proposed by Wenzel describes the contact angle * on a wetted solid surface with a roughness parameter Sdr [40]:
cos 𝜃∗= 𝑆
ACCEPTED MANUSCRIPT
6 , where is the contact angle on a flat homogeneous surface of a solid with same composition. As
Sdr is always positive, the surface roughness increases hydrophobicity and hydrophilicity of
hydrophobic and hydrophilic surfaces, respectively, by increasing the liquid-solid contact area [31]. Apparent contact angles for full liquid intrusion into the pattern cavities are calculated using the Wenzel model:
𝑐𝑜𝑠𝜃∗ = 1 + ɸ𝑆(𝑐𝑜𝑠𝜃 − 1) (Eq.9)
In opposite, the Cassie-Baxter model describes the wetting of rough surfaces with entrapped air below the drop, i.e. unwetted valeys [41]. The Cassie-to-Wenzel wetting transition has been observed by enforcing the liquid into the solid asperities [42]. The Cassie-Baxter equation estimates the apparent contact angle * of a wetting liquid on a composite air-solid surface
composed by a fraction f1 and f2 of contact surface (f1+f2=1) with contact angles of 1 and 2,
respectively [41]:
cos 𝜃∗= 𝑓1 cos𝜃1+ 𝑓2 cos𝜃2 (Eq.10)
Implementing into Eq.10 the solid fraction area ɸ𝑆 and air trapped fraction 1 − ɸ𝑆 underneath
the droplet, and the contact angles on a flat homogeneous solid surface and on air [43], the Cassie-Baxter equation is modified as:
𝑐𝑜𝑠𝜃∗ = −1 + ɸ
𝑆(𝑐𝑜𝑠𝜃 + 1) (Eq.11)
The Wenzel-to-Cassie-Baxter transition is related in part to topographic limits for a liquid to penetrate into the asperities.
3. EXPERIMENTAL METHODS 3.1. Material
Samples were prepared from aluminum alloy 6063 plate (AlMg0.7Si) with dimensions of 50 x 50 x 0.7 mm3. All samples were polished prior to the nano-peening treatment to obtain smooth surfaces with a hydrophobic property. The as-polished sample is referred to as S0. Various
ACCEPTED MANUSCRIPT
7 peening parameters were used to obtain 15 different nano-peened surfaces. Surfaces can be classified according to Table 1.
Table 1: process parameters for peening process.
Sample Al plate preparation Peening Pressure Shot Material Shot Surface
Finishing Shot Size
S0 polished - - - - SA-1 polished Low ceramic SF1 Small SA-2 polished Medium ceramic SF1 Small SA-3 polished High ceramic SF1 Small SB-1 polished Low ceramic SF2 Large SB-2 polished Medium ceramic SF2 Large SB-3 polished High ceramic SF2 Large SC-1 Not polished Low metallic SF1 Small SC-2 Not polished Medium metallic SF1 Small SC-3 Not polished High metallic SF1 Small SD-1 polished Low metallic SF1 Small SD-2 polished Medium metallic SF1 Small SD-3 polished High metallic SF1 Small SE-1 polished Low metallic SF2 Medium SE-2 polished Medium metallic SF2 Medium SE-3 polished High metallic SF2 Medium
3.2. Electronic Microscopy Observation Procedure
Observation of surfaces was performed using the JEOL 7001F LV microscope equipped with SEM and EDS. Observations (SEM) and composition analysis (EDS) were performed in 2·10-3 Pa vacuum at 15.0 kV accelerating voltage and 10.0 mm working distance
3.3. Roughness Measurement Procedure
A three-dimensional analysis was undertaken to assess the surface roughness induced by nano-peening. A white light interferometer, WYKO 3300 NT (WLI), sampled a representative surface
ACCEPTED MANUSCRIPT
8 topography area of 640x480 points with the same step scale of 1.94 µm in the -x and -y directions (the surface size is therefore 1.2 mm x 0.93 mm). The form component is removed from the acquired 3D data using least square method based on a cubic spline function [44]. In addition, AFM measurements were performed over a 100 x 100 µm² surface with a 512x512 points resolution.
3.4. Wettability Testing Procedure
Contact angles were measured in the Morphoscan apparatus from Michalex Tribometrix using the sessile drop method according to the norm AFNOR EN 828 [35]. Three surface cleaning conditions performed just prior to the measurements were investigated: cleaning with ethanol only (C1), ultrasonic cleaning in ethanol followed by air blow drying (C2), and ultrasonic cleaning in ethanol followed by air blow drying after ageing 6 months in ambient air (C3). Drops were deposited in an environment of 22 ± 1 °C temperature and 54 ± 2 % relative humidity.
Two liquids, deionized water and glycerol, were used with characteristics given in Table 2. Inside a temperature-controlled chamber, a CCD video camera imaged deposited sessile drops on the solid surface using a syringe of inside diameter of 4.6 mm equipped with a needle of 0.8 mm outside diameter were used to control the amount of liquid deposited on the surface. 6 µL droplets were deposited on nano-peened surfaces. The capillary length K (Table 1) is given by [40]:
𝐾 = √𝜌𝑔𝛾 (12)
, where is liquid superficial tension, liquid density, g gravitational acceleration. The droplets had radii of 1.5 ± 0.5 mm, smaller than the capillary length (Table 2), so that gravity can be considered negligible.
The static droplet shape on sample’s surface was recorded ten seconds after the drop deposition as a 720x480 pixels image. Advancing contact angles were measured to an accuracy of ±0.5° using a home-developed program (Figure 1). Ten droplets of each liquid were deposited at different
ACCEPTED MANUSCRIPT
9 locations on the surface of each sample to obtain a mean value of the contact angles. Left and right angles were used to determine the reported surface energy.
Figure 1: photograph of drop with superimposed profile used for contact angle calculation
Table 2: surface tensions of liquids used [35].
Liquid Superficial Tension
mN·m-1 Dispersed Component D mN·m-1 Polar Component P mN·m-1 Density (kg/m3) Capillary Length (m) deionised water 72.80 21.80 51.00 1000 0.0027 glycerol 63.40 37.00 26.40 1260 0.0023
3.5. Multi scale surface roughness characterization of peened surfaces
The multi-scale characterization of engineering surfaces describes the surface features and irregularities at various wavelengths that compose the surface. The surface roughness profiles were split into frequency components from 10-3 to 1 mm-1 using the continuous wavelets decomposition approach [45]. This decomposition can be considered as a mathematical microscope, where the resolutions are the basic functions obtained from a single wavelet or mother wavelet ψ(x) by dilation (or compression) and translation. The result of the
ACCEPTED MANUSCRIPT
10 decomposition makes it possible to identify the various scales of the topographic signal after a 2D inverse wavelet transformation. The characterization methodology consists then of determining the developed interfacial area ratio parameter Sdr derived from ISO25178 standard at each
individual scale from the scales of waviness to roughness [46]. Then, a multiscale spectrum MSdr
of the topographic profile is obtained.
4. RESULTS
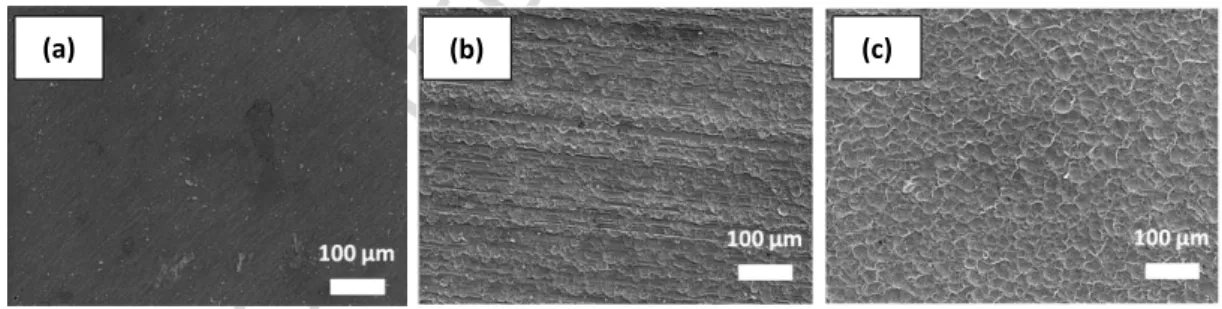
4.1. SEM Observation
Surfaces of 800 x 600 µm were imaged by SEM for each sample. The initial surface S0 is smooth from the previous polishing treatment. Figure 2 shows the surface structure of AA6063 after nano-peening using various peening pressures. Low-pressure peened specimens (i.e. indexed “1”) showed residual scratches generated by the polishing process prior to peening. On the opposite,
High-pressure peened specimens indexed “3” strongly modified the surfaces with deep grooves
and imprints of the peening balls. A greater nanopeening pressure yields to more craters on the treated surface. AFM imaging of surface topographies are summarized in the Appendix.
Figure 2: SEM observation of surface (a) prior peening (S0) and nano-peened with (b) low (SB-1) and (c) high (SB-3)
pressures
4.2. Surface roughness
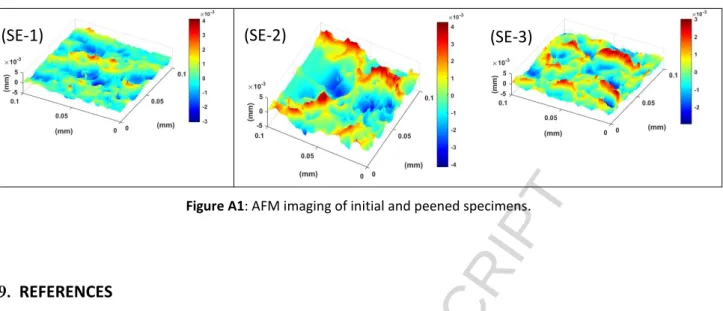
The surface roughness measurements performed by AFM are detailed in Table 3. The reconstructed surfaces from the AFM data are shown in Appendix (Figure A1). The roughness
ACCEPTED MANUSCRIPT
11 parameter Sa which is defined as the average roughness evaluated over the complete 3D
measured surface, is significantly increased by the nano-peening treatment. The initial S0 had very low Sa roughness (0.02 µm) in agreement with an as-polished sample. The peening process
increased the Sa roughness values from 0.020 up to 0.874 µm with greater values for samples
peened with the highest pressure High, in agreement with the more deformed surfaces imaged by SEM (recall Figure 1). However, Sa values decrease at greater peening pressures for the SE
specimens. The possible lowering of the roughness at excessive peening has been observed previously on other superficial deforming processes [1][32]. Such trend may be justified by the fact that the first shots impact the target when its surface is entirely smooth. As a consequence local changes cause important roughness increase, while changes induced by further nano-peening would not be evident as those resulting from the first collisions.
In case of skewness and kurtosis parameters, it is observed that both parameters are more or less independent of peening pressures. Most Ssk values are positive, in agreement with the residual
spherical imprints of the shots, except for SB-1 and SB-2 possibly due to piling-up of the superficial material during shot impact. Finally most of the nano-peened substrates present a Gaussian distribution of peaks and valleys (Sku≈3) except SA-2 with a Sku value near 13.8 because of several
high peaks of residual materials.
The parameter Sdr indicated the percentage of additional surface area provided by the texture
over a perfectly flat and smooth surface of a same cross-section. The combination of different texture amplitudes and spacings comprising the texture influences the additional surface area provided by the texture. Nano-peened surfaces offer from 4 to 21% additional surface area than the corresponding base material S0. Increasing the shot pressure from Low to High increases the surface roughness parameters even though the reason for the high Sdr value for SC-1 at Low
peening pressure remains unclear. An increase in surface area of hydrophilic materials may enhance the degree of surface wetting by fluids [40].
ACCEPTED MANUSCRIPT
12
Table 3: 3D roughness parameters
Specimen S0 SA-1 SA-2 SA-3 SB-1 SB-2 SB-3 SC-1 SC-2 SC-3 SD-1 SD-2 SD-3 SE-1 SE-2 SE-3
Sa (µm) 0.020 0.366 0.623 0.679 0.579 0.848 0.94 0.459 0.538 0.664 0.389 0.509 0.64 0.6 0.874 0.713 Sq (µm) 0.0277 0.454 0.857 0.871 0.779 1.1 1.18 0.588 0.675 0.843 0.484 0.631 0.809 0.774 1.17 0.908 Ssk -0.951 0.266 1.79 0.48 -0.347 -0.0352 0.529 0.441 0.427 0.289 0.144 0.0879 0.614 0.242 0.494 0.456 Sku 8.17 3.03 13.8 3.49 5.03 3.35 3.51 3.47 3.19 3.45 2.79 2.75 3.37 3.57 4.09 3.21 Sdr 0.0026 0.0449 0.0966 0.0742 0.0777 0.1018 0.1482 0.1331 0.0775 0.1158 0.05 0.1035 0.1541 0.1534 0.2057 0.2171 4.3. Surface energy
Surface energy was investigated for the three cleaning conditions C1 to C3. Contact angles measured by the sessile drop method are shown in Figure 3. Contact angles had a standard deviation of ± 3° over 20 measurements. Angles are modified with cleaning method, ageing, and peening conditions. The calculated surface tensions (according to Eq. 7) of the S0 reference sample were 21.9, 32.5 and 55.4 mN·m-1 for the cleaning conditions C1, C2, and C3, respectively. The ultrasonic cleaning in C2 may have eliminated some dirt entrapped in asperities and left on surfaces after C1 cleaning. The ageing effect may reflect the growth of the oxide layer that alters the aluminum surfaces.
The nano-peening process slightly enhanced the surface wettability as indicated by the little increase of apparent solid surface energy in all treated specimens for C2 cleaning condition. The hydrophilic property of the initial surface S0 with a water contact angle of 71 ° is thus improved by the nano-peening treatment.
ACCEPTED MANUSCRIPT
13
Figure 3: Solid surface energies calculated from contact angles measured by sessile drop method
The effect of cleaning is observable on our samples. Only rinsing with acetone does not clean sufficiently, in agreement with other works [47][48]. The drop of the contact angles when cleaning in ultrasonic baths suggest that residual impurities such as lubricant and dust require ultrasonic energy to detach from the valleys in which they are entrapped. Indeed, hydrophobic property results from the absence of any permanent or induced electrical dipole of the molecule and lack of ability to form hydrogen bonds [9] suggesting that lubricants remained trapped into the surface micro-valleys without ultrasonic baths. The largest increase in apparent surface energy was for SB-2, SE-1, SE-2, and SE-3 samples that had the highest roughness (recall table 3) and thus the highest ability for lubricant entrapment.
Ageing had an influence on the physical properties of its surface. It may possibly be due to the humidity adsorption and the oxide layer thickening. The effect on ageing is ambiguous with either improvement or deterioration of the wettability depending on the surface manufacturing history
ACCEPTED MANUSCRIPT
14 and the deposited liquid. The overall trend is a drop in the dispersive component of the surface tension. For aged specimens we were possibly measuring the spreading ability on aluminum oxide rather than bare aluminum metal.
The last parameter influencing the wettability of peened surface is the peening process parameters themselves. The surface peening induced an average variation of 15° for the contact angles. Calculations of air trapped fraction under the drops (Table 4) revealed that the Cassie-Baxter wetting state is predominant leading up to 32% of air beneath the drops. Note that the negative value for glycerol on B2 suggests that the wetting mode is better modeled by a Wenzel state. Nano-peening process parameters can therefore be chosen to maximize the air trapped fraction and subsequently optimize the self-cleaning and AF functionalities.
Table 4: Air trapped fraction 1 − ɸ𝑆 calculated from Eq. 11 for deionised water and glycerol drops
Specimen S0 SA-1 SA-2 SA-3 SB-1 SB-2 SB-3 SC-1 SC-2 SC-3 SD-1 SD-2 SD-3 SE-1 SE-2 SE-3
deionised
water 0.00 0.18 0.23 0.34 0.39 0.30 0.17 0.13 0.20 0.15 0.31 0.31 0.30 0.24 0.27 0.32 Glycerol 0.00 0.03 0.23 0.11 0.19 -0.03 0.09 0.21 0.27 0.28 0.30 0.13 0.05 0.19 0.10 0.15
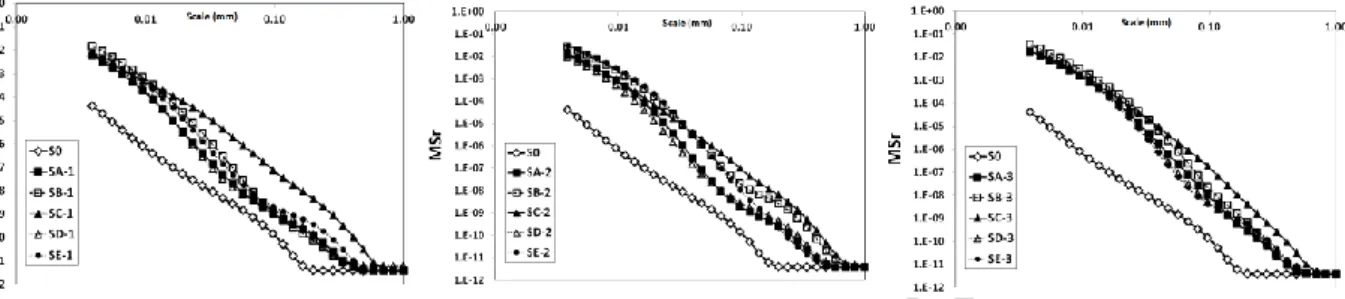
4.4. Multi-scale characterization
The multiscale spectrum MSdr were determined for the initial (S0) and all peened surfaces (SA, SB, SC, SD and SE). Figure 4 shows the Log-Log plot of these MSdr spectrums for the three considered
peening pressures Low, Medium, and High. For all the peening process parameters investigated,
MSdr curves exhibited practically a linear behavior under a scale limit of 400 µm. For the initial
smooth polished surface S0, this linear behavior occupies lower scale range. The scale limit was lower and did not exceed 170 µm. In fact, the nano-peening process induced a practically uniform vertical shift of the initial MSdr spectrum which indicated a roughness generation after peening
ACCEPTED MANUSCRIPT
15 process. It can be remarked also, in particular for the low peening pressure, that SC peened surfaces were the most shifted ones.
Figure 4: Multiscale spectrum of surface developed area function of analyzing scale for the three peening pressures.
The linear relation between the multiscale parameter and the analysis scale was representative of a fractal surface where the slope of the MSdr was a scale-independent parameter. The gap between the final slope and initial one was therefore a pertinent parameter to analyze the multiscale impact of the peening process.
Figure 5 shows a small variation of the MSdr spectrum for samples SC in opposite to all the others samples. This highlights that, for SC surfaces, all the scales in the 5 to 400 µm range are impacted by the peening process with the same manner. Furthermore, SA-1 and SB-2 peened surfaces with peening pressures Low and Medium, respectively, exhibited the less scale-dependent modifications.
ACCEPTED MANUSCRIPT
16
Figure 5: Gap of the MSdr spectrum slope for different peening process configurations
5. DISCUSSION
The aim of the present work was to investigate how variations in nano-peening process parameters and cleaning conditions may affect the wettability of AA6063 substrates. The present experimental results combined with literature data should promote a better understanding of the underlying wetting mechanisms associated with nano-peened surfaces.
Correlations between the peening process parameters and the wetting behavior of textured surfaces have been established. The enhancement of hydrophilicity by plastic deformation under ball impacts on metallic surfaces was observed in other works [1] [29][30] [31]. The nano-peening process slightly enhances the surface wettability of AA6063 alloy as indicated by the increase in solid surface energy, suggesting a preferential Wenzel mode of wetting.
The droplet contact angle on a rough surface is given by considering the ratio between the actual solid surfaces over its projection on a relatively flat surface (Sdr). The roughness ratio (Sdr) of a
rough surface is always greater than 1, since the pairs of peak and valley in nano-peened surface enlarges the surface area. The apparent contact angle of water on nano-peened samples
ACCEPTED MANUSCRIPT
17 decreased from 74.1° (flat surface) down to 62.2° for peened surfaces with specific peening parameters. As the surface of AA6063 prior to nano-peening is classified as hydrophilic, the apparent droplet contact angles from nanopeening fall into lower values than that prior to treatment, in agreement with macro-peening works [1] [31]. The reduction of the contact angle correlated inversely to the surface roughness. Nano-peening enhanced only slightly the wetting capability of AA6063 without achieving highly hydrophilic properties. Nevertheless the paper reveals the possibility of nano-peening to be used for modifying the wetting properties optimizing them by precise control of nano-peening process parameters.
Multi-scale approaches demonstrated the significant effect on the wetting properties of the surface texturing scale, apparently near 10-1 and 10-2 mm wavelengths. The results suggest that the surface textures improve the liquid attractivity by the substrates, possibly inherent to a preferential Wenzel than Cassie-Baxter wetting mode with creation of capillary forces. The textures are two-scale morphologies as indicated by the multi-scale analyses. When introducing cleaning parameters into the system, it is evident that ultrasonic is required to eliminate dirt present in the depth of the valleys. Moreover, ageing has a pronounced effect on both water and glycerol wettability, suggesting that the thickening of the oxide layer affects the overall wetting behavior of the peened surfaces.
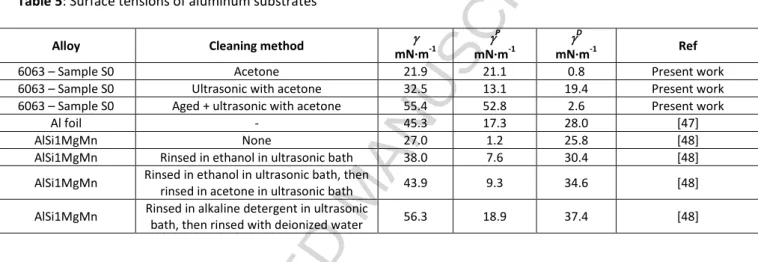
Regarding the ageing and cleaning effects, the sessile drop method has been successful in highlighting the importance of the surface conditioning history. Our present surface energy measurements are compared to the data from other works (Table 4). Our results agree with the observed increase in surface tension when ultrasonic cleaning and ageing the aluminum samples. The contact angle of a water droplet on aluminum has been observed to increase from 34±3 degrees in the non-oxidized state up to 55±5 degrees for oxidized aluminum surfaces after weeks of exposure to ambient air, but the trend was inverted with a drop in contact angle with time for nano-peened specimens. The aluminum oxide layer thickness and the adsorbed water have an effect on the sample wettability in agreement with other works (Table 5). It has been shown that the degree plastic deformation induced by nano-peening at the surface influences the thickness of
ACCEPTED MANUSCRIPT
18 the oxide film on steels [49]. A similar phenomenon may possibly be at the origin of the difference in ageing behavior between the as-polished S0 surface and the nano-peened surfaces, with a smoothing of the peening-induced irregular geometry by thickening of the oxide layer. The observed drop in contact angle with ageing time for peened AA6063 is in agreement with the wettability behavior observed on other peened metals [31]. Therefore, from static droplet shape measurements, it may be suggested that the initial contact angle on freshly peened surfaces is mainly controlled by the surface geometry while the change in contact angle with ageing is dependent upon the type and thickness of the oxide film formed on the peened surfaces.
Table 5: Surface tensions of aluminum substrates
Alloy Cleaning method
mN·m-1 P mN·m-1 D mN·m-1 Ref
6063 – Sample S0 Acetone 21.9 21.1 0.8 Present work
6063 – Sample S0 Ultrasonic with acetone 32.5 13.1 19.4 Present work 6063 – Sample S0 Aged + ultrasonic with acetone 55.4 52.8 2.6 Present work
Al foil - 45.3 17.3 28.0 [47]
AlSi1MgMn None 27.0 1.2 25.8 [48]
AlSi1MgMn Rinsed in ethanol in ultrasonic bath 38.0 7.6 30.4 [48] AlSi1MgMn Rinsed in ethanol in ultrasonic bath, then
rinsed in acetone in ultrasonic bath 43.9 9.3 34.6 [48] AlSi1MgMn Rinsed in alkaline detergent in ultrasonic
bath, then rinsed with deionized water 56.3 18.9 37.4 [48]
The roughness effect on wettability is ambiguous depending on the wetting state, i.e. Wenzel or Cassie-Baxter. If the reference material is the polished substrate S0, the Wenzel state will be revealed by an increase in wettability while the Cassie-Baxter state will be observed by a reduced wettability induced by entrapped air below the liquid drop [9]. Literature has shown that the SMAT (Surface Mechanical Attrition Treatment) process improved wettability for stainless steel surfaces [1]. Nevertheless our results showed that this is not always the case. The unaged samples mostly revealed a Wenzel wetting behavior except for B2 wetted by glycerol. On the contrary the aged specimens mainly showed a Cassie-Baxter behavior, possibly induced by a heterogeneous growth of Al2O3 oxide layer. Even though the kinetics growth are smaller than 0.1 nm·min-1 at 373 K [50][51], the amorphous oxide film attains after several months a limiting uniform thickness of a few nm [52] which may contain nanopores [53][54]. This air-oxide
bi-ACCEPTED MANUSCRIPT
19 compound layer may be the reason for a change from Wenzel to Cassie-Baxter behavior after ageing. The wettability is therefore modified by a two-level topography with micro- and nano-sized asperities [9]. Indeed, air trapping under a liquid occurs for a valley depth a and roughness period [40]:
𝜆 < 2𝜋𝑎 tan (𝜃𝐸)
, where 𝜃𝐸 is the contact angle of the liquid on a perfectly flat surface. Considering 𝜃𝐸 = 55°
(recall Fig 4) and 𝑎 = 𝑆𝑎 = 0.5 µ𝑚 (recall Table 3), the wavelength of the roughness must be smaller than 2.2 µm. Since the shots diameters are approximately 5 µm and the nano-porosity on an aluminum oxide film of 10-2-10-1 µm [53][54], this may possibly explain why the Cassie-Baxter wetting state is not observed on freshly peened but rather on aged peened substrates. The design of the peened surfaces should aim at obtaining the non-wetting behaviors of hierarchical textures [21]. The roughness of the peened surface must prevent the spreading of the liquid drops. A gradient of texture such as hierarchical structures [55][8] is therefore desirable for non-wetting properties such as self-cleaning and AF properties.
Overall the effectiveness of shot peening on controlling wettability and achieving self-cleaning and AF properties is interesting. Efficient processes are today already used for providing self-cleaning properties to substrates as indicated in reviews on the subject [21]. Coatings such as Cu(CH3(CH2)14COO) 2 are applicable on many substrates but have limited lifetime because there
are sensitive to wear and scratch issues. Multiscale topographies can also be manufactured by FIB and are very efficient in anti-fingerprint functionalities but are costly to manufacture and limited to small surfaces. Even though it is less efficient than coatings and FIB manufacturing, nanopeening processes have been proven through this work to enable the wettability of surfaces by modifying the superficial topographic signature. Advantages of using nano-peening include its resistant to scratches (if selected the appropriate substrate), the improving AF characteristics with ageing, and the ability to manufacture surfaces at very large scales. Future work will be focusing on optimizing the nanopeening process specifically for AF and self-cleaning applications.
ACCEPTED MANUSCRIPT
20
6. CONCLUSION
This study focused on the effect of the nano-peening-induced surface textures on their functionality. The impacts of nano-peening balls create craters which consequently enhance the roughness of the steel surface. The generated roughness is process parameter-dependent. First, the cleanliness of aluminum substrates for obtaining reliable wettability measurements was proven to require ultrasonic baths for eliminating dust and lubricants entrapped in the superficial micro-valleys. Once properly cleaned, changing the peening process parameters modify the superficial texture leading to a variation up to 15 degrees in the wettability angles. Nano-peening slightly enhances the wetting capability on AA6063 and yields to a texture with more hydrophilic property.
Ageing was also proven to influence greatly the wetting properties of nano-peened surfaces. The thickening of a porous oxide layer may possibly have modified the multiscale texture of the nano-peened surfaces. Besides, depending on the shot material and pressure, a variety of surface texture was generated with a multiscale-type of roughness. The texture aspect ratio of the nano-peened surface was varied with different gradient of the roughness profile leading to a multiscale observable change in surface energy and contact angle. Future work will focus on determining the peening process parameters and ageing conditions to achieve functional textures.
7. ACKNOWLEDGEMENTS
The authors acknowledge the help of our colleagues at Arts et Métiers ParisTech. Thanks are due to F. Guittoneau for his technical support on SEM observations.
ACCEPTED MANUSCRIPT
21 (SA-1) (S0) (SA-2) (SB-2) (SB-1) (SB-3) (SA-3) (SC-1) (SC-2) (SD-1) (SD-2) (SD-3) (SC-3)ACCEPTED MANUSCRIPT
22
Figure A1: AFM imaging of initial and peened specimens.
9. REFERENCES
[1] B. Arifvianto, M. Mahardika, P. Dewo, P.T. Iswanto, U.A. Salim, Effect of surface mechanical attrition treatment ( SMAT ) on microhardness , surface roughness and wettability of AISI 316L, Mater. Chem. Phys. 125 (2011) 418–426. doi:10.1016/j.matchemphys.2010.10.038. [2] A. Siriviriyanun, T. Imae, Anti-fingerprint properties of non-fluorinated organosiloxane
self-assembled monolayer-coated glass surfaces, Chem. Eng. J. 246 (2014) 254–259. doi:10.1016/j.cej.2014.02.066.
[3] H. Zhou, H. Wang, H. Niu, A. Gestos, T. Lin, Robust, self-healing superamphiphobic fabrics prepared by two-step coating of fluoro-containing polymer, fluoroalkyl silane, and modified silica nanoparticles, Adv. Funct. Mater. 23 (2013) 1664–1670. doi:10.1002/adfm.201202030.
[4] P. Muthiah, B. Bhushan, K. Yun, H. Kondo, Dual-layered-coated mechanically-durable superomniphobic surfaces with anti-smudge properties, J. Colloid Interface Sci. 409 (2013) 227–236. doi:10.1016/j.jcis.2013.07.032.
[5] S. Srinivasan, S.S. Chhatre, J.M. Mabry, R.E. Cohen, G.H. McKinley, Solution spraying of poly(methyl methacrylate) blends to fabricate microtextured, superoleophobic surfaces, Polymer (Guildf). 52 (2011) 3209–3218. doi:10.1016/j.polymer.2011.05.008.
[6] A. Tuteja, W. Choi, J.M. Mabry, G.H. McKinley, R.E. Cohen, Robust omniphobic surfaces, (SE-1) (SE-2) (SE-3)
ACCEPTED MANUSCRIPT
23 Proc. Natl. Acad. Sci. 105 (2008) 18200–18205. doi:10.1073/pnas.0804872105.
[7] P.S. Brown, B. Bhushan, Designing bioinspired superoleophobic surfaces, APL Mater. 4 (2016). doi:10.1063/1.4935126.
[8] S. Peng, B. Bhushan, Mechanically durable superoleophobic aluminum surfaces with microstep and nanoreticula hierarchical structure for self-cleaning and anti-smudge properties, J. Colloid Interface Sci. 461 (2016) 273–284. doi:10.1016/j.jcis.2015.09.027. [9] J. Drelich, E. Chibowski, D.D. Meng, K. Terpilowski, Hydrophilic and superhydrophilic
surfaces and materials, Soft Matter. 7 (2011) 9804. doi:10.1039/c1sm05849e.
[10] M. Morra, E. Occhiello, F. Garbassi, Contact Angle Hysteresis on Oxygen Plasma Treated Polypropylene Surfaces, 132 (1989).
[11] T. Onda, S. Shibuichi, N. Satoh, K. Tsuji, Super-Water-Repellent Fractal Surfaces, Lagmuir. 12 (1996) 2125–2127. doi:10.1021/la950418o.
[12] G. Yamauchi, K. Takai, H. Takazawa, Wetting characteristics of newly developed water-repellent material, Colloid Surfaces A. 116 (1996) 125–134.
[13] K. Tsujii, T. Yamamoto, S. Onda, T.Shibuichi, Super Oil-Repellent Surfaces**, Chem. Int. Ed. Engl. 36 (1997) 1011–1012.
[14] A. Hozumi, O. Takai, Preparation of ultra water-repellent films by microwave, Thin Solid Films. 303 (1997) 222–225.
[15] S. Shibuichi, T. Yamamoto, T. Onda, K. Tsujii, Super Water- and Oil-Repellent Surfaces Resulting from Fractal Structure, J. Colloid Interface Sci. 208 (1998) 287–294.
[16] A. Hozumi, O. Takai, Preparation of silicon oxide films having a water-repellent layer by multiple-step microwave plasma-enhanced chemical vapor deposition, Thin Solid Films. 334 (1998) 54–59.
[17] W. Chen, A.Y. Fadeev, M.C. Hsieh, O. Didem, J. Youngblood, T.J. Mccarthy, Ultrahydrophobic and Ultralyophobic Surfaces : Some Comments and Examples, Langmuir. 15 (1999) 3395–
ACCEPTED MANUSCRIPT
24 3399. doi:10.1021/la990074s.
[18] B.A. Nakajima, A. Fujishima, K. Hashimoto, T. Watanabe, Preparation of Transparent Superhydrophobic Boehmite and Silica Films by Sublimation of Aluminum Acetylacetonate **, Adv. Mater. (1999) 1365–1368.
[19] J.P. Youngblood, T.J. Mccarthy, Ultrahydrophobic Polymer Surfaces Prepared by Simultaneous Ablation of Polypropylene and Sputtering of Poly ( tetrafluoroethylene ) Using Radio Frequency Plasma, Macromolecules. 32 (1999) 6800–6806. doi:10.1021/ma9903456. [20] M. Belhadjamor, S. Belghith, S. Mezlini, M. El Mansori, Effect of the surface texturing scale
on the self-clean function: Correlation between mechanical response and wetting behavior, Tribol. Int. 111 (2017) 91–99. doi:10.1016/j.triboint.2017.03.005.
[21] M. Belhadjamor, M. El Mansori, S. Belghith, S. Mezlini, Anti-fingerprint properties of engineering surfaces : a review, Surf. Eng. 34 (2018) 85–120. doi:10.1080/02670844.2016.1258449.
[22] M. Zhang, S. Feng, L. Wang, Y. Zheng, Lotus effect in wetting and self-cleaning, Biotribology. 5 (2016) 31–43. doi:10.1016/j.biotri.2015.08.002.
[23] H. Wu, K. Zhu, B. Wu, J. Lou, Z. Zhang, G. Chai, Influence of structured sidewalls on the wetting states and superhydrophobic stability of surfaces with dual-scale roughness, Appl. Surf. Sci. 382 (2016) 111–120. doi:10.1016/j.apsusc.2016.04.101.
[24] K. Duvefelt, U. Olofsson, C.M. Johannesson, L. Skedung, Model for contact between finger and sinusoidal plane to evaluate adhesion and deformation component of friction, Tribol. Int. 96 (2016) 389–394. doi:10.1016/j.triboint.2014.12.020.
[25] L. Wojciechowski, K.J. Kubiak, T.G. Mathia, Roughness and wettability of surfaces in boundary lubricated scuffing wear, Tribol. Int. 93 (2016) 593–601. doi:10.1016/j.triboint.2015.04.013.
[26] R. Fagiani, M. Barbieri, A contact mechanics interpretation of the duplex theory of tactile texture perception, Tribol. Int. 101 (2016) 49–58. doi:10.1016/j.triboint.2016.03.031.
ACCEPTED MANUSCRIPT
25 [27] A.C. Rodríguez Urribarrí, E. van der Heide, X. Zeng, M.B. de Rooij, Modelling the static contact between a fingertip and a rigid wavy surface, Tribol. Int. 102 (2016) 114–124. doi:10.1016/j.triboint.2016.05.028.
[28] L.Y.L. Wu, S.K. Ngian, Z. Chen, D.T.T. Xuan, Quantitative test method for evaluation of anti-fingerprint property of coated surfaces, Appl. Surf. Sci. 257 (2011) 2965–2969. doi:10.1016/j.apsusc.2010.10.101.
[29] C.N. Elias, Y. Oshida, J.H.C. Lima, C.A. Muller, Relationship between surface properties (roughness, wettability and morphology) of titanium and dental implant removal torque, J. Mech. Behav. Biomed. Mater. 1 (2008) 234–242. doi:10.1016/j.jmbbm.2007.12.002.
[30] A. Piattelli, A. Scam, M. Piattelli, L. Calabrese, Direct bone formation on sand-blasted titanium implants : an experimental study, Biomaterials. 17 (1996) 1015–1018.
[31] Y. Oshida, R. Sachdeva, S. Miyazaki, J. Daly, Effects of shot-peening on surface contact angles of biomaterials, J. Mater. Sci. Mater. Med. 4 (1993) 443–447.
[32] S. Bagherifard, R. Ghelichi, M. Guagliano, Numerical and experimental analysis of surface roughness generated by shot peening, Appl. Surf. Sci. 258 (2012) 6831–6840. doi:10.1016/j.apsusc.2012.03.111.
[33] I. Egry, E. Ricci, R. Novakovic, S. Ozawa, Surface tension of liquid metals and alloys — Recent developments, Adv. Colloid Interface Sci. 159 (2010) 198–212. doi:10.1016/j.cis.2010.06.009.
[34] B. Le Neindre, Tensions superficielles et interfaciales, Tech. l’Ingénieur. k475 (1993) k475-1-k475-12.
[35] C.E. de Normalisation, Norme EN828 - Détermination par mesurage de l’angle de contact et de l’énergie superficielle libre de la surface solide, (2013).
[36] M. Callies, D. Que, D. Que, D. Que, On water repellency, Soft Matter. 1 (2005) 55–61. doi:10.1039/b501657f.
ACCEPTED MANUSCRIPT
26 [37] J. Bico, C. Marzolin, D. Quéré, Pearl drops, Eur. Lett. 47 (1999) 220–226.
[38] C. Huh, S.G. Mason, Effects of Surface Roughness on Wetting, J. Colloid Inter. 60 (1977) 11– 38.
[39] W. Barthlott, C. Neinhuis, H. Verlot, C.L. Schott, Purity of the sacred lotus , or escape from contamination in biological surfaces, Planta. 202 (1997) 1–8.
[40] P.-G. de Gennes, F. Brochard-Wyart, D. Quéré, Capillarity and wetting phenomena, Springer, 2010.
[41] A.B.D. Cassie, S. Baxter, Wettability of porous surfaces, Trans. Faraday Soc.,. 40 (1944) 546– 551.
[42] E. Bormashenko, R. Pogreb, G. Whyman, Y. Bormashenko, M. Erlich, E. Bormashenko, R. Pogreb, G. Whyman, Y. Bormashenko, M. Erlich, Vibration-induced Cassie-Wenzel wetting transition on rough surfaces, Appl. Phys. Lett. 90 (2007) 201917. doi:10.1063/1.2738364. [43] M. Miwa, A. Nakajima, A. Fujishima, K. Hashimoto, Effects of the Surface Roughness on
Sliding Angles of Water Droplets on Superhydrophobic Surfaces, Langmuir. 16 (2000) 5754– 5760.
[44] S. Mezghani, H. Zahouani, Characterisation of the 3D waviness and roughness motifs, Wear. 257 (2004) 1250–1256. doi:10.1016/j.wear.2004.05.024.
[45] H. Zahouani, S. Mezghani, R. Vargiolu, M. Dursapt, Identification of manufacturing signature by 2D wavelet decomposition, Wear. 264 (2008) 480–485. doi:10.1016/j.wear.2006.08.047. [46] S. Mezghani, M. El Mansori, A. Massaq, P. Ghidossi, Correlation between surface
topography and tribological mechanisms of the belt-finishing process using multiscale finishing process signature, Comptes Rendus - Mec. 336 (2008) 794–799. doi:10.1016/j.crme.2008.09.002.
[47] R. Chris, Effect of Temperature on the Surface Energy of Solids, 2005.
ACCEPTED MANUSCRIPT
27 Substrates on Silicone Rubber Adhesion, J. Phys. D. 44 (2011) 34011.
[49] T. Nakayama, Y. Oshida, Effects of Surface by Wet Working on the Structures of Oxide Films by Wet Oxidation in Austenitic Stainless Steels, Trans JIM. 12 (1971) 214–217.
[50] J.S. Kim, H.A. Marzouk, P.J. Reucroft, J.D. Robertson, C.E. Hamrin Jr, Effect of water vapor on the growth of aluminum oxide films by low pressure chemical vapor deposition, Thin Solid Films. 230 (1993) 156–159. doi:10.1016/0040-6090(93)90509-N.
[51] K. Kukli, M. Ritala, M. Leskela, Atomic layer epitaxy growth of aluminum oxide thin films from a novel Al(CH3)2Cl precursor and H2O, J. Vac. Sci. Technol. A Vacuum, Surfaces, Film. 15 (1997) 2214. doi:10.1116/1.580536.
[52] L.P.H. Jeurgens, W.G. Sloof, F.D. Tichelaar, E.J. Mittemeijer, Growth kinetics and mechanisms of aluminum-oxide films formed by thermal oxidation of aluminum, J. Appl. Phys. 92 (2002) 1649–1656. doi:10.1063/1.1491591.
[53] F. Li, L. Zhang, R.M. Metzger, On the Growth of Highly Ordered Pores in Anodized Aluminum Oxide, Chem. Mater. 10 (1998) 2470–2480.
[54] X. Wang, G.-R. Han, F abrication and characterization of anodic aluminum oxide template, Microelectron. Eng. 66 (2003) 166–170. doi:10.1016/S0167-9317(03)00042-X.
[55] B. Bhushan, Y.C. Jung, K. Koch, Micro-, nano- and hierarchical structures for superhydrophobicity, self-cleaning and low adhesion, Philos. Trans. R. Soc. A Math. Phys. Eng. Sci. 367 (2009) 1631–1672. doi:10.1098/rsta.2009.0014.
ACCEPTED MANUSCRIPT
28
Research Highlights
1. Nano-peening process is usable to control the functionality of surfaces, such as self-cleaning and anti-fingerprint functions
2. Nano-peened surface energy is strongly dependent upon the process parameters used to generate these surfaces.
3. Nano-peening influences the ageing behavior of surfaces, and especially their wetting behavior after several months.
4. Mutli-scale approach identified two ranges of scale wavelengths that have been modified by nano-peening.