Science Arts & Métiers (SAM)
is an open access repository that collects the work of Arts et Métiers Institute of Technology researchers and makes it freely available over the web where possible.
This is an author-deposited version published in: https://sam.ensam.eu
Handle ID: .http://hdl.handle.net/10985/13675
To cite this version :
Meriem GHRIB, Nazih MECHBAL, Laurent BERTHE, Mikhail GUSKOV, Marc REBILLAT -LASER shock delamination generation and machine learning-based damage quantification in CFRP composites plates - In: 7th International Symposium on Aircraft Materials (ACMA2018), France, 2018-04 - 7th International Symposium on Aircraft Materials (ACMA2018) - 2018
Any correspondence concerning this service should be sent to the repository Administrator : archiveouverte@ensam.eu
LASER shock delamination generation and machine learning-based
damage quantification in CFRP composites plates
M. Ghrib1, M. Rebillat1, M. Guskov1, L. Berthe1 & N. Mechbal1
1PIMM laboratory, ENSAM-CNRS-CNAM, 151 Boulevard de l’Hopital, 75013 Paris, France.
nazih.mechbal@ensam.eu
Abstract
In the aeronautic industry, composite materials are becoming more widespread due to their high strength to mass ratio. Piezoelectric elements can be permanently incorporated on composite parts during the manufacturing process and can then be used to provide a diagnosis of their current health and the prognosis of their remaining operational life. This approach is called Structural Health Monitoring (SHM). In this work, we approach delamination quantification in Carbon Fiber Reinforced Polymer (CFRP) plates as a classification problem whereby each class corresponds to a certain damage extent. Starting from the assumption that damage causes a structure to exhibit nonlinear response, we investigate whether the use of Nonlinear Model Based Features (NMBF) increases classification performance. NMBF are computed based on parallel Hammerstein models which are identified with an Exponential Sine Sweep (ESS) signal. Delamination damage is introduced into samples in a calibrated and realistic way using LASER Shock Wave Technique (LSWT) and more particularly symmetrical LASER shock configuration. Obtained results demonstrate that the proposed approach is very reliable for delamination quantification.
1. Introduction
Structural Health Monitoring (SHM) combines advanced sensor technology with intelligent algorithms to interrogate the structural health condition of newly designed composite materials [1]. A SHM process aims at establishing: (1) the existence of damage, (2) its localization, (3) its type, and (4) its severity [2]. In this work, the focus is put on the quantification step of the SHM process, i.e. the assessment of damage severity. Delamination quantification problem is addressed here as a classification problem whereby each class corresponds to a certain damage severity. Based on the assumption that damage causes a structure to exhibit nonlinear response, it is expected that the damage quantification process can be significantly enhanced by taking advantage of these nonlinear effects [3]. The aim is thus here to exploit a richer nonlinear representation of our test structure [4, 5] and to investigate whether the use of nonlinear model based features allows for an enhanced damage quantification approach. A support Vector Machine (SVM) is used to perform multi-class classification task [6, 7]. Two types of features are used to feed the SVM algorithm: Signal Based Features (SBF) and Nonlinear Model Based Features (NMBF). SBF are rooted in a direct use of response signals and do not consider any underlying model of the monitored structure [8, 9]. NMBF are computed based on parallel Hammerstein models which are identified with an Exponential Sine Sweep (ESS) signal [4, 5]. Dimensionality reduction of features vector using Principal Component Analysis (PCA) is also conducted to find out if it allows to robustify the quantification process [8]. CFRP composite plates equipped with 5 piezoelectric elements and containing various delamination severities are considered for demonstration purposes. LASER Shock Wave Technique (LSWT) and more particularly symmetrical LASER shock configuration is used to introduce realistic and well calibrated delamination-type damage into test coupons [10, 11]. In the following, after the
M. Ghrib, M. Rebillat, M. Guskov, L. Berthe & N. Mechbal
presentation of laser shock wave technique and CFRP test coupons, the main key elements of the quantification workflow proposed in this paper are detailed. The experimental investigation conducted in this work is then described. Results and analysis are afterwards presented. Conclusions are finally provided.
2. Test Structures
2.1. LASER Shock Wave Technique
Test structures considered for demonstration consist of four CFRP composite plates equipped with 5 piezoelectric elements and containing various delamination severities. Damage is introduced into samples (see Figure 1 [Left]) in a calibrated way using LSWT and more particularly symmetrical laser shock configuration (see Figure 1 [Right]). LSWT is chosen as an alternative to conventional damage generation techniques such as conventional impacts and Teflon inserts since it allows for a better calibration of damage in type, depth, and size [10, 11]. Four CFRP test coupons are considered. The first one is kept in a healthy state. The second one was subjected to a symmetrical laser impact at 0 ns time delay and at 100 % of the maximum energy of the two laser beams. This resulted in approximately 7 mm diameter delamination which occurred at 1.1 mm depth. The third coupon was subjected to two symmetrical and contiguous laser impacts which resulted in 14 mm diameter delamination while the fourth coupon was impacted with three contiguous impacts which in turn resulted in approximately 21 mm diameter delamination.
Figure 1: [Left] Experimental set-up of symmetrical laser shock configuration. [Right] Cross-sectional observation showing a delamination generated using LSWT.
2.2. Composite plates under study
The dimensions of the composites plates are 300mm / 400mm / 2:2mm and they are made up of 16 plies with the following stacking sequence [0°/90°/0°/90°/0°/90°/0°/90°]s. Each ply is of 0,14 mm thickness and is made up of unidirectional carbon fibers lying within an epoxy matrix. The first plate, referenced as "healthy", is kept healthy. The second plate referenced "1 impact", has been impacted using symmetric LSWT and this results in a 7 mm delamination in the mid-thickness plate. The second plate referenced "1
impact", has been impacted twice using symmetric LSWT and this results in a 14 mm
impacted three times using symmetric LSWT and this results in a 21 mm delamination in the mid-thickness plate. The plates as well as their geometry are depicted in Figure 2.
Figure 2: [Left] The four composite plates under study. [Right] Geometrical details of the four specimens under study.
2.3. Data acquisition
Test coupons were excited using an exponential sine sweep signal with 1 kHz minimum frequency, 100 kHz maximum frequency, 0.45 s sweep duration and 10 V amplitude. Twenty repetitions were considered. At each repetition one goes around all PZT elements and only one PZT operates as an actuator while others operate as sensors. Sampling frequency was set to 1 MHz.
3. Damage quantification approach
Figure 3 illustrates the main key ingredients of the quantification workflow proposed in this work. An input signal is firstly selected to excite a test structure containing a given damage severity. The structure response signal is then recorded, and damage sensitive features are extracted. In this work, we investigate whether NMBF allow for an enhanced damage quantification strategy. Two types of features are thus considered: SBF and NMBF.
M. Ghrib, M. Rebillat, M. Guskov, L. Berthe & N. Mechbal
3.1. -based features (SBF)
Signal-based Features are rooted in a direct use of response signals and do not consider any underlying model of the test structure. Four signal-based features are considered in this study and are computed as follows. Let 𝑠𝑟𝑒𝑓(𝑡) and 𝑠𝑑(𝑡) be the structure output signal in reference and damaged state respectively, where t refers to time, one defines the signal-based features as in Table 1.
Table 1: Definition of the signal-based features (SBF)
Name Comments Definition
CC
FFT based implementation of the maximum of the correlation between the reference and damaged signals
1 − max (
𝐼𝐹𝐹𝑇[𝐹𝐹𝑇[𝑠𝑟𝑒𝑓(𝑡)] × 𝐹𝐹𝑇[𝑠𝑑(𝑡)]∗]
√(𝐸𝑠𝑟𝑒𝑓× 𝐸𝑠𝑑) )
NRE Normalized residual energy of the difference
between the reference and damaged signals ∫ (𝑠𝑟𝑒𝑓(𝑡) − 𝑠𝑑(𝑡))
2
𝑑𝑡
𝑇
0
MA Maximum amplitude of the difference between
the reference and damaged signals max[𝑠𝑟𝑒𝑓(𝑡) − 𝑠𝑑(𝑡)] ENV Maximum envelope of the difference between
the reference and damaged signals max[𝐸𝑁𝑉(𝑠𝑟𝑒𝑓(𝑡) − 𝑠𝑑(𝑡))]
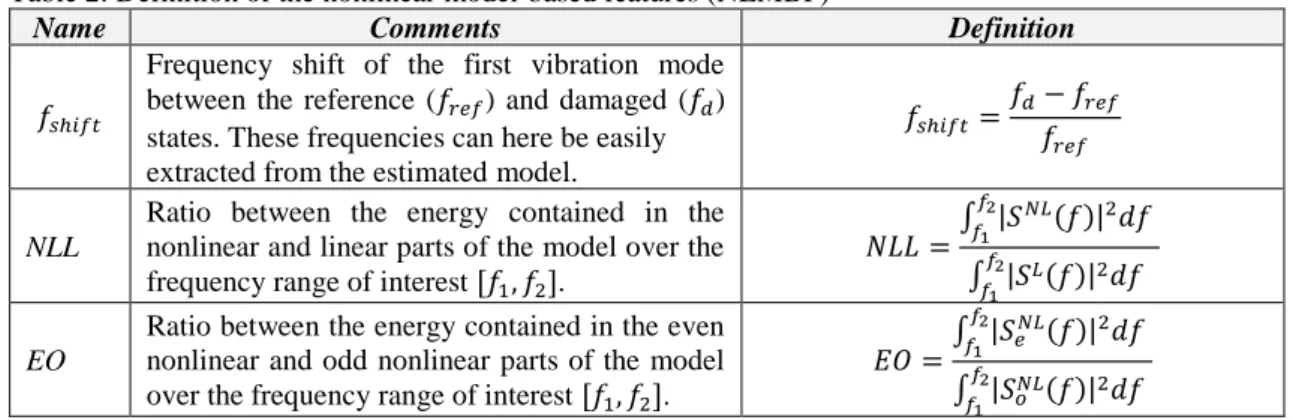
3.2. Nonlinear model-based features (NLMBF)
NMBF are considered based on previous work presented in [12, 13]. Parallel Hammerstein models identified by means of Exponential Sine Sweeps excitation signal are used to model the damaged structure [4, 5]. Once a nonlinear model of the structure has been identified, the system output 𝑠(𝑡) can be rewritten as follows:
𝑠(𝑡) = 𝑠𝐿(𝑡) + 𝑠𝑁𝐿(𝑡) = 𝑠𝐿(𝑡) + 𝑠
𝑜𝑁𝐿(𝑡) + 𝑠𝑒𝑁𝐿(𝑡) Eq. 1 Once a model has been estimated, the output signal can be decomposed into a linear part 𝑠𝐿(𝑡) and a nonlinear part 𝑠𝑁𝐿(𝑡) as in Eq. 1. The nonlinear part can then in turn be decomposed into odd harmonics contribution 𝑠𝑜𝑁𝐿(𝑡) and even harmonics contribution 𝑠𝑒𝑁𝐿(𝑡). Three nonlinear model-based features are then chosen and computed on this basis as detailed in Table 2.
Table 2: Definition of the nonlinear model-based features (NLMBF)
Name Comments Definition
𝑓𝑠ℎ𝑖𝑓𝑡
Frequency shift of the first vibration mode between the reference (𝑓𝑟𝑒𝑓) and damaged (𝑓𝑑)
states. These frequencies can here be easily extracted from the estimated model.
𝑓𝑠ℎ𝑖𝑓𝑡=
𝑓𝑑− 𝑓𝑟𝑒𝑓
𝑓𝑟𝑒𝑓
NLL
Ratio between the energy contained in the nonlinear and linear parts of the model over the frequency range of interest [𝑓1, 𝑓2].
𝑁𝐿𝐿 =∫ |𝑆 𝑁𝐿(𝑓)|2𝑑𝑓 𝑓2 𝑓1 ∫ |𝑆𝑓2 𝐿(𝑓)|2𝑑𝑓 𝑓1 EO
Ratio between the energy contained in the even nonlinear and odd nonlinear parts of the model over the frequency range of interest [𝑓1, 𝑓2].
𝐸𝑂 =∫ |𝑆𝑒 𝑁𝐿(𝑓)|2𝑑𝑓 𝑓2 𝑓1 ∫ |𝑆𝑜𝑁𝐿(𝑓)|2𝑑𝑓 𝑓2 𝑓1
3.3. Integration among the PZt network
The damage indexes defined in the previous sections are computed for each path “actuator 𝑖 to sensor 𝑗” where 𝑖 and 𝑗 denotes two of the 5 piezoelectric elements glued on the specimens. Let’s denote 𝐷𝐼𝑖𝑗 an arbitrary damage index computed for such a path. The damage indexes for all the paths are then integrated within a global damage index 𝐷𝐼𝐺 defined by Eq. 2. Machine learning algorithms are then applied to these global damage indexes. 𝐷𝐼𝐺 = ∑ ∑ 𝐷𝐼𝑖𝑗 𝑁𝑐𝑎𝑝𝑡 𝑗=1 𝑁𝑎𝑐𝑡 𝑖=1 Eq. 2 3.4. SVM and PCA
SVM learning technique is used for the classification step [6, 7]. When used for classification, SVMs separate a given set of binary labeled training data with a hyper-plane that is maximally distant from them (known as the maximal margin hyper-hyper-plane). For cases in which no linear separation is possible, they can work in combination with the technique of “kernels”, that automatically realizes a non-linear mapping to a feature space. The hyper-plane found by the SVM in the feature space corresponds to a non-linear decision boundary in the input space. To extend SVMs to multi-class scenario, a typical conventional way is to decompose a multi-class problem into a series of two-class problems. One can distinguish between two implementations: the “one against one” (OAO) and the “one against all” (OAA). OAO builds one SVM for each pair of classes while OAA consists of building one SVM per class, trained to distinguish the samples in a single class from the samples in all remaining classes. In this work, a Gaussian kernel SVM is considered. SVM and Kernel Methods (SVM-KM) Matlab toolbox [6] is used to perform multiclass classification.
Principal Component analysis (PCA) [8] is a popular tool for linear dimensionality reduction and feature extraction. Intuitively, PCA can supply the user with a lower-dimensional picture of data when viewed from its most informative viewpoint. In this work we opted for the standard PCA since our features vector is not very high-dimensional.
3.5. Input Features Scenarios
Several input features scenarios are considered according to which features to select to feed and train the SVM algorithm:
• Scenario 1: Only SBF are used to train the SVM algorithm
• Scenario 2: Only NMBF are used to train the SVM algorithm
• Scenario 3: Both SBF and NMBF are used to train the SVM algorithm
• Scenario 4: PCA is performed on both SBF and NMBF and only 2 principal
components are used to train the SVM algorithm
• Scenario 5: PCA is performed on both SBF and NMBF and only 3 principal
M. Ghrib, M. Rebillat, M. Guskov, L. Berthe & N. Mechbal 4. Results and analysis
4.1. From Output Signals to Input Features
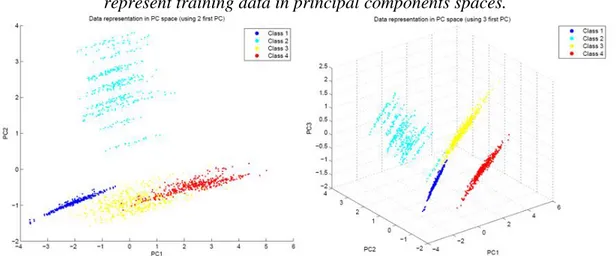
Once signals are acquired, we proceeded to information condensation, that is, to damage sensitive features computing. Each class of damage state (Class 1: healthy, Class 2: one laser impact, Class 3: two contiguous laser impacts and Class 4: three contiguous laser impacts) has 400 instances. Each instance is characterized by a total of seven features. Stratified sampling is considered; 70% of data is used for training the
SVM model and 30% of data is used for testing the model. In the following figures, we represent training data in principal components spaces.
Figure 4 clearly reveals a structure of four classes. Each corresponds to a state of damage severity, especially when 3 principal components are considered.
Figure 4: Data representation in principal components spaces
4.2. Classification Performance
Ten SVM models are established according to which approach is adopted (OAO or OAA) and to which scenario is being considered. Models performance on test data is then assessed. As illustrated in Figure 5, independently of which approach is used, SVM models trained on NMBF or on principal components perform better than those trained on SBF. This is clearly due to class overlapping introduced by SBF and which induces the classifiers into error and to the additional information provided by NLMBF.
Figure 5: Performance assessment of the considered SVM models on test data
5. Conclusion
In this work, we approach delamination quantification in Carbon Fiber Reinforced Polymer (CFRP) plates as a classification problem whereby each class corresponds to a certain damage extent. Starting from the assumption that damage causes a structure to exhibit nonlinear response, we investigate whether the use of Nonlinear Model Based Features (NMBF) increases classification performance. NMBF are computed based on parallel Hammerstein models which are identified with an Exponential Sine Sweep (ESS) signal. Delamination damage is introduced into samples in a calibrated and realistic way using LASER Shock Wave Technique (LSWT) and more particularly symmetrical LASER shock configuration. Obtained results demonstrate that the proposed approach is very reliable for delamination quantification.
6. References
[1] K. Worden, C. R. Farrar, G. Manson et G. Park, «The fundamental axioms of structural health monitoring,» Proceedings of the Royal Society of London A: Mathematical, Physical and Engineering Sciences, vol. 463, pp. 1639-1664, 2007.
[2] C. R. Farrar et K. Worden, «An introduction to structural health monitoring,» Philosophical Transactions of the Royal Society of London A: Mathematical, Physical and Engineering Sciences, vol. 365, pp. 303-315, 2007.
[3] C. R. Farrar, K. Worden, M. D. Todd, G. Park, J. Nichols, D. E. Adams, M. T. Bement et M. T. Farinholt, «Nonlinear system identification for damage detection,» 2007.
[4] M. Rébillat, R. Hennequin, É. Corteel et B. F. G. Katz, «Identification of cascade of Hammerstein models for the description of nonlinearities in vibrating devices,» Journal of Sound and Vibration, vol. 330, pp. 1018-1038, #feb# 2011.
[5] A. Novak, L. Simon, F. Kadlec et P. Lotton, «Nonlinear System Identification Using Exponential Swept-Sine Signal,» {IEEE} Transactions On Instrumentation and Measurement, vol. 59, pp. 2220-2229, #aug# 2010.
[6] S. Canu, Y. Grandvalet, V. Guigue et A. Rakotomamonjy, SVM and Kernel Methods Matlab Toolbox, 2005.
[7] N. Cristianini et J. Shawe-Taylor, An Introduction to Support Vector Machines: And Other Kernel-based Learning Methods, Cambridge University Press, 2000.
[8] R. Hajrya et N. Mechbal, «Principal component analysis and perturbation theory based robust damage detection of multifunctional aircraft structure,» Structural Health Monitoring - An International Journal, vol. 12, pp. 263-277, 2013.
M. Ghrib, M. Rebillat, M. Guskov, L. Berthe & N. Mechbal
[9] M. Rébillat, O. Hmad, F. Kadri et N. Mechbal, «Peaks Over Threshold–based detector design for structural health monitoring: Application to aerospace structures,» Structural Health Monitoring, vol. 0, p. 1475921716685039, 0.
[10] M. Ghrib, L. Berthe, M. REBILLAT, N. Mechbal, R. ECAULT et others, «Laser shock a novel way to generate calibrated delamination in composites: concept and first results,» 2015. [11] É. Gay, L. Berthe, M. Boustié, M. Arrigoni et M. Trombini, «Study of the response of CFRP
composite laminates to a laser-induced shock,» {Composites Part B: Engineering}, vol. 64, pp. 108-115, 2014.
[12] M. Bakir, M. Rébillat et N. Mechbal, «Damage type classification based on structures nonlinear dynamical signature,» chez 9th IFAC symposium on Fault Detection, Supervision and Safety of Technical Processes, Par, 2015.
[13] M. Rébillat, R. Hajrya et N. Mechbal, «Detection of structural damage using the exponential sine sweep method,» chez International Workshop on Structural Health Monitoring, 2013.
![Figure 1: [Left] Experimental set-up of symmetrical laser shock configuration. [Right] Cross- Cross-sectional observation showing a delamination generated using LSWT](https://thumb-eu.123doks.com/thumbv2/123doknet/7426869.219477/3.892.165.773.649.855/figure-experimental-symmetrical-configuration-sectional-observation-delamination-generated.webp)
![Figure 2: [Left] The four composite plates under study. [Right] Geometrical details of the four specimens under study](https://thumb-eu.123doks.com/thumbv2/123doknet/7426869.219477/4.892.136.759.219.492/figure-left-composite-plates-right-geometrical-details-specimens.webp)