HAL Id: tel-01784480
https://tel.archives-ouvertes.fr/tel-01784480
Submitted on 3 May 2018
HAL is a multi-disciplinary open access archive for the deposit and dissemination of sci-entific research documents, whether they are pub-lished or not. The documents may come from teaching and research institutions in France or abroad, or from public or private research centers.
L’archive ouverte pluridisciplinaire HAL, est destinée au dépôt et à la diffusion de documents scientifiques de niveau recherche, publiés ou non, émanant des établissements d’enseignement et de recherche français ou étrangers, des laboratoires publics ou privés.
To cite this version:
Mohamed Said Mosli Bouksiaa. Performance variation considered helpful. Distributed, Parallel, and Cluster Computing [cs.DC]. Université Paris-Saclay, 2018. English. �NNT : 2018SACLL001�. �tel-01784480�
variation considered helpful
Thèse de doctorat de l'Université Paris-Saclay
préparée à Télécom SudParis
Numéro National de Thèse (NNT) : 2018SACLL001
École doctorale n°580 Sciences et technologies de l'information et de
la communication (STIC)
Spécialité de doctorat: Informatique
Thèse présentée et soutenue à Évry, le 26 avril 2018, par
Mohamed Said Mosli Bouksiaa
Composition du Jury :M. Denis Conan
Maître de conférences, Télécom SudParis M. Philippe Clauss
Professeur, Université de Strasbourg Mme Vania Marangozova-Martin
Maître de conférences, Université de Grenoble Mme Isabelle Puaut
Professeur, Université de Rennes 1 M. Lionel Seinturier
Professeur, Université de Lille M. Gaël Thomas
Professeur, Télécom SudParis M. François Trahay
Maître de conférences, Télécom SudParis
Examinateur Rapporteur Rapporteur Examinatrice Président Directeur de thèse Examinateur
NNT: 2018SACLL001
1. INTRODUCTION 6
2. FROM ARCHITECTURES TO PERFORMANCE BOTTLENECKS 12
2.1. Architectural solutions 12
2.1.1 More cores 12
2.1.2 Cache memory 13
2.1.3 NUMA 14
2.2. Performance problems 15
2.2.1 Cache contention, false and true sharing 16
2.2.2 NUMA: contention and memory placement 17
2.2.3 I/O contention 19
2.2.4 Thread synchronization: contention on locks 21
2.3. Conclusion 22
3. PROFILING TOOLS FOR MULTI-THREAD APPLICATIONS 24
3.1. Why: cause-oriented, problem-specific tools 24
3.1.1 Cache-related problems 24
3.1.2 Detecting I/O contention 31
3.1.3 Detecting NUMA problems 33
3.1.4 Detecting lock contention 34
3.1.5 Conclusion 36
3.2. Where: generic, cause-oblivious tools 37
3.3. Another combination: Why and How much 39
3.4. Conclusion 39
4. RDAMANDRDAMCALCULATOR 41
4.1. The RDAM metric 41
4.1.1 Interference results in slowdown 41
4.1.2 Formal definition 42
4.1.3 Accuracy of the RDAM metric 43
4.1.4 Conclusion 44
4.2. The effect-oriented profiling tool 44
4.2.1 Selecting the locations of the probes 44
4.2.2 False positives 45
4.2.3 Automatic instrumentation of the application 46
4.2.4 Trace generation 46
4.2.5 RDAM score computation 48
4.2.6 Conclusion 49
5. EVALUATION 51
5.1. Micro-benchmark evaluations 51
5.1.1 Summary of the micro-benchmarks 51
5.1.2 Analysis of the micro-benchmarks 55
5.2. Applications evaluation 56
5.2.1 Evaluated applications 56
5.2.2 Identification of the hottest functions 58
5.2.3 Analysis of the potential false negatives 58
5.2.4 Instrumentation overhead 59
5.2.5 Analysis of the RDAM scores 59
5.2.6 Analysis of the false positives 63
5.2.7 Conclusion 64
6. CONCLUSION 66
6.1. Future work 66
Computers are increasingly spreading in various areas which affect our daily life. Processing units are being embedded in devices that we use very frequently such as phones and other smart objects that will be soon present in almost every household. However, the impact of computers goes beyond the personal devices. We can think of numerical weather prediction, countless services available on the cloud, web appli-cations running in huge datacenters, etc. Areas such as media processing, computa-tional finance, and animation physics have been evolving in a way that requires more computing power and new techniques to efficiently and effectively process, and thus leverage, tremendous amounts of available data. Computer vision which is being in-creasingly used in video surveillance, character animation and computer interfaces is such a field [1].
Improving the performance of a computer had for a long time been straightforward: the more transistors we cram in the processing unit, the more speed we get. As predicted by Gordon Moore in 1965, this technique allowed the computer industry to double the performance every 18 months. Until recently, this allowed the developer of an appli-cation to effortlessly enhance its performance by upgrading the hardware. Towards the early 2000s, it became clear that this technique had its limits. In fact, below a certain size, transistors are unlikely to operate reliably and dissipating the energy that they use becomes harder at such a small scale.
From that point on, the most promising way to sustain Moore’s law has been to focus more and more on parallel architectures which increase the core count instead of increasing the single core frequency. Fortunately, the arrival of chip-multiprocessors (CMPs) with ever increasing number of cores has made parallel machines ubiquitous. With this inevitable turn, applications that require additional processing power need to be parallel in order to leverage the available resources. However, achieving performance on a multi-core is difficult. Threads regularly interfere, either implicitly when they access the same shared hardware resource, or explicitly when they synchronize. When they interfere, the threads slow each other down, which decreases the parallelism and drastically degrades performance.
Identifying thread interference is difficult because interference can have many causes. Interference can come from any synchronization between the threads, and from any sat-urated hardware component: a cache, a memory controller, a disk, a network card, etc.
Identifying thread interference is also difficult because interference often remains hid-den to the developer. This is obviously the case for an implicit interference, since the interaction between the threads is not explicit in the code, but also for an explicit inter-ference, since any synchronization can silently become a bottleneck when the workload, the setting or the machine changes.
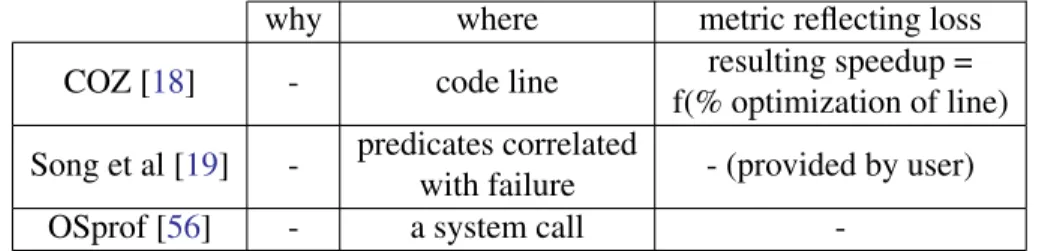
As interference often remains hidden, the developer needs profiling tools to iden-tify the blocks of code that suffer interference. In order to be useful, a profiling tool should answer three different questions. First, the tool should identify where a code suf-fers interference (which line, basic block, function, or even component in a distributed system [2,3], etc.). This information is required to know where the developer should optimize the code. Then, the tool should explain why a code suffers interference (con-tention on a cache, a network, a memory controller, etc.). This information is required to know how the developer should optimize the code. Finally, the tool should assess how much interference degrades performance. Since optimizing a multi-threaded appli-cation is long and difficult, this information is required to avoid wasting time on useless optimizations.
Unfortunately, current profiling tools are ill-suited to identify how much interference impacts performance. Some tools identify where and why the code potentially suffers interference by focusing on a specific interference cause [4–16]. These cause-oriented tools report incomparable metrics related to the cause (e.g., number of cache misses, I/O bandwidth), and are most of the time unable to assess how much interference im-pacts performance. Other tools identify where the code should be optimized in order to achieve better performance [17,18]. These where-oriented tools are not designed to identify if the code suffers interference, and let alone to identify how much interfer-ence impacts performance. Other tools identify the root cause of a performance defect (where) by comparing the execution trace with a representative set of good and bad workloads [19]. These tools explain why a bad workload is inefficient, but they cannot identify interference hidden in both good and bad workloads, which also makes them inadequate to identify how much interference impacts performance in general.
As a result, today, in order to optimize a code, the developer often uses cause-oriented tools to identify why and where the code suffers interference. Since the de-veloper often remains unable to identify how much a reported interference impacts per-formance, the developer spends weeks [19] trying to remove a randomly chosen inter-ference pinpointed by one of the tools, without even knowing if the interinter-ference is at the origin of a performance problem.
In this thesis, we propose a new profiling tool to identify how much interference impacts performance. Our tool does not require prior knowledge, such as the prior identification of good and bad workloads, and performs an analysis of an application with a single run. For that purpose, instead of trying to identify where, why and how much interference impacts performance with a single analysis, we propose to decouple
�������������� �������� ������������ ������ ������� ����������� ��������������� ������� ���������������� ����� �������������� �������� �������������� �������� ������������ ������ ��������������� ������� �������������� �������� ������������ ������ ������� ����������� �������������� �������� ����������������������� ������������������������ ���������������
Figure 1: Cross checking of the causes and the effects
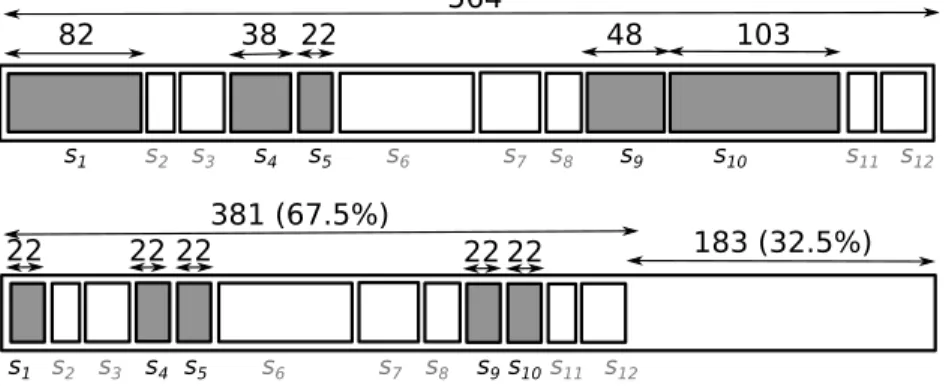
the analysis of the causes (where and why) from the analysis of the effects (where and how much). With this approach, as presented in Figure 1, the developer can cross-check the results of the two analyses in order to fully understand interference. The developer can identify all the blocks of code that suffer interference with the effect-oriented tool before trying to understand why with cause-effect-oriented tools. The developer can also discard an interference bottleneck reported by a cause-oriented tool when the interference is not reported by the effect-oriented tool, since in this case, the interference does not degrade performance (e.g., the block of code in the middle in Figure1).
Decoupling the analysis has two advantages. First, by eliminating the need to iden-tify interference causes, we simplify the analysis of the effects. We do not have to try to understand why a block of code suffers interference: we only have to measure how much interference impacts its performance. Then, since the current cause-oriented tools are already able to efficiently identify interference causes, we can reuse them without any modification to perform the first analysis. Therefore, we only need a new tool that focuses on analyzing the interference effects.
Our idea to build an effect-oriented tool starts with a simple observation. While in-terference can have many different causes, it has only a single effect: inin-terference slows the application down. This slowdown directly indicates how much interference impacts performance. Based on this observation, we propose a metric called RDAM (Relative DistAnce to Minimum) that captures this slowdown during a single run. We also pro-pose an effect-oriented tool, called RDAMcalculator, that uses the RDAM metric to automatically identify both where and how much the code suffers interference.
We evaluate the usefulness of RDAMcalculator with 27 applications (7 from Splash2 [20], 7 from Phoenix-2 [21], 4 from Parsec [22], 7 from NAS Parallel Benchmarks [23], memcached [24] and LevelDB [25]). Our evaluation shows that RDAMcalculator can identify and classify different interference effects, regardless of the interference causes, with few and easily identifiable false positives. Thanks to RDAMcalculator, we identify
interference caused by false sharing, lock contention, poor parallelism, NUMA memory placement, network stack and disk I/O in real applications. In detail, we found that:
• RDAMcalculator is able to detect interference in 15 functions from 11 applica-tions. Among the 15 functions, 3 (20%) are false positives. The remaining 12 functions pinpoint actual interference problems. 6 interference problems were previously identified in other works, while 6 are new.
• For the 12 true positives, RDAMcalculator successfully identifies where and how much interference impacts performance. By cross checking the results of RDAM-calculator with the results of classical cause-oriented tools, we show that we can easily explain where, why and how much interference impacts performance. • Based on this analysis, we can easily correct 8 functions by modifying at most
only 25 lines of code in each application, which leads to a performance improve-ment of up to 9 times.
• We show that the 3 false positives appear when a function seems to slow down when the workload varies, but not because of interference. We show that, even if a manual analysis of the source code is required, these false positives are easy to identify and to discard.
The thesis is organized as follows:
• Chapter2 presents the general background of our topic. More specifically, this chapter starts by presenting parallel architectures and shared resources. In its sec-ond part, Chapter2presents the most frequent performance problems that occur as a direct consequence of accessing shared resources concurrently. The goal from this chapter is to get a sense of these phenomena that cause performance degrada-tion in parallel architectures and why it is important to detect them in order to try and fix them.
• Chapter3presents the state-of-the-art tools that aim to detect performance prob-lems and optimization opportunities. This chapter aims to reflect how different tools tackle the performance analysis goal from different perspectives. After an overview of the different approaches, we explain why an additional perspective is still needed to complete the existing work. More precisely, we conclude that we lack a tool which quantifies the impact of thread interference on an application while directly linking the identified interference effect to the affected code region in the application.
• Chapter4 presents our work to bridge the gap identified in Chapter3. We first present the RDAM metric that we rely on to detect occurrences of interference
between threads. We explain the intuition behind this metric and its formal def-inition. We then present RDAMcalculator, the tool we propose to automatically compute the RDAM metric for a given application.
• Chapter5presents an evaluation of RDAMcalculator with micro-benchmarks and with complete applications selected for their frequent use in validating new perfor-mance analysis techniques. This chapter provides evidence that RDAMcalculator successfully pinpoints interference effects regardless of their various causes. • Finally, Chapter 6 concludes the thesis and discusses a few ideas to extend the
For a long time, manufacturers were able to leverage the shrinking of transistors to create processors twice as powerful every other year. This phenomenon was correctly predicted by Gordon Moore in 1975 and has been verified since then. However, at some point, the pace of advancement started to slow down and is expected to come to a halt soon. In fact, below a certain size, transistors will be unlikely to operate reliably. Moreover, dissipating the energy that they use becomes even harder at such a small scale (Power Wall). In search for additional ways to improve performance beside the single-core frequency, manufacturers relied on a variety of architectural designs that can leverage applications properties. Cache memories, which leverage temporal locality, as well as multi-core architectures, and SMPs, which leverage parallelism, are examples of such designs. Section 2.1presents an overview of some of these features. Modern architectures are, however, more difficult to leverage. In fact, shared resources in these architectures are subject to contention which results in serializing the execution and has other subtle effects that degrade the application’s performance in unexpected ways. In section 2.2, we explain some of these problems and show that they deeply affect the performance of the software that runs on such architectures and therefore need to be diagnosed efficiently.
2.1. A
RCHITECTURAL SOLUTIONS2.1.1. More cores
The solution to the limitation faced by the manufacturers as to the single core fre-quency was to add more cores which allows to execute multiple execution flows at once. Multiprocessing is a generic term denoting the use of two or more central processing units (CPUs) within a single computer system. It regroups many different ways manu-facturers imagined and realized to couple CPUs together. The different settings range from very tightly-coupled ones such as Symmetric Multi-Processing (SMP) multi-core architectures to loosely-coupled multiprocessors, typically clusters.
Figure 2.1, obtained using hwloc [26], shows a socket (to the left) comprising 4 12
Figure 2.1: Multi-core architecture
cores, sharing memory and I/O resources (to the right). Coupling cores in this way can be considered as the building block for increasing core count. However, the number of cores that one can put on a single die sharing other resources is today roughly limited to 16. For this reason, more extensible architectures such as NUMA2.1.3appeared.
2.1.2. Cache memory
Cache memories came to solve a peculiar performance problem: the memory wall. This term denotes the disparity between CPU clock rates and off-chip memory rates, which basically means that memory is not keeping pace with the CPU in terms of speed. Therefore, an access to the Random Access Memory (RAM), which takes 50 to 150 nanoseconds, results in a waste of processing resources (several hundreds cycles where the CPU stalls). To soften the speed gap between the processor and the memory, there are local cache memories between the processor and the bus. The role of these faster, smaller memories is to leverage temporal locality of programs, by storing, closely to processing units, the data and instructions that are likely to be used shortly.
Cache memory levels In most multi-core systems, cache memories come in different speeds and sizes and can be either shared or private. That is why caches are categorized in levels:
• Level 1 (L1) cache is extremely fast (access time is typically 4 clock cycles) but relatively small (e.g. 64 KB).
• Level 2 (L2) cache is larger than L1 (e.g. 256 KB) and slower (a latency of around 10 clock cycles).
• Level 3 (L3) cache is both significantly slower (around 40 cycles) and larger than L1 or L2 (e.g. 4 MB to 40 MB), but is still much faster than the main memory. Often, L1 and L2 are private while L3 is shared among the different cores as we can see in Figure2.1.
Cache coherency Cache memories allow processors fast access to commonly used data, but requires to maintain consistency between the multiple copies of shared data. The most common coherence mechanism used to preserve consistency is based on in-validation where local copies are invalidated if a core updates a shared variable. For instance, in the MESI (Modified-Exclusive-Shared-Invalid) protocol, a memory block can be in one of the four following states:
• Modified: A block in this state is the only valid copy of the block. The memory does not hold valid information and no other cache may have a valid copy. The core that owns this block can write to it without notifying any other core.
• Exclusive: The first core to read in a block from memory will load it into the Exclusive state. This means that the memory has an up-to-date copy and there are no other cached copies in the system.
• Shared: As soon as a second core is reading the same block, it will be loaded to the cache of that core and will be marked Shared in all caches
• Invalid: As soon as one of the copies is modified by one of the cores, all other copies will be marked invalid and will need to be refreshed at the next access Data is transferred between main memory and cache memory in blocks of fixed size (typically 64 bytes), called cache lines. Cache coherence mechanisms such as MESI are applied on a cache-line granularity. This means that even when only a small part of a cache line is modified, the whole 64-byte block is invalidated for the other threads which have a copy of the same cache line.
2.1.3. NUMA
Non-Uniform Memory Access machines allow to link multiple processors together in order to provide a single logical processing unit, therefore making it possible to scale to a much higher core count, which would not be possible exclusively with SMP (Sym-metric Multi-Processing). A NUMA machine (Figure 2.2) is comprised of a set of nodes interacting via interconnect links, each node hosting a memory bank/controller and a limited number of cores sharing a single memory bus. The nodes are connected
Figure 2.2: Simplified NUMA architecture
by means of a high speed cache-coherent interconnect (for example, QuickPath Inter-connect (QPI) used by Intel or HyperTransport used by AMD).
Each core in a NUMA setting has access to memory banks in all nodes. Accessing memory on another NUMA node is called remote memory access, whereas accessing memory on the same NUMA node is called local memory access. A remote memory access is slower than a local memory access since the former has to go over the inter-connect. In fact, even though the interconnect is fast, the signal path length from the processor to memory still has a significant impact. The exact cost differential between remote memory access and local memory access varies from an architecture to another and is commonly expressed as "NUMA factor", i.e. the ratio of a remote access’ du-ration by a local access’ dudu-ration. Different tested platforms showed NUMA factors ranging from 1.2 to 2.5 [27].
The cache coherence on a NUMA machine is usually maintained through what is called a directory protocol. In the directory protocol, memory blocks are still charac-terized by states similar to those presented in section2.1.2. The directory, which is a memory structure, contains information about which processors have a shared cached copy of each memory block and which processor is the owner of the block. Explicit messages are then passed between processors to update a block’s state when necessary.
2.2. P
ERFORMANCE PROBLEMSThe presented mechanisms allow to improve applications’ performance. However, a misuse of these mechanisms can prevent developers from accomplishing a better per-formance, or even worse, degrade the application’s performance. This section presents some of the features that lead to problematic situations performance-wise in multi-core
Figure 2.3: Cache memory architectures and multi-threading.
2.2.1. Cache contention, false and true sharing
The use of last-level (shared) caches can improve performance by supporting on-chip inter-process communication and allowing heterogeneous allocation of cache to processes running on different cores. However, the existence of multiple copies of the same physical memory location at various levels of caches requires extra effort and sometimes costly operations to maintain a consistent view of the content of the memory. Therefore, the limited size of caches along with coherence mechanisms often lead to various contention problems.
When an application needs to access some data, it first looks for it in the cache (Figure2.3). If the data cannot be found, it has to be fetched and loaded from a slower memory. This costly operation is called a cache miss. Cache misses can have different causes. For example, the first time that a data is referenced, an inevitable cache miss happens. Also, a thread can evict its own data from the cache when more prioritary data needs to be loaded and there is no more space left, so when the evicted data is needed again, a miss happens. However, in a multi-core context, cache misses can also be caused by interference between threads that share hardware and software resources. Cache contention problems happen in two kinds of situations. First, when different threads or processes which do not work on the same cache lines share a cache (cross-core interference), and second, when two threads work on a same cache line (sharing cache misses).
Cross-core interference When two threads or processes share the same cache, they may evict each other’s data when they load their own. Whenever the owner of the evicted data needs it back, a cache miss happens. How often this happens depends on
whether both threads/processes are memory-intensive. As in this form of contention the two contending entities do not share any data, they can be separated. For this rea-son, a possible solution to this problem is to place threads wisely in order to balance memory-intensive threads with CPU-intensive ones and thus have less global demand on each shared cache memory. In other words, the solution is to opt for contention-aware scheduling [28].
Sharing cache misses Although a cache miss can happen at any cache memory level, here we address last-level cache misses since they are the most expensive. Sharing cache misses happen when two threads located on cores that do not share a last-level cache work on the same cache line, with at least one of them writing to it. After the first thread modifies the cache line, the copy held by the second thread is invalidated by the coherence protocol and needs to be updated in all cache levels that are not shared with the first thread before being reused. Since the coherence protocol operates at a cache-line granularity, we distinguish two cases.
True sharing In this case, the two threads are actually manipulating the same address in memory. Unless the application’s logic permits the decentralization of the shared object, or the two threads can be assigned to cores sharing a last-level cache, sharing (and the cache misses that ensue) in this case is necessary to ensure the application’s correctness.
False sharing Figure2.4shows two threads Thread 0 (blue) and Thread 1 (red) work-ing on the same cache line. The colors indicate which part of the cache line is used by each thread. As shown in the figure, the actual variables being used by each thread are not the same, and yet at least one of the two threads is forced to load the whole cache line from the main memory each time it is invalidated. False sharing can be seriously harmful performance-wise as it can degrade application performance by as much as an order of magnitude [29]. Furthermore, false sharing is an implicit form of contention, often invisible in the source code, which makes it difficult to find. However, once de-tected this problem can often be easily fixed by changing the relevant data structures so that the different addresses referenced in each thread are on different cache lines (by adding paddings or utilizing thread-private variables).
2.2.2. NUMA: contention and memory placement
A thread running on Node 1, for example, has faster access to the memory in Node 1, than that of Node 2. The former is considered local memory, while the latter is remote, which calls for NUMA-aware strategies to avoid performance degradation due to unnecessary remote memory accesses. However, it has been observed that optimizing
Figure 2.4: False sharing
memory placement for data locality alone does not solve all performance issues in a NUMA context. In fact, the high data traffic on the memory subsystem can be a serious bottleneck as well.
Bad locality Modern multicore systems are based on a Non-Uniform Memory Access (NUMA) design. To efficiently exploit such architectures, it is necessary to take the machine’s physical layout into account. Particular attention has to be paid to remote memory accesses (i.e., main memory accesses performed from a core to a memory bank that is not directly attached to it). Remote memory accesses are a major source of inefficiency because they introduce additional latencies in the execution of instructions. These latencies are due to the extra hops required for the communication between a core and a remote memory controller (about 50% extra time). Therefore, the number of these accesses needs to be limited as much as possible as their impact on the performance of applications can be significant [28].
The presence of remote accesses can arise from various situations. A typical case is when the thread that allocates an object and the threads that access it the most are on different memory nodes. To give a simple but realistic example, let us consider a multi-threaded application where the main thread allocates and initializes an array be-fore spawning N worker threads to do some processing on different parts of the array. Using first-touch (default Linux policy) as our memory allocation policy, the array will be allocated on the main thread’s local memory, while worker threads will be spread across NUMA nodes, which results in a high rate of remote accesses. Another case is when several threads, on different nodes, need to access the same object. These situations can be fixed by carefully placing/migrating the threads, possibly coupled with NUMA-aware load balancing techniques. For example, ForestGOMP [30] is an OpenMP platform which enforces a distribution of threads that maximizes the proxim-ity of threads belonging to the same parallel section. Other techniques rely on migrating data, or duplicating data when threads on different nodes need to access the same data simultaneously.
Contention on the interconnect and memory controllers Remote memory access has been a severe problem for a long time. In most recent architectures, however, an-other problem is taking over as a more impactful (though less frequent) impediment to performance, which is congestion on memory controllers and the interconnect. In fact, some applications can even perform significantly better with decreased data locality, when they succeed at mitigating data traffic congestion [31]. Because of congestion, memory access latencies can become as large as 1000 cycles, from a normal latency of only around 200. Such a dramatic increase in latencies can slow down data-intensive applications by more than a factor of three [31]. Solutions to this problem are built us-ing the same basic techniques (migration and replication of memory pages), but with an important change in perspective. Instead of exclusively focusing on data locality, what needs to be optimized is global data traffic. In other words, strategies need to balance data traffic as evenly as possible between nodes.
2.2.3. I/O contention
In addition to performance problems that arise in computing phases, I/O operations can also lead to contention problems. Compute-intensive applications spend most of their time computing while I/O-intensive applications spend most of their time read-ing/writing to disk or communicating on the network. Detecting I/O bottlenecks for the latter is important to prevent severe performance degradation.
Storage disks Disk contention occurs when multiple processes try to access the same disk simultaneously. This problem is increasingly affecting applications performance in data centers. In fact, with the dramatic improvement in CPU speeds, the disk’s maximal latency and throughput can become a bottleneck, which results in delayed responses and possibly request failures. Increasingly complex scientific applications, for example, require enormous computing power during the course of their execution, as well as huge storage space to store the checkpointing data generated for post-processing. As a side effect of the high degree of parallelism in such applications and the platforms they execute on, I/O contention at servers doesn’t allow overall performance to scale with increasing number of processors [32]. Another study [33] has found that another type of applications (e-mail server), is characterized by its "bursty" workload, which means that peak I/O loads are significantly higher than the average load. If the storage subsystem is not provisioned for its peak load, its performance during peaks degrades significantly, resulting in I/O operations having significant latency. Large-scale web applications also suffer from disk’s insufficient performance [34].
A variety of solutions have been proposed to mitigate this problem. One approach consists in delegating certain task types, such as file caching, consistency control, and collective I/O optimization to an exclusive small set of compute nodes, collectively
termed as I/O Delegate nodes [32]. To address the bursty workload problem, another technique [33] consists in allowing data written to an overloaded volume to be tem-porarily off-loaded into a short-term virtual store. The short-term store is created by opportunistically pooling underutilized storage resources either on a server or across servers within the data center. Writes are temporarily off-loaded from overloaded vol-umes to lightly loaded volvol-umes, thereby reducing the I/O load on the former. While DRAM is frequently used as a cache to mitigate the performance gap between the disk and the CPU, RAMClouds [34] propose to completely rely on DRAM for the storage.
Networks Networks allow to connect multiple computers to have access to more com-puting power, or to link the client side of an application to its server side. Depending on network-to-node performance ratios, the raw performance of a network can be the system’s bottleneck when the system’s computational power outperforms its network capacity. This can even happen accidentally, as a defect can occur in the wiring due to human mistakes (we encountered this problem in the experiment described in sec-tion5.2.5). On the other hand, applications that are deployed on a network have various aims and behaviors. Depending on their logic, applications can have very different com-putation/communication ratios, and thus put more or less stress on the network. How an application’s performance is affected by the network is hence the outcome of both raw network performance and of the application’s behavior. In addition to how an ap-plication interacts with the network, there is also one more side to the story, which is interference between different applications that share the same network.
Bad communication pattern The performance of an application that is deployed on a network depends on its communication-and-computation patterns. Some applications are "friendlier" than others network-wise. Applications with heavy communication needs, expensive all-to-all communications for instance, and/or whose design does not facilitate overlapping communication with computation (an example of such an applica-tion is FFTW [35], a Fast Fourier Transform library that uses hierarchical composition of multiple FFT algorithms, applied to perform a 2D transform of a 2000x2000 matrix) put much more stress on the network, which possibly becomes the system’s bottle-neck. On the other hand, applications (example: MCB [36], a Monte Carlo simulation code) which do not make use of global communications very often, and/or include in-tensive computation phases suffer less from the potential network/node speed disparity. Sometimes, one single application can alternate between computation-heavy phases and communication-heavy ones. An example of such an application is AMG [37], an im-plementation of the Algebraic Multi Grid Solver by using the Hypre library. Depending on the problematic situation at hand, the solution can vary from improving the network capacities (e.g. switching from Gigabit Ethernet (1 Gbps) to Infiniband (80 Gbps)) to an exhaustive redesign of the application. However, first of all, the developer should be
aware that the problem is originated in the network (or in how the application makes use of the network).
Interference from other applications Applications running on a network of computing nodes often share the network with other applications. For instance, large-scale HPC applications are usually submitted, as jobs, to supercomputers that they share with other jobs. Resource managers on these supercomputers use various allocation strategies, ranging from assigning a random set of nodes to more intelligent strategies providing better isolation for the job and better proximity between its processes. When an appli-cation runs on a "private" part of the network, its performance is not affected by other jobs sharing the network. This is true for the Blue Gene systems, unlike Cray XE6 systems [15]. Contention for links can cause significant performance degradation. This has been studied in [15], using pF3D, a diligently chosen parallel application (excellent computational and communication load balance in an ideal scenario). In this study, it is shown that the high variation observed in the performance of this application on a Cray system over months of runs is strongly correlated to inter-job interference. Ex-periments show that the character and location of other jobs running alongside of pF3D has a strong influence on the messaging rates (which in their turn directly affect the global performance of the application). During the different runs, various neighboring jobs were sharing the platform with pF3D, and affected it very differently. MILC [38], which is a communication-heavy application had a much higher impact on messaging rates than LSMS [39], which spends most of its time in computation and performs I/O at larger intervals than the duration of pF3D runs. All other parameters (job’s size and shape) being identical between the two sets of runs, when the conflicting job is LSMS, the messaging rate was 27.8% faster than when the conflicting job was MILC. Multiple other cases gave strong evidence that the differences in performance are due to commu-nication activities of competing jobs. Solutions for this kind of problem revolve around choosing a better resource management policy that minimizes traffic between disjoint sections of the network.
2.2.4. Thread synchronization: contention on locks
Above, we gave examples of contention that result from the sharing of hardware resources. Another type of contention that should be addressed happens because of shared software resources. Such contention is closely related to multi-threading, where multiple threads exist within the context of a single process such that they execute inde-pendently but share their process resources. Multi-threading is not the only way to write parallel programs, but there are reasons why it is widely used. For instance, in compari-son to message-passing, multi-threading allows for an incremental parallelization of the software (e.g. using OpenMP) and is therefore less disruptive. Moreover, data structures
and control structures in many cases can be kept the same as in the sequential program in addition to saving memory by sharing data structures (unlike message passing).
Since threads share the same memory, synchronization mechanisms are needed to preserve memory consistency. Locks are a relevant example of such mechanisms that guarantees exclusive access to some shared data. It often happens that locks create contention on a multi-threaded application, which causes serialization. As a result, idling while waiting for a lock reduces parallelism and parallel efficiency [4]. Common solutions to this problem have been to design more efficient locking algorithms [40,41], or by adopting lock-free data structures [42].
2.3. C
ONCLUSIONThe problems that hinder a parallel application’s performance have various causes and are generally fixed using different techniques. By definition, a contention problem is linked to a shared resource that is being heavily accessed by multiple contenders. This chapter was an overview of the performance problems one can encounter when develop-ing a parallel application, and the shared resources that are often contention sweet spots. Moreover, it served as a motivator as to why each of these problems should be detected, since they significantly hamper performance. Diagnosing performance bottlenecks in multithreaded applications will be of increasing interest as multithreaded applications spread to more fields and devices.
APPLICATIONS
As we could see from last chapter, interference between threads can take many dif-ferent forms. To fix these performance problems, developers need profiling tools that pinpoint them. More specifically, to be able to solve these problems efficiently, a de-veloper needs the answer to three questions. First, where a code suffers interference (which line, basic block, function, etc.). This information is required to know where the developer should optimize the code. Then, why a code suffers interference (contention on a cache, a network, a memory controller, etc.). This information is required to know how the developer should optimize the code. Finally, how much interference degrades performance. Since optimizing a multi-threaded application is long and difficult, this information is required to avoid wasting time on useless optimizations. In this chapter, we group the state-of-the-art tools according to which of these three questions they an-swer. The last section briefly introduces our contribution and explains how it completes the existing tools.
3.1. W
HY:
CAUSE-
ORIENTED,
PROBLEM-
SPECIFIC TOOLSThis section presents the state of the art tools dedicated to the detection of a specific type of contention such as false sharing or NUMA contention. Whereas most of these tools can only say whether a given problem affects an application and pinpoint the affected code block, some of the more advanced can quantify the problem’s impact on the application.
3.1.1. Cache-related problems
Cache-related performance issues has been a hot topic with many works addressing it from various angles. To diagnose cache problems in general, full cache simulation has been commonly used to obtain detailed cache behavior and start from there to detect cache contention problems. For instance CMP$im [8] is a cache simulator with many tunable parameters including allocation/replacement policies, write policies, number of levels in the cache hierarchy, etc. CMP$im gathers statistics such as the total number
of cache accesses and misses, sharing characteristics of multi-threaded applications, coherence traffic, etc. Some of the more advanced metrics reported by this tool are aimed to reflect whether the application would benefit from a shared cache or a private cache, and other insights that can help guide developers decisions. CacheIn [43] is a tool that uses simulation and monitoring to collect and report cache performance data including a false sharing detection algorithm which works by creating a serial trace of all memory references and comparing the address of shared writes to subsequent shared reads.
A major drawback common to this category of tools is the significant runtime over-head. By separately addressing specific cache-related issues, such as false sharing, or inter-process cache contention, some tools can significantly reduce this overhead.
Detecting false sharing To detect false sharing, the different tools rely on collecting and analyzing either memory accesses or cache-related events.
Instrumentation-based Since tools which provide a full simulation of cache memory events have overheads of 100x-plus, other approaches had to emerge. The category of tools presented in this paragraph instrument the application’s code and insert extra instructions which perform a limited simulation of cache memory events. In fact, these tools sacrifice some of the accuracy to the benefit of efficiency, which turned out to be a good compromise.
We present two instrumentation-based tools that differ by their instrumentation tech-nique (static, compiler-based vs. dynamic). Both tools have a significantly reduced overhead (5x) compared to full simulation and although both tools simulate only a part of cache events, they succeed at accurately identifying instances of false sharing.
Dynamic binary instrumentation and compiler-based instrumentation are two alter-native approaches for performing instrumentation. They exhibit different tradeoffs of performance and generality. Dynamic binary instrumentors typically analyze the pro-gram’s code just before execution in order to insert instrumentation. They introduce higher performance overhead, but the fact that they operate directly on binaries makes them extremely convenient. By contrast, compiler instrumentation inserts instrumen-tation in the compilation phase, which requires re-compilation of all source code, but provides higher flexibility.
Example of a dynamic-instrumentation-based tool: The authors in [10] reduce the tremendous overhead of full cache simulation by tracking cache events only when they are relevant to detecting contention that is due to sharing. More specifically, they recognize that cache misses that are due to a limitation in the size of cache memory (con-flict and capacity misses) are irrelevant and can therefore be ignored. On the contrary, they track cache events that are produced by coherence mechanisms, namely cache line
invalidations and subsequent cache misses (which they call contention events).
Their tool returns a variety of interesting metrics, such as the total number of con-tention events and this same figure per instruction, which allows to pinpoint delinquent access instructions, that is to say the instructions that contribute the most to this type of contention. To achieve this, the tool keeps track of an ownership bitmap which shows which threads have accessed which cache lines. For every memory reference, this table is checked and updated such that the tool knows whether a cache invalidation/miss is going to happen and records it when applicable.
To address false sharing more specifically, authors extend the ownership bitmap to contain entries that record the access history for each word within a cache line. The occuring miss is then attributed to false sharing if the threads sharing the cache line do not actually share the same word within the cache line.
Example of a static, compiler-based tool: PREDATOR [13] also instruments the application before analyzing the collected data to detect false sharing. Instead of dy-namic instrumentation such as in [10], PREDATOR uses an LLVM compiler phase to look for memory accesses and add instrumentation code to analyze them.
To identify false sharing, PREDATOR relies on a similar approach to that of [10] which consists in storing metadata for every piece of application data and keeping track of memory activity at a word level. A per-cache-line history table saves the properties (type: write/read, and thread id) of the two last accesses, which is sufficient to detect cache invalidations. The number of cache invalidations is the metric by which PREDA-TOR detects false sharing problems and ranks the severity of performance degradation due to them.
Once cache lines with many cache invalidations have been detected, PREDATOR needs to perform further analysis to differentiate actual false sharing from true sharing. To this end, PREDATOR tracks memory accesses per word, but once a word is accessed by multiple threads, it is no longer of interest since it is the object of true sharing. The per-word analysis also helps diagnose where actual false sharing occurs when there are multiple fields or multiple objects in the same cache line, which can greatly reduce the manual effort required to fix the false sharing problems.
The main novelty in PREDATOR compared to its predecessors is that it is able to generalize from a single execution to precisely predict false sharing that is latent in the current execution. There are two typical situations which can lead to the sudden appear-ance of previously-latent false sharing: when the cache line size or an object’s starting address changes accross executions. In fact, those changes alter the data contained in each cache line and consequently the threads that access and share the cache line.
To be able to predict this latent form of false sharing, PREDATOR introduces the concept of a virtual cache line which is a contiguous memory range that spans one or more physical cache lines. A virtual cache line in the current execution represents a
pos-sible real cache line in either of the two aforementioned scenarios. PREDATOR looks within virtual cache lines for couples of memory words that are written by different threads.
OS-related approaches Although much faster than full simulation, the instrumentation-based tools we presented induce a prohibitive overhead that make their deployment often impractical. The category of tools we present in this paragraph implement system-level detection and mitigation/avoidance mechanisms for false sharing. These tools exhibit a reasonable overhead, which makes them much more suited for deployment. However, the reduced overhead often comes at a cost regarding portability.
Sheriff [44] is a functional replacement for the pthreads library which proposes to turn threads into processes. Sheriff simulates a shared address space using a shared memory region, replaces thread-related calls by their process counterparts (waitpid in-stead of pthread join for example) and uses inter-process mutexes to support POSIX syn-chronization operations. Sheriff provides two tools based on its "threads-as-processes" framework.
• SHERIFF-DETECT tracks write operations by different threads to a page to gather information about whether pages are shared or not. Page-protection allows Sher-iff to track which threads access a page, and therefore whether multiple threads are trying to write to the same page. Whenever a page is shared, updates to this page are done locally by each process between synchronization points and diffs are committed whenever a synchronization primitive is encountered. SHERIFF-DETECT associates a per-cache line status with each cache line in every tracked page, which allows to identify interleaved writes (by different threads) to a cache line, which leads to cache line invalidations.
• SHERIFF-PROTECT uses the same mechanism for preventing false sharing al-together, eliminating the need for programmer intervention. This is of interest because it is sometimes difficult or impossible for programmers to remove the detected false sharing. For instance, padding data structures can cause excessive memory consumption or degrade cache utilization. Time constraints may prevent programmers from investing in other solutions, or the source code may simply be unavailable. The fact that Sheriff operates on shared memory pages privately and differs committing diffs to synchronization points eliminates repeated cache invalidations and thus avoids false sharing.
Sheriff reports false sharing problems accurately and precisely with reasonable over-head (around 20%). However, it can only detect write-write false sharing, and only works for programs that use the pthread library. It also fails to detect false sharing for
programs that use ad-hoc synchronizations or share data in the stack.
Plastic [45] solves two challenging problems. First, it is capable of rapid, low-overhead detection of false sharing in unmodified, running applications. Second, it resolves identified instances of false sharing using its own memory remapping facility.
To detect false sharing, Plastic relies on hardware performance counters to monitor coherence invalidation events, which indicate multiple cores competing for exclusive ownership of a cache line.
Whenever an abnormally large number of coherence invalidations is observed, an efficient multi-stage process is triggered to accurately identify the problem with min-imal overhead. First, physical pages where contention is occurring are isolated, then memory accesses to these pages are sampled for short periods to find the accessed bytes in these pages and the identity of the accessors. This byte-level access log is parsed and contended cache lines are identified as the ones having multiple accessors with at least one writer. From this point forward, the task of Plastic is to transparently remap the contended regions to physical addresses on independent cache lines.
Since virtual-to-physical address remapping has a page granularity due to the MMU, Plastic uses dynamic instrumentation to remap addresses so that colocated objects are moved to separate cache lines. Plastic is currently implemented on the Xen virtualiza-tion platform, but the approach in itself is not specific to hypervisors: Plastic could be incorporated into an operating system. Nonetheless, Plastic’s shortcoming is that the subpage memory remapping mechanism is not currently supported by most existing op-erating systems, reducing its generality. In addition, Plastic cannot pinpoint the exact source of false sharing.
PMU-based approaches PMU-based tools are introduced due to performance reasons. These tools rely on cache events collected from running programs. Performance moni-toring units (PMUs) in processors can count many hardware events with low overhead and one could easily collect the desired counts via APIs such as PAPI [46] or tools such as perf [47]. This approach also provides high portability across operating systems and platforms.
A Machine Learning approach: Jayasena et al [48] take a peculiar approach to false sharing detection. Instead of trying to directly identify false sharing, they seek to derive its potential pattern. The use of machine learning comes from the insight that interesting information can be deduced from different kinds of performance event counts from running programs, but that such data are too overwhelming for human processing. In this work, supervised learning is used to train a classifier with a set of sample kernels (mini-programs) - with and without false sharing. The trained classifier is then used to analyze memory access patterns of arbitrary programs. First, a candidate list of
performance counters is selected: for instance events that correspond to memory access (loads and stores), data caches (e.g., cache line state, cache misses), TLBs, interaction among processor cores, and resource stalls. The mini-programs are then used to compile a shorter list of events that are actually able to distinguish executions with false sharing from executions that are free from false sharing.
Performance overhead on programs in this approach is minimal. Program execution time often remains almost the same or insignificantly increased, at most by 2%, when collecting performance event counts. However, this approach cannot report all existing false sharing problems and cannot provide sufficient information for optimization.
Cheetah [14] brings three main improvements over the aforementioned tools. First, Cheetah does not require a custom OS, nor recompilation and changing of programs. Second, its false sharing detection technique is more efficient, with only 7% perfor-mance overhead. Instead of collecting and analyzing each and every memory access, Cheetah uses a PMU-based sampling to track only one memory access out of a prede-fined number of accesses. Even with sparse samples (e.g., one out of 64K instructions), Cheetah can identify false sharing with a significant performance impact. After captur-ing a memory access, Cheetah performs a series of analysis steps (locatcaptur-ing problematic cache lines, computing cache invalidations, and reporting false sharing) that are much like PREDATOR’s. Finally, it can precisely assess the performance improvement that would result from alleviating a false sharing problem without applying an actual fix, with less than 10% difference. Consequently, developers can avoid unnecessary manual effort leading to little or no performance improvement.
Data-centric approach Pesterev et al. [49] argue that costs due to frequent cache misses on a given piece of data may be spread over instructions throughout the application. Therefore, the approach used by typical profilers which attributes costs to specific code locations can overlook the significance of a cache miss problem. By reporting the data types (instead of code) with the most cache misses, Dprof helps programmers locate data structures that suffer misses in many places in the application’s code. Dprof distinctly reports different kinds of cache misses: invalidation-induced, capacity misses, and con-flict misses, which is important in order to select the right strategy to fix the problem. Dprof’s reporting system consists in four different views ranging from the most generic one, a list of data types, sorted by how many misses they suffer to more detailed presen-tation of memory activity down to the associativity sets used by hot memory objects.
Summary A variety of tools and methods can be used to detect false sharing. A full simulation of cache memory is both inefficient (x100 overhead) and unnecessary if the sole purpose of the analysis is to detect false sharing. This insight was used by instrumentation-based tools [10,13] which perform only a partial simulation of cache
events that are relevant to false sharing detection. Although these tools are effective, they still present a significant overhead (x5). Some other tools based their approaches on modifying the underlying OS [44,45]. However such tools succeed at bringing the overhead down to a mere 20% of the application’s execution time, their weakness is portability as they are only applicable to specific kinds of applications.
By relying on PMU-based sampling, Cheetah [14] both reduces the overhead to 7% and preserves the portability benefit of instrumentation-based tools. Orthogonal to these efforts, Dprof [49] reports cache misses suffered by each data object instead of attributing them to instructions. Knowing that the other tools generally use impact thresholds below which they do not report false sharing instances, Dprof can be useful to unveil false sharing that affects a piece of data in different locations in the code and whose total impact is significant.
Inter-process cache contention
CAER [50] is a Contention Aware Execution Runtime environment oriented towards data centers for web services, where applications with different needs co-exist. While some applications are more concerned with latency requirements (the latency-sensitive category), others have throughput requirements (the batch category). CAER first detects inter-process cache contention then responds to it.
CAER collects cache miss rates using hardware performance monitors and then feeds them to one of its two heuristics which run continuously to detect contention. Each of these approaches aims to supervise the interaction between neighboring (shar-ing cache memory) applications of opposite types.
The first approach, burst shutter, provokes sudden bursts of execution in the batch applications and assesses the resulting increase in cache miss rate of the latency-sensitive applications. The second approach, rule based, observes cache miss rates of the two kinds of applications until their average rises above a threshold. When a contention is detected, CAER responds using a fine grained throttling of the execution of the batch application to relieve pressure in the shared cache.
CAMP [51] is a performance model that estimates the performance degradation due to inter-process cache contention. To this end, a number of metrics are computed. Since this model deals with processes running concurrently and sharing a cache, it first eval-uates the effective cache size of a process, which is the average number of cache lines occupied by the process in a set. The second needed metric is the cache line reuse dis-tance, which is the number of distinct cache lines accessed between two consecutive accesses to the cache line. Combining these two figures allows to compute MPA (Miss Per Access) and then deduce SPI (Seconds Per Instruction). The prediction made has an average error of 1.57% on CMPs that have different cache sizes than the one where
the processes were initially profiled. This model thus helps guide process assignment decisions effectively.
AQL_Sched [52] tries to prevent cache contention, among other goals, instead of detecting it. AQL_Sched is a scheduler designed for cloud data centers where virtual machines from different users are colocated in the same physical machine. This tool characterizes applications dynamically according to how sensitive they are to sharing resources (CPU, memory, I/O, etc.) with other applications.
For instance, some applications (denoted as "Last-level cache friendly") are very sensitive to cache pollution. In contrast, some other applications are not affected by sharing of Last-level cache, but may or may not affect the performance of other appli-cations. The type recognition system periodically collects metrics and computes the current category to which the workload belongs. According to the results of this cate-gorization, different scheduling quantum values are allotted to different workload types, and clustering techniques are applied to avoid performance degradation.
Summary Inter-process cache contention happens when different applications share a cache memory and evict each other’s cache lines in a way that degrades their perfor-mance. Every tool [50–52] dealing with this problem starts by assessing the impact of contention by measuring cache misses and deducing a chosen metric which generally has an associated threshold that indicates a problematic situation. Some tools [50,52] go beyond assessing the impact and respond to the problematic situation online. Such tools use a classification of the running applications according to the sensitivity of their performance to cache-related problems. Based on this classification, clustering and/or scheduling strategies are employed to either fix the problem or prevent it from happen-ing.
3.1.2. Detecting I/O contention
Detecting Disk contention Related work dealing with disk contention can be divided in two categories according to how the problem is perceived. Most approaches deal with cases where disk contention is a permanent problem, and there is no escaping it as long as we keep using the classic storage techniques [32,34]. Rather than supervising the application while it is running, detecting a potential problem, and then applying a fix online, this category focuses on redesigning storage systems. For instance, fully relying on DRAM [34] and delegating I/O operations to a small set of nodes [32] have been proposed.
A few other approaches deal with the disk contention problem as an occasional phe-nomenon that is encountered from time to time or, more generally, as the result of factors that should be monitored dynamically such as the distribution of data popularity. These
approaches focus on detecting such unpredictable bursts, and dynamically coping with them. Everest [33] detects peak I/O request rates that are over an order of magnitude higher than average load and temporarily off-loads data written to an overloaded volume to lightly loaded volumes. To achieve this, Everest monitors the queue length (number of pending I/O requests). When this number is greater than 32, it utilizes spare band-width on other storage volumes to absorb writes performed to the overloaded volume. Ananthanarayanan et al [53] use the varying popularity of files as an indicator for con-tention in MapReduce clusters. In fact, the significant disparity in data’s hotness in these clusters results in the more popular content becoming a bottleneck. To solve this prob-lem, they propose Scarlett, a tool which replicates files based on predicted popularity. For every file, Scarlett maintains a count of the maximum number of concurrent accesses (which reflects the popularity) during the last 24 hours, and then computes a replication factor that is proportional to its popularity. Oh et al [54] deal with hybrid storage solu-tions which use Solid State Drives (SSDs) as non-volatile cache. This peculiar kind of cache requires an over-provisioned space (OPS) (used for garbage collection) in addi-tion to the normal caching space. The authors aim to optimize the performance of this caching system by finding the optimal space fraction that should be allotted to OPS. To this end, they propose a dynamic scheme based on cost models for a given workload.
Detecting Network contention Bhatele et al [15] study performance variability in a parallel application (pF3D). The metric used to evaluate performance is the average throughput (MB/s) since an experiment shows that a high throughput leads to low ex-ecution time and vice-versa. The authors consider performance variability bad as it prevents developers from accurately assessing the impact of their optimization on the code. Therefore, the profiling done here aims to correlate the selected performance met-ric (average throughput) to the potential issue that causes its variability. They conclude that interference from other parallel applications sharing the same network links is the actual culprit.
Casas et al [16] provide two types of measurements to evaluate the relationship be-tween network capability and application performance based on injecting extra packets. The first benchmark is concerned with how an application impacts the network. A low-overhead MPI ping-pong application is first run on an empty network then concurrently with the main application. The latency distribution of the extra traffic is measured in both cases. The difference between the two distributions is then used to infer the level of perturbation caused by the main application on the network.
The second benchmark aims to evaluate the performance an application would have on less capable networks or when it shares the network with other software compo-nents. The benchmark simulates reduced network capability by aggressively injecting network traffic while the application runs. The extra workload is an MPI application whose processes form a ring and exchange messages at a customizable rate. Varying
the intensity of the extra workload allows to know how the application would respond to different degrees of interference. Finally, the different measurements are combined to make quantitative prediction of the performance degradation suffered by an applica-tion A when sharing the network with an applicaapplica-tion B. The first benchmark is used to quantify the impact of application B on the network, then the data previously produced by the second benchmark allows to predict the response of application A to such a level of perturbation.
Summary Network contention is detected using a variety of metrics. These metrics range from the simplest [15] (throughput) to more sophisticated ones based on latency distributions of extra traffic [16] intended for monitoring the network’s activity. These more sophisticated metrics accurately capture both the disturbance that an application causes on the network and how an application responds to such a disturbance.
3.1.3. Detecting NUMA problems
MemProf [55] is a profiler which aims to help developers select an efficient technique to reduce the amount of remote memory accesses in their applications. Previous pro-filers do not track enough information to precisely pinpoint memory objects accessed remotely, neither can they identify opportunities for optimizing such accesses. To bridge this gap, MemProf keeps track of a memory object’s history (which threads access which objects at any point in time during the run of an application) using instruction-based sampling. This history includes, for each access, properties such as the node from which the access is performed, the memory node that is accessed, the latency of the memory access, whether the access is a read or a write operation, etc.
MemProf provides a C API to process the history, which allows to compute statistics about a single thread or object, or about a group of threads or objects. Writing scripts based on this API allows the developer to understand the cause of a high remote memory access rate and therefore select the right solution. For example, in the case of a facial recognition application, MemProf showed that a single matrix out of 200 is responsible for most remote accesses and that it is written only once and then accessed in read-only mode by a set of threads. The problem was then fixed by duplicating this matrix on all nodes after its initialization, which resulted in a performance improvements of up to 41%. MemProf also comes with a set of generic scripts whose output is often sufficient for understanding the symptoms of an application, e.g., ratio and number of remote memory accesses, list of the most accessed object types, access patterns corresponding to an object type or to a specific object instance.
Carrefour [31] targets applications that generate substantial memory traffic, in which case congestion on memory controllers and interconnects can be a bigger issue than
re-mote memory accesses. Carrefour analyzes the memory accesses of applications from which it then deduces memory management decisions such as moving memory pages, where to allocate data, etc. In order to take sound memory management decisions for the aforementioned category of applications, Carrefour uses a three-step algorithm: mea-surement, global decisions and page-local decisions. The first metric to be monitored is the application’s MAPTU (Memory (DRAM) accesses per time unit (microsecond)). Carrefour is enabled for applications with the MAPTU above a certain threshold, 50 being a reasonable value. Below this threshold the application’s performance will likely not benefit from any memory placement strategy that is why Carrefour is shut down to avoid any useless overhead. A few other metrics serve to detect whether applying a par-ticular memory management technique would take the application to a better or worse state contention-wise. For instance:
• MC-IMB (Memory controller imbalance): is the standard deviation of the load across all memory controllers, expressed as percent of the mean. This metric serves to check whether load on controllers is not evenly balanced (MC-IMB > 35%), and when it is the case, page interleaving is resorted to.
• MRR (Memory read ratio. Fraction of DRAM accesses that are reads) is used to decide whether page replication would benefit the application. More specifically, an MRR of 95% or more ensures that synchronizing pages across nodes will not be frequent enough to outweigh the benefits of replication.
Summary NUMA contention has been dealt with in the form of two major problems: 1) high remote access rate, and 2) congestion on the interconnect and memory con-trollers. In the first case, the profiling challenge is to report enough information to the developers in order to guide them to the root cause [55], in the code, of a high remote access rate. In the second case, the focus is put on metrics that reflect whether the sys-tem is in a global state of balance [31] and whether a particular memory placement strategy would alleviate a potential imbalance problem.
3.1.4. Detecting lock contention
Free Lunch [6] is a lock profiler for server-class applications (databases, web servers) which introduces a new metric for lock contention, called critical section pressure (CSP). CSP aims to indicate precisely whether thread progress is being impeded by a lock. This goal can not be reached using metrics centered around total critical section time or the number of acquisition failures. In fact, server-class applications run for long periods of time during which the demand put on locks can vary significantly. For this purpose, Free Lunch was designed for in-vivo use so as to measure CSP continuously over windows of one second.