HAL Id: tel-01892382
https://tel.archives-ouvertes.fr/tel-01892382
Submitted on 10 Oct 2018
HAL is a multi-disciplinary open access archive for the deposit and dissemination of sci-entific research documents, whether they are pub-lished or not. The documents may come from teaching and research institutions in France or abroad, or from public or private research centers.
L’archive ouverte pluridisciplinaire HAL, est destinée au dépôt et à la diffusion de documents scientifiques de niveau recherche, publiés ou non, émanant des établissements d’enseignement et de recherche français ou étrangers, des laboratoires publics ou privés.
Quantitative follow-up of pulmonary diseases using deep
learning models
Sebastian Roberto Tarando
To cite this version:
Sebastian Roberto Tarando. Quantitative follow-up of pulmonary diseases using deep learning models. Signal and Image processing. Institut National des Télécommunications, 2018. English. �NNT : 2018TELE0008�. �tel-01892382�
Spécialité : Signal et Images
Ecole doctorale : Informatique, Télécommunications et Electronique de Paris Présentée par
Sebastian Roberto TARANDO Pour obtenir le grade de DOCTEUR DE TELECOM SUDPARIS
QUANTITATIVE FOLLOW-UP OF PULMONARY DISEASES USING DEEP LEARNING MODELS
Soutenue le 16/05/2018
Devant le Jury composé de :
Président du Jury M. Philippe GRENIER, Professeur, Sorbonne Universités Rapporteurs M. Bertrand THIRION, Directeur de Recherche, INRIA
M. Eric PETIT, Professeur, Université Paris Est Créteil
Examinateurs Mme Julie DELON, Professeure, Université Paris Descartes M. Pierre-Yves BRILLET Professeur, Université Paris 13
Directeur de thèse M. Catalin FETITA, Professeur, Telecom SudParis
2
Table of Contents
1. Context of the study ... 14
1.1 Description of Purpose ... 14
1.1.1 Background: social impact of lung diseases ... 14
1.1.2 Radiology workflow: practical scope and limitations ... 15
1.1.3 Aim of the work ... 18
1.2 Clinical investigation of lung pathologies by MSCT ... 19
1.2.1 MSCT general description... 19
1.2.1.1 CT and MSCT acquisition principle ... 19
1.2.1.2 Utility of CT scans in lung investigation ... 21
1.2.2 Sources of variability in CT acquisition ... 22
1.3 Emphysema and interstitial lung diseases: anatomical description ... 26
1.3.1 Emphysema ... 26
1.3.2 Interstitial lung diseases (ILDs) ... 30
1.3.2.1 Fibrosis ... 30
1.3.2.2 Honeycombing... 30
1.3.2.3 Ground glass ... 31
1.3.2.4 Air space enlargement with fibrosis (AEF) ... 31
1.4 Challenges in Emphysema-ILDs classification ... 33
2. Detection and classification of lung pathologies: state of the art ... 36
2.1 Space transformation ... 38
2.1.1 Filter banks and wavelets transform ... 38
2.1.2 Structural approaches ... 40
2.1.3 Dimensionality reduction techniques ... 47
2.1.3.1 Principal component analysis (PCA) ... 47
2.1.3.2 t-Distributed Stochastic Neighbor Embedding (t-SNE) ... 50
2.2 Feature representation ... 52
2.2.1 Feature space engineering (hand-design) ... 52
2.2.1.1 Texture-based features ... 52
2.2.1.2 Intensity-based signatures ... 54
2.2.2 Automatic Feature learning ... 56
2.3 Classifiers ... 59
3
2.3.2 Fuzzy logic ... 60
2.3.3 Support Vector Machine (SVM) ... 62
2.3.4 Artificial Neural Networks ... 63
2.3.5 Decision trees ... 64
2.4 Comparative performance analysis of SOA classification systems applied to lung texture categorization ... 67
2.5 Focus on CNN-based approaches ... 70
2.5.1 CNN design ... 70 2.5.2 CNN layers ... 72 2.5.2.1 Convolutional layer ... 72 2.5.2.2 Pooling layer ... 74 2.5.2.3 Fully-connected layer ... 74 2.5.2.4 SoftMax output ... 75
2.5.3 Neural network learning procedure ... 76
2.5.3.1 Defining the error measure ... 76
2.5.3.2 Backpropagation, learning hidden units connections: learning features ... 79
2.5.3.3 Ensuring a good generalization: overcoming overfitting ... 80
2.5.4 CNN model evaluation ... 82
2.5.4.1 Feature visualization ... 82
2.5.4.2 Model training visualization ... 84
2.5.4.3 Result visualization ... 87
2.5.5 CNN, an example ... 88
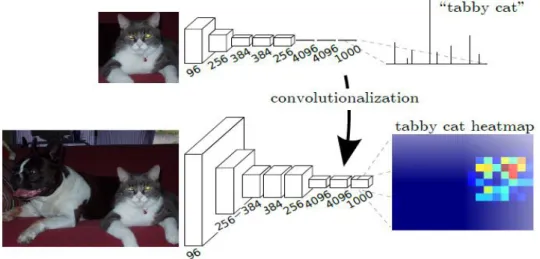
2.5.6 Fully convolutional networks (FCN) ... 89
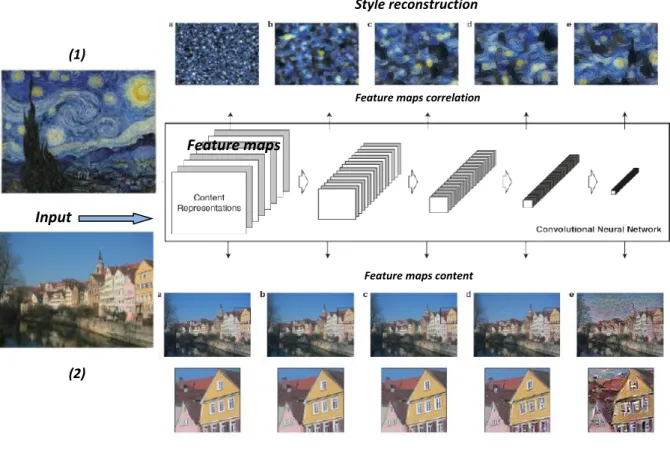
2.5.7 Style representation using CNNs ... 91
3. Machine learning – based classification of lung diseases: proposed approach ... 96
3.1 Building a representative database ... 96
3.1.1 Patient selection criteria ... 97
3.1.2 Acquisition protocol for CT series ... 97
3.1.3 Annotation procedure ... 98
3.1.4 Summary of database content ... 100
3.1.5 Statistical analysis and visualization of raw data ... 107
3.1.5.1 Densitometric and histogram analysis ... 107
3.1.5.2 t-SNE visualization ... 114
4
3.2 Developed approach for ILD detection and quantification ... 120
3.2.1 Data Preprocessing ... 120
3.2.1.1 Lung segmentation ... 120
3.2.1.1.1 Detection of contrasted (low dense) lung regions by flooding ... 122
3.2.1.1.2 Detection of peripheral pathological dense lung tissue ... 124
3.2.1.1.3 Results ... 125
3.2.1.2 Patch filling procedure ... 127
3.2.2 Hybrid method ... 129
3.2.2.1 Purpose ... 129
3.2.2.2 3D classification using parametric techniques ... 130
3.2.2.3 Classification using CNN ... 131
3.2.2.4 Merging classification results ... 133
3.2.2.5 Results ... 133
3.2.2.6 Discussion ... 138
3.2.3 Cascade of Texture-CNN ... 139
3.2.3.1 Purpose ... 139
3.2.3.2 Overall lung texture classification system ... 140
3.2.3.3 Locally connected filtering ... 141
3.2.3.4 Classification using trained T-CNN ... 148
3.2.3.5 Classification using Random-CNN and style representation ... 151
3.2.3.6 Results ... 153
3.2.3.7 Discussion and comparative results ... 158
3.2.3.7.1 Benefits of using cascade of CNNs ... 158
3.2.3.7.2 LCF filtering effect on classification ... 163
3.2.3.7.3 Influence of patch size in CNN classification ... 171
4. Conclusion and future work ... 178
5
List of abbreviations
ACC Accuracy
AE Autoencoders
AEF Airspace Enlargement with Fibrosis
AI Artificial Intelligence
ANN Artificial Neural Network
BMI Body Mass Index
CAD Computer-Aided Diagnosis
CAT Computed Axial Tomography
CLE Centrilobular Emphysema
CNN Convolutional Neural Network
COPD Chronic Obstructive Pulmonary Disease
CT Computed Tomography
DBN Deep Belief Network
DICOM Digital Imaging and Communication in Medicine
DPLD Diffuse Parenchymal Lung Disease
DT Decision Tree
DWF Discrete Wavelet Frames
FBP Filtered Backprojection
FOV Field of View
GAN Generative Adversarial Network
GLCM Gray-level Co-occurrence Matrices
HRCT High-Resolution Computed Tomography
HU Hounsfield Unit
IIP Idiopathic Interstitial Pneumonia
ILD Interstitial Lung Diseases
IPF Idiopathic Pulmonary Fibrosis
LAA Low Attenuation Area
LBP Local Binary Patterns
LCF Locally Connected Filtering
LTRC Lung Tissue Research Consortium
MLD Mean Lung Density
MLP Multilayer perceptron
MSCT Multi Slice Computed Tomography
PCA Principal Component Analysis
PLE Panlobular Emphysema
PREC Precision
PSE Paraseptal Emphysema
QWF Quincunx Wavelet Frames
RBM` Restricted Boltzmann Machine
RELU Rectified Linear Unit
RLE Run Length Encoding
RNN Recurrent Neural Networks
6
SNE Stochastic Neighbor Embedding
SVM Support Vector Machine
TLC Total Lung Capacity
TNR True Negative Rate
TPR True Positive Rate
t-SNE t-Distributed Stochastic Neighbor Embedding
7
Acknowledgment
I have the pleasure of modestly including in this section a mention to all the people that made this work possible, and supported me in this academic adventure. Without them, none of this would have been accomplished.
First and mostly to my thesis director, Professor at the ARTEMIS Department of Télécom SudParis, Catalin FETITA. His caring and exhaustive dedication motivated me to achieve a methodological and innovative study. My deep gratitude to him for teaching me how to conduct a professional research, and allowing me to grow both professionally and personally.
I greatly thank Prof. Eric PETIT and Prof. Bertrand THIRION for having accepted reviewing this manuscript and feeding back valuable and meaningful considerations. To Prof. Philippe GRENIER for his participation as President of the jury, for his clarity and problem understanding that always inspired me, as well to Prof. Julie DELON for her thoughtful analysis of this work and her constructive remarks.
I would also like to include a special acknowledge to Prof. Pierre-Yves BRILLET, Radiologist at the Avicenne Hospital in Bobigny for his great predisposition to work together, merging radiology and engineering disciplines. His professionalism to tackle questions during the study helped in achieving better practical results. I thank him for his commitment to transmit (and translate) the key medical concepts to be considered, and to have provided a valuable annotated database, a key element of this work.
I would like to mention all ARTEMIS department who received me as a member from day one, from the Director of the department Titus ZAHARIA, to all the associated professors. Special mention to Evelyne TARONI for carefully taking care of all the administrative issues during all these years. To all my fellow Ph.D candidate colleagues (Florence, Sébastien, Dancho, Nicolas) with whom I had the pleasure to work and share ideas, thoughts, and feelings. For enriching my creativity and soul, I am grateful to them.
An exceptional mention goes to my family to whom I owe any achievement and progress in my life. To my dear parents Graciela and Roberto for believing in me and supporting me unconditionally with their love and care. And to my beloved sister and brother, Nati y Mati, who inspire me with their extraordinary aptitudes and kindness, and make me become a better person. Even far away, you are always next to me helping carrying on with my dreams.
No phrase will accomplish to thank my dear love Isabel. Always showing me the best human quality I have ever found anywhere, it is a life gift being accompanied by such a lovely person with such a good influence. Thank you for every moment, and being there also in those difficult ones.
Finally, I would like to thank the people of the Maison de l’Argentine (Cité Universitaire) who facilitated my residence in Paris and made me feel at home: Marcelo Balsells, Julia Bernardi, Agustina Primo, Lorena Gabelloni, Madeleine. To them, for having achieved making the place inclusive and harmonious. And to my friends I made there these years, with whom I have shared wonderful and memorable experiences during this work, and hopefully after. You will be always part of my thoughts
8 and heart. By mentioning Fede Ventosinos, who symbolizes due to his kind heart the friendship of
9
Résumé
Les pathologies infiltrantes diffuses recensent un large groupe de désordres pulmonaires et nécessitent un suivi régulier en imagerie tomodensitométrique (TDM). Une évaluation quantitative est nécessaire pour établir la progression (régionale) de la maladie et/ou l’impact thérapeutique. Cela implique le développement d’outils automatiques de diagnostic assisté par ordinateur (DAO) pour la segmentation du tissu pathologique dans les images TDM, problème adressé comme classification de texture.
Traditionnellement, une telle classification repose sur une analyse des caractéristiques texturales 2D dans les images TDM axiales selon des critères définis par l’utilisateur. Récemment, des techniques d’intelligence artificielle fondées sur l’apprentissage profond, notamment les réseaux neuronaux convolutionnels (CNN), ont démontré des performances meilleures pour résoudre des tâches visuelles. Toutefois, pour les architectures CNN « classiques » il a été prouvé que les performances étaient moins bonnes en classification de texture par rapport à la reconnaissance d’objets, en raison de la dimensionnalité intrinsèque élevée des données texturales.
Dans ce contexte, ce travail propose un système automatique pour l’analyse quantitative des pathologies infiltrantes diffuses du poumon fondé sur une architecture CNN en cascade (conçue spécialement pour l’analyse de texture) et sur un prétraitement spécifique des données d’entrée par filtrage localement connexe (permettant d’atténuer l’intensité des vaisseaux pulmonaires et d’augmenter ainsi le contraste des régions pathologiques). La classification, s’appliquant à l’ensemble du volume pulmonaire, atteint une précision moyenne de 84% (75.8% pour le tissu normal, 90% pour l’emphysème et la fibrose, 81.5% pour le verre dépoli).
10
Presentation overview
Infiltrative lung diseases (ILDs) enclose a large group of irreversible lung disorders which require regular follow-up with computed tomography (CT) imaging. ILDs are very rare among lung diseases, and include around 300 different phenotypes. Idiopathic Pulmonary Fibrosis (IPF) is the most spread and responsible of nearly 5% of deaths (per year) from lung disease. The attention to such diseases is nowadays motivated by the advent of new therapies and drugs requiring clinical evaluation. The assessment of ILDs relies nowadays on CT imaging modality because of its high spatial resolution and a good lung tissue contrast provided. This avoids surgical intervention for diagnosis and allows assessing the disease progression over time to guide the therapy.
Although there is a radiological consensus achieved on CT image biomarkers that have to be searched for in diagnosing IPFs, image interpretation remains difficult due to two main issues: multiple sources of variability in CT acquisition altering the image appearance, and the ontological overlap between defined phenotypes or classes. A detailed anatomical description of the targeted pathologies will be presented (chapter 1) to show the significant expertise required to achieve a correct diagnosis. This medical context implies the development of automated computer-aided diagnosis (CAD) tools for pathological lung tissue segmentation. In this way, the pathological regions would be objectively and robustly segmented and fully quantified per CT volume.
The latest state of the art techniques dealing with ILD patterns categorization are thus studied in chapter 2. This problem is addressed as pixel-based texture classification. Traditionally, such classification relies on a two-dimensional analysis of axial CT images by means of handcrafted features. Here will be detailed the three main modules that integrate such a classification model: space transformation, feature representation, and classification. A comparative analysis of the best performing methods, focusing on lung texture categorization completes the presentation. We point out that the use of deep learning techniques, especially Convolutional Neural Networks (CNNs) for visual tasks, have shown great improvements with respect to handcrafted heuristics-based methods, and by consequence, this type of approach becomes the selected reference technique for this work.
Our contribution in the development of a CNN-based CAD system for ILD segmentation and quantification of CT volumes is detailed in chapter 3. An exhaustive description of the proprietary database, built (in collaboration with Avicenne Hospital, Bobigny, France) for the specific task during this research, receives a special attention as one of the key elements of this study. Two preprocessing steps are introduced that need to be applied on the experiments: lung field segmentation, and patch filling procedure (to regularize the subpleural region classification). Afterwards, a hybrid method combining an existing parametric approach and a CNN trained on a reduced dataset is studied as an attempt to achieve higher robustness and specificity.
The CNN showed a good potential in regularizing the classification output, but its usage as unique classifier encountered several issues: necessity to extend the training database, need to reconsider the CNN architecture to target texture instead of object recognition, and the need to take into account the bias introduced by normal high densities of vascular tree and thorax cage. Our work considered these aspects to achieve a performant computer-aided diagnosis system of ILDs based on CNNs.
11 The final classification system adopted is then presented and explained. It consists of a pre-processing module performing a locally connected filtering (LCF) followed by a cascade of two CNNs for a hierarchical classification. The specific preprocessing is applied to the lung images to segment and attenuate the vessel densities while preserving high opacities related to pathologies. This also allows completing the structural knowledge related to the lung mask and airways, by the vascular network.
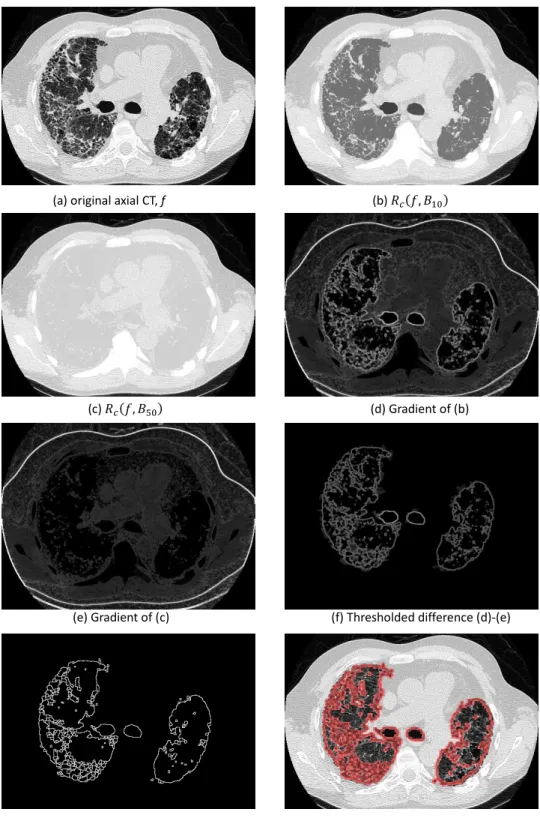
Locally connected filters (LCF) exploit grayscale topological connectivity of each point on the support of a function 𝑓 to filter out 𝑓 values weakly connected with a pre-defined subset 𝑌 𝑠𝑢𝑝𝑝 𝑓 in the local environment of that point. The topological connectivity is verified by means of a morphological filter, namely the grayscale reconstruction by dilation 𝑅𝑓(., 𝑌), since the targeted
structures here are the blood vessels, exhibiting a positive contrast with respect to their environment. The shape and size of the reference subset Y will determine the type of the researched connectivity. LCF effect is to attenuate (or suppress) the f values which are not “linked” with their k-distant neighborhood via a high-intensity path. On contrary, when such connection exists, the structures are preserved via the reconstruction operator with a slight “flattening” of the grayscale levels. LCF thus not only presents a denoising property similar to the median filter, but also preserves spatial structures selected by a local connectivity configuration. To remove vascular structures in the 3D image datasets, we take into account the linear shape of the vessels and their cross-sectional size, and set-up a filtering scheme combining 2D LCF applied across planes oriented orthogonal to different directions in space. We chose 9 spatial directions corresponding with the 18-connectivity (excluding symmetric orientations). The vascular structures are detected by adaptive thresholding and directional reconstruction by erosion applied to the difference between 𝑓 (original) and the LCF filtered image. The sheet-like structures are minimally affected by the filter. To remove vascular structures of different sizes, the LCF is applied in a multiresolution scheme using 2 levels of decimation. In addition, the vascular structures are extracted at each level of resolution and combined together prior to a final adaptive thresholding and filtering, which selects the highest confidence vessels. The vascular network thus extracted is added to the lung mask obtained (and completed by the airway structures) to reinforce the train-and-test process of the network.
With respect to the cascade of CNNs, the state of the art T-CNN network architecture is first used to discriminate the less correlated classes, by grouping fibrosis and ground glass in one single class. The latter two will be further differentiated using a shallow network architecture with random filters (referred to as Rand-CNN in the following) inspired from a texture synthesis approach.
The T-CNN network consists of 5 cascaded layers of convolutional filters to compute image features, with 2x2 kernels and LeakyReLU activations, followed by just one average pooling, with size equal to the size of final feature maps and three dense layers that act as the classifier. Unlike of standard CNN architectures adopted in the literature, this T-CNN does not integrate pooling layers operations between the convolutional layers, and also uses the smallest kernel size to help extracting the best texture representation. The T-CNN ends with a final 3-way SoftMax layer for pathological or normal classification. We used 49 patients for training (from scratch) the T-CNN with the purpose of reaching a numerous and representative set required by the CNN to perform a valid generalization. All these cases are not considered for testing. The rest of 10 different DICOM image series of whole thorax scans are used as test cases. From the training set, non-overlapping patches of 32x32 pixels were extracted. We consider those patches falling 80% inside the annotated ROIs. Horizontal flipping
12 and rotations are applied in order to artificially increase the number of samples and avoid over-fitting the neural network. Thus, the training dataset consisted of 24265 image patches: 8978 normal, 8871 fibrosis+ground glass, 6416 emphysema. Similarly, 32x32 pixels patches were extracted from the test dataset as input for the T-CNN, centered to each pixel in the test image to which a class will be assigned with a given probability.
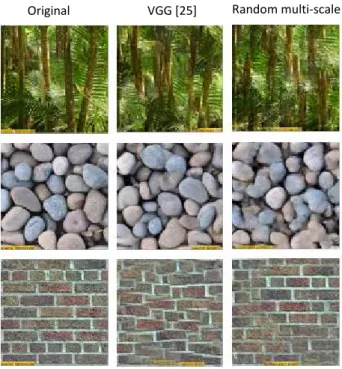
The second module of the cascade, Rand-CNN, tackles the subclassification between ground glass and fibrosis by developing a new texture descriptor. Basically, a texture is characterized by the arrangement of local patterns. It was demonstrated that CNNs are able to extract not only the content of an image but also the style representation, or the texture. The second one, of our interest, was achieved by computing the Gram matrix (correlation between the feature maps given a depth of the CNN). By including the feature correlations of multiple layers, a stationary, multi-scale representation of the input image can be obtained, which captures its texture information but not the global spatial arrangement. It was also shown that even with shallow CNNs with random filters, the style representation could be found for a given input image. These works use such information to synthesize texture images based on examples. In our case, we will use this texture space as a feature descriptor of the pathologies under analysis. Merging these concepts, we use a Random-Multiscale network with seven different filter sizes 𝑛 × 𝑛 with 𝑛 = 3; 5; 7; 11; 15; 23; 29, and 128 feature maps each (896 feature maps in total) to transform the input data. Filter coefficients are obtained from a uniform distribution. Notice that no training is needed in contrast with the T-CNN. Instead, the Gram matrix is computed for the resulting feature maps. The element-wise mean and the standard deviation for the whole set of Gram matrices obtained from T-CNN training patches are computed to obtain two signature matrices (𝐸𝑘, and 𝑆𝑘 respectively, 𝑘 = {1,2}) for each of the two classes to be
detected. Finally, the classification is made by calculating the discrepancy δ𝑘 between the Gram
matrix of the test patch (𝐺𝑋) and the signature Gram matrixes of the two classes - fibrosis and ground
glass. The minimum value for this computation indicates higher resemblance between textures and dictates the decision making.
The 3D test database not being fully annotated, a fully-quantitative evaluation of the classification result was not possible. A semi-quantitative assessment was instead performed using sparse annotations of the ground truth (10 axial images per scan, evenly distributed). The average values obtained for the four defined classes (normal, emphysema, fibrosis and ground glass) were as follows: sensitivity: 51.6%, specificity: 86.4%, accuracy: 84.6%, and precision: 41.2%. If we analyze the normalized confusion matrix for the whole test database, we notice a good prediction of the proposed method for normal and emphysema, but also a less discriminative power between fibrosis and ground glass patches. Several explanations to this have been advanced. One may come from the effect of LCF filtering which also “flattens” the grayscale variation of the fibrosis regions making them more similar to ground glass (especially for the most confusing situations). Another may come from an effect of fuzzy decision at the interface between fibrosis and normal areas (patches falling on these interface zones will be more affected by a misclassification). Also, low precision for some classes (mainly emphysema), may be explained due to the effect of gravitational gradient which modifies the lung texture appearance in the anterior part of the lung (supine patient position). Finally, a lung border effect is acknowledged: few high intensity pixels from thorax cage may be included in the lung field (due to mask regularization) which bias the decision in subpleural areas (effect amplified by the patch filling procedure).
13 In addition, the manuscript proposes a discussion about the usefulness of each component of the overall developed system. The benefit of using the cascade of CNNs is first demonstrated with respect to the T-CNN alone for the same classes both qualitatively and quantitatively (an increase of 10% in sensitivity, 3.5% in precision, 1.2% in accuracy, and same behavior for specificity). Then, we have investigated the benefit of the prefiltering module in the proposed framework by assessing the system performance with and without LCF on the same training and validation dataset. Overall, an increase of nearly 10% in sensitivity, 3.5% in specificity and 4.5% in accuracy was assessed when using LCF versus no prefiltering. Finally, we reduced the size of the context patch from 32x32 pixels to 16x16 to study its influence on the classification output. The same behavior was observed for both patch sizes with a better spatial sensibility for the 16x16 pixels patch (as the patch is smaller, it is less biased at interfaces, leading to sharper transition between two different regions).
A conclusion chapter summarizes the contributions of this work and defines future directions for improvement to allow the translation of this research into clinical routine.
14
1.
Context of the study
1.1
Description of Purpose
This research aims at developing a new robust and reliable solution to be implemented in a computer-aided diagnosis system for quantitative follow-up of pulmonary diseases using volumetric computed tomography.
Among the medical imaging acquisition methods available nowadays, Multi Slice Computed Tomography (MSCT) is currently the most widely available and accurate to characterize and quantify lung pathologies subtypes in a manner that can help determine the progression of specific patterns of disease over time. It is the reference imaging modality for the lung morpho-pathological assessment due to its high spatial resolution and the ability to depict air-filled regions for which other imaging modalities such as magnetic resonance imaging or echography fail.
With this consideration, the proposed solution involves methods for body regions segmentation from whole body Computed Tomography (CT) image series. The aim is to provide a Region of Interest (ROI) partitioning of the dataset according to the anatomical and/or identified pathological regions, mainly interstitial lung diseases (ILDs) and emphysema. Additional tools for computer-aided diagnosis will be considered when applicable, i.e., lung segmentation algorithms. Such ROI partitioning will be exploited to measure longitudinal changes between different temporal series (patient follow-up).
To understand the motivation of this work and the choices that have been made hereafter, we briefly introduce in the following the framework of the study in terms of societal issues, and the actual radiology workflow deployed for diagnosis and follow-up of lung diseases.
1.1.1 Background: social impact of lung diseases
This research focuses on the study of a specific category of non-neoplasic lung pathologies including emphysema and Interstitial Lung Diseases (ILDs), and especially on Idiopathic Interstitial Pneumonias (IIPs) [64] – a variety of ILDs. It aims at developing a computer-aided diagnosis system of these pathologies exploiting the MSCT imaging technology.
The motivation of such a research comes from the increasing healthcare burden associated with this category of chronic diseases and from an unmet clinical need of efficient diagnosis and follow-up tools. Figure 1 summarizes some basic statistics established in 2013 about ILDs impact on European society [66].
15 In United States, 3.7 million people have been diagnosed with emphysema, of which 16700 deaths registered, whereas other studies reported that 80.9 per 100000 men and 67.2 per 100000 women suffer from ILDs with 31.5 and 26.1 new cases diagnosed per 100000 persons per year, respectively.
It is important to mention that emphysema and IIPs are irreversible diseases that can be slowed but not stopped, and to date, no efficient treatment is available for most of IIPs. Such diseases affect the tissue and space within and around the alveoli (air sacs) and sometimes also the airways, the blood vessels and the pleura, leading to profound impairment in lung physiology. Unfortunately, if the initiated injury or abnormal repair from injury is not halted, progressive tissue damage can lead to worsening physiologic impairment and even death. In this context, early diagnosis and follow-up of these pathologies are the key issues for increasing the quality of life and the survival chances of the patient.
If the suspicion of lung disease can be clinically confirmed or rejected by performing pulmonary function tests and chest radiography, to date only the computed tomography (CT) investigation allows an accurate diagnosis of the type of pathology (IIPs including more than 200 different disease entities). In addition, the visual feed-back provided by CT is very valuable due to the high spatial resolution of this imaging technique which allows accurately depiction and spatial localization of the disease patterns. In this respect, an overview of the radiology workflow based on CT images investigation is presented in the next section.
1.1.2 Radiology workflow: practical scope and limitations
In this section, the evolving challenges of radiologists in the visualization and interpretation of large complex imaging studies in the present day is examined, in connection with advances in information technologies. It will serve as contextual information to present the study case of this work and its motivation.
Modern medical imaging modalities, such as Computed Tomography (CT), generate large data sets that are difficult and time-consuming to review by using the standard axial section view. The radiologist must navigate through hundreds or thousands of images (one thorax CT acquisition produces around 700-1000 images). Image properties can be adjusted through different display
16 settings for qualitative analysis and post processed to include new auxiliary tools to more easily and accurately extract quantitative information from the image data, including morphologic and physiologic metrics for example.
The image series are viewed on computer workstations taking advantage of the inherent digital characteristics of the data, after a given patient record is requested to the storage center (see Figure 2 for a schematic illustration of the radiology workflow). Both the client workstations and the center of storage are part of the hospital PACS (picture archiving and communication system), a healthcare technology for the storage, retrieval, management, distribution and presentation of medical images. A PACS has four major components: imaging systems, such as our reference technique fur lung examination, computed axial tomography (CAT scan); a secure network for distribution and exchange of patient information; workstations or mobile devices for viewing, processing and interpreting images; archives for storage and retrieval of images and related documentation and reports. Note that images are generally still displayed as axial sections.
Figure 2. Schematic representation of the radiology workflow in relation with the PACS.
As human observers, radiologists must search for, detect and interpret targets (task known as the interaction of human observers with complex data sets), tools for upgrading the current workflow should be based on human perceptual and attentional abilities and limitations. As the interpretive process involves multiple complex steps, only the essentials steps based on the description proposed in [46] are resumed here:
•
Search, detection and localizationWhen interpreting a diagnostic CT imaging, the radiologist’s first task is the detection and localization of any potential abnormalities. Human performance limitations lead to errors in this task,
Image
acquisition
Image
interpretation
Report
Medical
decision
Radiologic Workstation Storage
Images and Report
17 in the form of false-negative or false-positive judgments. Lesions can be missed, the target may not be salient enough for the observer to recognize it as an abnormality, or it can be consciously reported as an artifact or a normal structure (artifacts and other challenges that arise with CT imaging are discussed later in this chapter). The exponential increase in the number of images associated with each examination make the radiologist’s search work more complex and time consuming. There are several key psychophysical factors that influence radiologists’ ability to perform the detect-and-locate task, including perceptual ones such as target conspicuity and background clutter, as well as attentional factors that arise in the search process. The signal-to-noise ratio is a standard way to quantify the conspicuity of the target. Interventions that boost the signal-to-noise ratio would be expected to improve performance. For example, with cross-sectional images, a key constraint on a reader’s ability to detect and locate targets is often the physical similarity of the lesion with nearby normal structures (“anatomic noise” that is generated by distracting or indistinguishable structures on the image). Another way to expand the visual capabilities is to use techniques such as 3D rendering that can help the reader separate objects in space and differentiate normal from similarly appearing abnormal structures. Note that if a target lesion is not immediately detectable at first glance, the task becomes a visual search task, with the implied complexity (selective attention to different parts of the image). Though the searcher benefits from knowing a
priori the characteristics of the target, this is not always the case in a medical image detection task
(the great variability in visual aspects of pulmonary pathologies, case under study, is discussed in this chapter).
•
Change AssessmentAnother important task is to establish the amount of change of an abnormality over the time, during a longitudinal follow up. Typically, for Interstitial Lung Diseases, this is done in a qualitative manner with pair wise comparisons of images obtained at different time points to estimate the direction and magnitude of change. This can be a difficult perceptual task, made more difficult if the target lesion is poorly seen, or poorly defined, or exhibits multiple or complex changes over time. Acquisition differences between the images to be compared, traduced in changes in the positioning of the patient, reconstruction kernel, or image level selection (all these sources of variability are described in next sections of this introduction chapter), can make comparison harder.
•
Target CharacterizationA third visual task is to characterize the nature of the target lesion. This task calls on visual and cognitive resources to correctly match the appearance of the lesion to a specific pathologic entity. In the particular case of pulmonary diseases, it will be seen later in this chapter that there exists a supplementary difficulty derived from the ontological definition of each of the pathologies. Radiologists are also called on to combine information obtained from multiple types of imaging studies performed in the same patient. In this aspect, multimodality image fusion or image registration can clarify the nature of the target lesion.
18
•
Communicating ResultsOnce a lesion is detected, characterized, and followed, a fourth task for the radiologist is to communicate the results of their image interpretation to the referring physician. This is done by translating visual observations into a description of the finding. This filtering and restatement process of a big amount of data implies a data compression and can introduce ambiguities or errors.
1.1.3 Aim of the work
Now the guidelines of radiology workflow being defined, and thereby also the challenges and limitations, the objective of this work is to investigate how the analysis and visualization can be optimized while navigating large image data sets, in order to achieve safer and better quality care for patients and a more efficient and effective work process for radiologists.
In this regard, tools such as computer-aided detection (CAD), specially based on the new paradigm of Artificial Intelligence (AI), could highlight potentially abnormal areas on a set of images, alerting the radiologist to examine them, thus reducing false-negative rates, interpretation time, and increasing true-positive rates as well as radiologists’ confidence in their decisions. Accurate quantitative information in patient follow up is particularly important as input criteria for clinical decisions making. Note two additional constraints for this analysis: (1) any fully manual quantitative analysis is not possible in practice so automated tools to help radiologists processing the overwhelming (and increasing) amount of information contained in modern medical imaging studies should be developed; and (2) the measures should cover the whole organ under study (in this case the entire lung volume), instead of being restricted to few selected regions only.
To proceed with the practical background definition, the next section describes the case study involving CT modality for lung disease examination. First, the general principle of CT acquisition protocol is explained, followed by the discussion of sources of variability that have the greatest impact on image quality. The appearance of various ILD patterns on CT images is presented and discussed afterwards in section 1.3.
19
1.2
Clinical investigation of lung pathologies by MSCT
As a lung disease develops, it changes the structure of the lung parenchyma affecting the elastic properties of the lung, thereby the lung function. These structural changes are important to the patho-physiology of many lung disorders, such as chronic obstructive pulmonary disease (COPD), emphysema, and ILDs [1]. MSCT can provide reliable measures of lung density, thus differentiating between normal or pathologically-induced attenuation of lung parenchyma. Visual assessment of CT scans provides useful information for identifying and sequentially evaluating the extent of altered lung structures, changes in airway dimensions, vascular distribution, expiratory air trapping, pressure of focal or diffuse disease patterns, etc., and provides a means of objectively characterizing and following these pathologic processes [2].
Understanding the image modality employed for lung investigation is mandatory to apprehend not only the potential but also the limitations of the image cartography provided by this technology. It will help designing the appropriate analysis workflow in relation with the morphological patterns we need to discriminate.
We will briefly present here the principle of the CT without elaborating in detail on the theoretical aspects, but instead focusing on the acquisition parameters and their influence on the image appearance and quality.
1.2.1 MSCT general description
1.2.1.1 CT and MSCT acquisition principle
The CT imaging was introduced into clinical practice by Godfrey Hounsfield and Allan Mc Cormack in 1972. This technology produces high quality data of the inside of the body in cross sectional views by exploiting the principle of image reconstruction from projections [65]. These projections are obtained as the attenuation profiles of an X-ray beam traversing the body and recorded by a detector for a multitude of directions (theoretically an infinite number of projections), generally along a cross-section plane (Figure 3). The reconstructed radiographic image thus produces a cross-sectional view of the body which depicts the local X-ray attenuation coefficients of the tissue. The linear attenuation values are expressed in Hounsfield Units (HUs) defined as the relative attenuation with respect to the water:
𝐇𝐔 = 𝟏𝟎𝟎𝟎 𝛍𝐭−𝛍𝐰𝐚𝐭𝐞𝐫
𝛍𝐰𝐚𝐭𝐞𝐫 ,
[ 1-1 ]
where 𝜇𝑡 is the linear attenuation of the tissue of interest, and 𝜇𝑤𝑎𝑡𝑒𝑟 represents the linear
20
Figure 3. Principle of the multi-slice CT imaging technique.
Image reconstruction in CT is the mathematical process that generates images from X-ray projection data acquired at many different angles around the patient. This step has a fundamental impact on image quality. The reconstruction process is very important to ensure that the CT data obtained accurately represents the true attenuation properties of the lung tissue that has been scanned. Two major categories of methods exist, analytical reconstruction and iterative reconstruction. Methods based on weighted filtered backprojection (FBP) are one type of analytical reconstruction that is currently widely used on clinical CT scanners because of their computational efficiency and numerical stability. If 𝑓 denotes the 2D attenuation coefficients across a section plane for which an infinity of projections (attenuation profiles) 𝑔(𝑠, 𝜃) along all possible directions 𝜃 are obtained (though CT scanning), the analytic reconstruction formula of 𝑓(𝑥, 𝑦) from its projections (also called the Radon transform) is given in parallel projection geometry by:
𝑓(𝑥, 𝑦) = ℬℱ−1{|𝜉|𝐺(𝜉, 𝜃)} , [ 1-2 ]
with ℬ - the backpropagation operator,
𝐵𝑔= ∫ 𝑔(𝑥𝑐𝑜𝑠𝜃 + 𝑦𝑠𝑖𝑛𝜃, 𝜃)𝑑𝜃 𝜋
0 ,
𝑔 - the projection (Radon transform) space,
𝑔(𝑠, 𝜃) = ℛ 𝑓(𝑥, 𝑦) = ∫−∞∞ ∫−∞∞ 𝑓(𝑥, 𝑦)𝛿(𝑥𝑐𝑜𝑠𝜃 + 𝑦𝑠𝑖𝑛𝜃 − 𝑠)𝑑𝑥𝑑𝑦 ,
−∞ < 𝑠 < ∞ , 0 ≤ 𝜃 < 𝜋 , 𝐺 = ℱ𝑔 - the 1D Fourier transform of 𝑔,
𝐺(𝜉, 𝜃) = ∫−∞∞ 𝑔(𝑠, 𝜃)𝑒−𝑗2𝜋𝑠𝜉𝑑𝑠 .
In practice, the theoretical filtering of the Fourier spectrum of projections 𝐺(𝜉, 𝜃) by multiplying with |𝜉| will amplify the noise, thus a weighting using a limited–band filter 𝑊 is applied instead:
f̂(x, y) = ℬℱ−1{W(ξ)G(ξ, θ)} . [ 1-3 ]
Reconstruction from attenuation profile projections
21 W(𝛏) is usually called the reconstruction kernel (acting in the Fourier domain) and is specific to the type of image enhancement design which is manufacturer-dependent. Ideally, this kernel needs to have no edge enhancement or image smoothing. In practice, typical qualitative CT images of the lungs use a reconstruction kernel that has edge enhancement to bring out the small details of lung anatomy but at the expense of increased image noise and reduced accuracy of the CT attenuation values. Similarly, a “soft” (low-pass) reconstruction kernel that smooths the image, induces also a decrease in the accuracy of the CT values.
1.2.1.2 Utility of CT scans in lung investigation
Possibly one of the greatest advantages of CT scanner is that it provides densitometry maps of the lungs and useful information on the type and amount of tissue present (from dense bone to air) since the image scale is linearly correlated with the gravimetric density within the biological range.
Furthermore, quantitative CT offers the possibility to obtain rich anatomical/structural information on lung parenchyma, thereby allowing longitudinal studies of chronic lung diseases. The analysis of the linear attenuation values assigned to lung voxels provides the basis for quantitative CT assessment of lung tissue. For example, one simple quantitative CT derived metric could be the percent of lung tissue having a density less than −950 HU on a CT scan acquired at total lung capacity (TLC), which is a marker of emphysema [3]. Another example demonstrated in previous studies indicates that the overall extent of lung fibrosis on MSCT (i.e., combined extent of reticulation and honeycombing change) is a strong independent predictor of mortality in patients with idiopathic pulmonary fibrosis (IPF) [4]. Thus, quantitative analysis of MSCT is important for management of patients with IPF.
22
1.2.2 Sources of variability in CT acquisition
Despite the great advantages of using CT modality, there are large sources of variations in the CT measurements of lung densitometry such that data from different centers and studies is often not comparable. This may also affect the visual assessment and the (computer-based) automatic detection of pathological regions extent and their characterization. This section will comment on some of the major sources of variation in CT analysis which occur commonly in studies today, to demonstrate the strong variability inherent in CT analysis and its limitations [5]. In implementing automated quantitative routines, it is critical to identify the invariant visual properties despite these sources of variation, in order to avoid inaccuracies in the CT number measurements.
•
CT scanners manufacturers, quality control and calibration
Some studies have shown that while many CT scanners from different manufacturers (Philips, Siemens, General Electric, etc.) are comparable, there can be significant differences in lung density measurements between scanners [5]. Importantly, even within a specific CT scanner there can be changes in the lung density measurement over time, most commonly due to incorrect calibration or changes in the X-ray tube. CT scan is a measuring device, and like all measuring devices it must be properly calibrated before use. Quality control of the CT images must use CT scanner test objects (phantoms) to provide frequent periodic checks on the CT scanner calibration to correct any drift in the CT attenuation values. This calibration process assumes that a patient will be positioned in the center of the CT gantry or isocenter when they are scanned (thus, the importance of the patient position during the test). It appears that as long as scanners are properly calibrated and the images are acquired in a consistent and reproducible manner, the data are useful in assessing disease and disease progression.
•
CT reconstruction kernel
As a part of an optimal CT protocol for a particular study, it is important to define an optimal reconstruction kernel. In Figure 4 it is shown that different reconstruction kernels from two different CT scanners result in quite different CT values frequency distribution. Here it can clearly be observed that the extent of emphysema, for example, measured as the percent of voxels of CT values below -950 HU would really depend on the kernel chosen to reconstruct the images [5].
23 Figure 4. CT value frequency distribution curves for five different reconstruction kernels from two CTmanufacturers from a single subject. The vertical arrow points at the -950 HU threshold cut-off for low attenuation analysis of emphysema. It is shown that the reconstruction algorithm can make significant differences in the “extent of emphysema” measured [5].
•
CT radiation dose
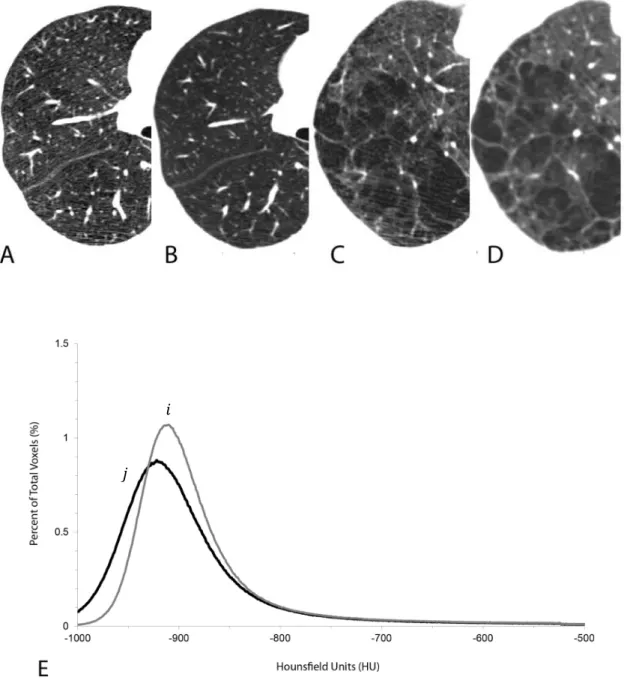
The signal to noise ratio of the CT image is proportional to the radiation dose the patient receives. There is clearly a need to keep the patient radiation dose to a minimum but also ensure adequate signal to noise ratio for the study so that meaningful CT attenuation values are obtained. Thus, the CT radiation dose level used for the evaluation of COPD and ILD is driven by the balance between radiation exposure and image quality. Adequate visual characterization can be achieved with reduced dose CT acquisition techniques, as used for lung cancer screening. However, for pathology grading, excessive image noise due to a reduced CT dose can “simulate” emphysema, particularly at quantitative CT, and may impair segmentation of the airways and quantitative evaluation of airway wall thickness [2] (see Figure 5 for a visual example of the influence of radiation dose over the image fidelity).
For a given CT scanner hardware and software configuration, the X-ray radiation dose is determined by the product of the tube current and total exposure time (mAs) and also by the peak (kilo)voltage, kVp, applied to the X-ray tube. It is important that all subjects/patients are scanned at the same kVp since changing the kVp will change the linear attenuation properties of the matter and so change the measured CT linear attenuation values assigned to the lung voxels independent of any other factor. The larger the patient’s body mass index (BMI, defined as a person's weight in kilograms divided by the square of the body height in 𝑚2), the greater the mAs value needs to be selected, in order to ensure that enough X-ray photons hit the X-ray detector (the larger mass of the patient results in greater attenuation of the X-ray photons produced).
24 Figure 5. CT scans from two subjects scanned using a low dose CT scan (40 mAs) (A and C) and a clinical CT dose (120 mAs) (B and D). The increased noise in the low dose CT scans (A and C) can be seen as linear “streaks” or a more “mottled” image while the clinical dose CT scans show a “smoother” image. Panel E shows the histogram of x-ray attenuation values from one of the subjects to illustrate that there is a difference in the extent of emphysema measured using either the threshold or percentile analysis (curve 𝒊 clinical dose CT scan, curve 𝒋 low dose CT scan). Example taken from [5].
𝑖
25
•
Biological or physiological differences
Subject-specific factors known to influence lung attenuation include age, gender, body size, socio-economic status, depth of inspiration, smoking, and gas-trapping [1]. However, the largest variation in lung attenuation is driven by the ability of the patient to inspire or expire to a given lung volume, maintain that lung volume for the duration of the CT scan, 12 seconds or less, and not physically move while the CT scanner is acquiring image data (to avoid motion artifacts). A deeper level of inspiration during the scan results in a lower mean lung density and more low attenuation regions because there is more gas volume compared to tissue volume. Differences in lung volume will result in differences in lung density, and even relatively small changes in lung volume may affect measurements of a given pathology and its extent. Lung density can vary by as much as 80–100 HU from full-inspiration to end-expiration. Consistent measurements are most likely to be achieved at maximum inspiration because the variation in CT lung density is the lowest at full inspiration [6].
To conclude, ideally, there would be one CT scanner and software system using exactly the same parameters specified in the CT scanning protocol to reconstruct images of the lungs on all subjects in a clinical trial to study given pathologies. This brief review showed some of the major sources of variations that can modify the visual perception of CT images in real clinical practice and which should be considered in the image analysis algorithm development for longitudinal studies.
26
1.3
Emphysema and interstitial lung diseases: anatomical description
The image appearance and the salient parenchymal radiological features on CT for each of the lung pathologies we are interested in through this work – emphysema, fibrosis, honeycombing, ground glass, and airspace enlargement with fibrosis (AEF) are discussed in the following. As we mentioned in the introduction, the purpose is to describe and define the phenotypic abnormalities that can be identified on visual and quantitative evaluation of CT images in subjects with COPD or ILD, with the goal of contributing to a personalized approach to the treatment. Although these abnormalities often overlap, identification and quantification of the predominant morphologic findings and their grouping into defined subtypes improve diagnostic accuracy, help optimizing treatment, and provide a framework for data comparison in clinical trials [2].
Here are some well-known categories of lung lesions seen in CT imaging. Notice that this taxonomy is neither complete nor widely accepted at present as there are no standardized classes defined in the literature. However, these CT signs frequently appear in pathologic lungs and play important roles in the diagnosis of the disease.
1.3.1 Emphysema
Pulmonary emphysema is a type of COPD defined morphologically by airspace enlargement with alveolar wall destruction and gradual loss of lung tissue. This kind of obstructive airway disease is characterized by limitation of airflow [1]. Emphysema lesions, or bullae, are visible in CT images as areas of abnormally low attenuation values close to that of air. Emphysema can be divided into three subtypes, or patterns describing the sizes and the spatial distribution of the lesions: centrilobular emphysema (CLE), defined as multiple small low-attenuation areas; paraseptal emphysema (PSE), defined as multiple low-attenuation areas in a single layer along the pleura often surrounded by interlobular septa that is visible as thin white walls; and panlobular emphysema (PLE), defined as a low-attenuation lung with fewer and smaller pulmonary vessels [7]. Emphysema lung destruction results in replacement of the normal tissue (which has a typical attenuation of about -850 HU on inspiratory CT) with air-containing spaces, of CT attenuation close to -1000 HU [6].
•
Centrilobular Emphysema (CLE)
The primary lesion is produced by dilation and destruction of respiratory bronchioles within a single acinus. The centrilobular lesions are formed by coalescence of several primary lesions. Subsequently, the destruction spreads to the entire lung lobule and fuses many destroyed lobules together to produce a pattern of coalescent destruction that sometimes disintegrates to form large bullous lesions. At CT, CLE is characterized by small well-defined or poorly defined areas of low attenuation surrounded by normal lung. Centrilobular pulmonary arteries or arterioles, which are often seen traversing the hypoattenuated areas, mark the center of each lobule. This is the most common type of smoking related emphysema and is usually upper lung predominant [2]. As CLE becomes more severe, the areas of low attenuation become confluent (Figure 6) and the
27 centrilobular distribution becomes less apparent. In most cases, the areas of low attenuation have no visible walls, otherwise, very thin walls may be seen. Advanced destructive emphysema is manifested as a generalized decrease of attenuation of the lung without focal hypoattenuation and represents an advanced stage of CLE (this pattern may be indistinguishable at CT from the panlobular pattern described below). Confluent emphysema may be differentiated from advanced destructive emphysema by the presence of a preserved rim of normal lung attenuation intervening between areas of lung destruction, and by the absence of lobular hyperexpansion, architectural distortion, or splaying or decreased caliber of vessels.
Figure 6. Examples of CLE are shown: a) mild CLE, scattered centrilobular lucencies, separated by large regions of normal lung, involving an estimated 0.5% of upper lung zone; b) moderate CLE, many well-defined centrilobular lucencies that occupy more than 5% of upper lung zone. Paraseptal emphysema is seen in anteromedial right and left lungs (arrows); c) Confluent CLE, multiple lucencies that span several secondary pulmonary lobules (circled in left lung) but are not associated with extensive hyperexpansion of secondary pulmonary lobules or distortion of pulmonary architecture; d) Advanced destructive emphysema, hyperexpansion of secondary pulmonary lobules with distortion of pulmonary architecture [2].
(a) (b)
28
•
Panlobular Emphysema (PLE)
PLE specifically refers to diffuse emphysematous destruction across the lobule. In general, the extent and severity of alveolar destruction in PLE is milder than that in CLE, but it affects all of the acini within a lung lobule more or less equally (see the pathology example in Figure 7).
Figure 7. PLE CT scan example shows widespread confluent areas of hyperlucency spanning one or several lobules. Some lobules, outlined by intact interlobular septa, appear hyperexpanded (arrowheads) [2].
•
Paraseptal Emphysema (PSE)
Paraseptal emphysema describes emphysematous lesions caused by selective destruction of the distal acinus, and subsequent reports have used it to describe lesions located near the pleural surface close to the chest wall and in the interlobar fissures. In some cases, multiple destroyed acini coalesce to form striking lesions just under the pleural surface on CT scans. CT shows subpleural areas of low attenuation with a well-defined wall (Figure 8). Rows of PSE may mimic honeycombing, but the size of the cysts is larger than that of honeycombing cysts and architectural distortion and other signs of fibrosis are not present. PSE is commonly associated with marked thickening of the walls of proximal bronchi and bronchioles, suggesting a significant airway inflammatory component. PSE occurs across the entire spectrum of minimal involvement to severe parenchymal obstruction and can be progressive.
29 Figure 8. PSE examples in CT: a) mild PSE CT scan in smoker without COPD shows subpleural foci of low attenuation separated by intact interlobular septa along the mediastinum (arrows), measuring less than 1 cm; b) substantial PSE CT scan in patient with GOLD stage I COPD shows numerous well-demarcated areas of subpleural emphysema along chest wall and mediastinal pleural margins [2].
Bullae (avascular low-attenuation areas above 1 cm in diameter, with a thin but perceptible wall) are found in all types of emphysema but are most commonly associated with PSE [2]. Bullae are often located in the upper lobes in both CLE and PSE but are more evenly distributed in the lungs of patients with advanced destructive emphysema.
As a final remark, we show the complete evolution of emphysema as the destruction of lung parenchyma progresses from normal lung tissue to mild, moderate, and severe disease, with complete deletion of the lung architecture (see Figure 9). As all the stages of emphysema must be recognized by the CAD system, it is obvious how complex the classification problem is. It differs from a standard classification problem because of the inherent natural ordering of both the classes, and also the patterns within a single class. It is indeed very difficult to assign a continuous score of disease severity for each pattern by visual evaluation. Clinician only assigns class labels to patterns [8]. Note that this idea will also be applied to ILDs described in next section.
(a) Normal (b) Mild (c) Moderate/Severe (d) Panlob.
Figure 9. Tissue destruction stages due to emphysema. Two sample patches per class are shown. CT intensity window was set to [-1400;200] HU. Severity increases from (a) to (d) with increasing size of low attenuating regions.
30
1.3.2 Interstitial lung diseases (ILDs)
Diffuse Lung Diseases is a group of lung diseases that primarily affect the lung parenchyma. This group is referred to by the generic term diffuse parenchymal lung diseases (DPLDs), or interstitial
lung diseases (ILDs). They are characterized by the inflammation of the lung interstitium (tissue that
surrounds and separates the tiny air sacs, alveoli, of the lung parenchyma). Four types of ILDs, namely idiopathic pulmonary fibrosis, honeycombing, ground-glass opacity, and airspace enlargement with fibrosis (AEF) are resulted by such conditions and are briefly described in the following.
1.3.2.1 Fibrosis
The most relevant CT signs of fibrotic interstitial lung disease are reticular pattern, traction bronchiectasis, ground glass opacity, and honeycombing. Despite standardized definitions, agreement between observers on the presence and extent of these basic patterns is variable. Reasons for these differing opinions include overlap in the CT appearances of honeycombing, traction bronchiectasis, and paraseptal emphysema. Even among experienced thoracic radiologists, agreement on the presence or absence of honeycombing is moderate. An important secondary feature of interstitial fibrosis is distortion and dilatation of bronchi in the fibrotic lung; agreement between observers on the presence or absence of so-called traction bronchiectasis is better than agreement with respect to honeycombing [9]. Bronchiectasis is defined at CT as a dilated bronchial lumen relative to the adjacent pulmonary artery, lack of bronchial tapering, or identification of bronchi within 1 cm of the pleural surface, and it is a known indicator of the presence of fibrosis surrounding this region [2].
1.3.2.2 Honeycombing
Honeycombing is one of the characteristic appearances of pulmonary fibrosis in the end-stage and is extensive pulmonary fibrosis with alveolar destruction resulting in a loss of alveolar walls. As the pulmonary fibrosis progresses, honeycombing becomes more prominent. On CT scans, it is defined as clustered cystic airspaces, typically of comparable diameters of the order of 3–10 mm, which are usually subpleural and have well-defined walls. Although the definition of honeycombing seems to be strict, recognition of honeycombing on CT is various among each observer. Air-space consolidation in the presence of pulmonary (paraseptal) emphysema can mimic this appearance.
31
1.3.2.3 Ground glass
Ground glass is a nonspecific term referring to the appearance of hazy lung opacity and is relatively easy to recognize because of the presence of the thickened alveolar interstitium, or the presence of the fluid partially filling the alveolar spaces. In histology, ground-glass opacity has been seen in patients with the findings of mild or early interstitial inflammation or infiltration and should be considered as consistent with active inflammation only when there are no superimposed findings of fibrosis such as reticulation, architectural distortion, or traction bronchiectasis. In some diseases, such as idiopathic pulmonary fibrosis (IPF) and sarcoidosis, the appearance of ground-glass opacity correlates with disease activity. These areas of ground-glass opacity have been shown to correspond to regions of active alveolitis and precede irreversible changes such as fibrosis and honeycombing [10]. Sometimes it is difficult to decide which lung density is abnormal, that is, whether lung opacity has increased or decreased. Normal lung tissue may have a ground-glass appearance relative to hypoventilated and hypoperfused emphysematous lung.
1.3.2.4 Air space enlargement with fibrosis (AEF)
AEF is pathologically characterized by multiple thin-walled cystic lesions (i.e. abnormal airspaces), histologically intensive hyalinized fibrosis and a bronchiolo-centric location. The histologic characteristics of AEF are comparable with usual interstitial pneumonia (UIP), idiopathic pulmonary fibrosis (IPF) and centrilobular emphysema (CLE). However, studies have shown significant differences in many parameters studied between them. AEF appears to represent emphysema with fibrotic walls. It frequently accompanies CLE. Fibrosis in AEF differed from that in UIP and IPF, more hyalinized in character and with little granulation tissue [11]. For AEF samples CT images, cross-sections of lung show multiple thin-walled cystic lesions of various sizes. A panoramic image of a lung section from an AEF patient also shows multiple cystic lesions with thin walls in the subpleura and deeper parenchyma with tendency of respiratory bronchiolar distribution. The surface of the pleura is quite smooth without thickening or constriction. As mentioned before, the appearance seems to be emphysema, but cystic lesions have fibrous wall and subpleural distribution is different from centrilobular emphysema. Also, the cystic lesion walls of AEF are significantly thicker than that of CLE, and the latter had less inflammation than AEF and no granulation tissue.
32 To summarize ILDs anatomical description, we present several examples of these categories in Figure 10.
Figure 10. Examples of all ILDs classes. Circles in colors indicate approximate pathological regions among healthy lung tissue. Red: fibrosis, blue: emphysema, pink: traction bronchiectasis, yellow: ground glass, violet: honeycombing, brown: AEF.
33
1.4
Challenges in Emphysema-ILDs classification
Several difficulties are implied when designing robust CAD algorithms and were progressively enumerated in previous sections showing the source of variations in CT imaging and lung texture analysis. The fundamental clinical problems of how to consistently detect, characterize, and differentiate the various ILDs remain diagnostic challenges. We summarize them in this section:
1. Image artifacts/noise: gravitational gradient from top to bottom of the image (anteroposterior), motion artifacts (see Figure 11 for examples);
Figure 11. Examples of artifacts that appears in CT imaging. First row examples show blurred images (motion artifacts due to breathing or heart motion – blue ellipses) and the second row shows an example of the gravitational gradient induced in gray scale values seen from anterior to posterior region (note that it could lead to a misclassification of emphysema in the anterior region, for example, or of ground glass in the posterior region where the density becomes higher – red ellipses).
2. Pathological and anatomical variability inter-intra classes (in addition, some patients can have mixed restrictive/fibrotic and destructive/obstructive processes, such as in combined pulmonary fibrosis and emphysema syndrome);
Anterior
Posterior Gravitational
![Figure 29. Illustration of example curves and their correspondent parameters: first row (a,b) – MLD and standard deviation (examples taken from [17]); second row (c,d,e) – skewness; third row (f,g,h) - kurtosis values](https://thumb-eu.123doks.com/thumbv2/123doknet/11414013.288481/56.892.145.743.129.644/illustration-correspondent-parameters-standard-deviation-examples-skewness-kurtosis.webp)

![Figure 54. Visualizations of 6,000 handwritten digits from the MNIST data set [52].](https://thumb-eu.123doks.com/thumbv2/123doknet/11414013.288481/85.892.180.713.125.564/figure-visualizations-handwritten-digits-mnist-data-set.webp)
![Figure 58. Architecture of LeNet-5 used in [21], a CNN for hand digits recognition](https://thumb-eu.123doks.com/thumbv2/123doknet/11414013.288481/89.892.149.736.817.1057/figure-architecture-lenet-used-cnn-hand-digits-recognition.webp)