HAL Id: hal-03011766
https://hal.archives-ouvertes.fr/hal-03011766
Submitted on 12 Jan 2021HAL is a multi-disciplinary open access archive for the deposit and dissemination of sci-entific research documents, whether they are pub-lished or not. The documents may come from teaching and research institutions in France or abroad, or from public or private research centers.
L’archive ouverte pluridisciplinaire HAL, est destinée au dépôt et à la diffusion de documents scientifiques de niveau recherche, publiés ou non, émanant des établissements d’enseignement et de recherche français ou étrangers, des laboratoires publics ou privés.
Copyright
Effective Electronic and Ionic Conductivities of Dense
EV-Designed NMC-Based Positive Electrodes using
Fourier Based Numerical Simulations on FIB/SEM
Volumes
F. Cadiou, T. Douillard, François Willot, J-C. Badot, B. Lestriez, E. Maire
To cite this version:
F. Cadiou, T. Douillard, François Willot, J-C. Badot, B. Lestriez, et al.. Effective Electronic and Ionic Conductivities of Dense EV-Designed NMC-Based Positive Electrodes using Fourier Based Numerical Simulations on FIB/SEM Volumes. Journal of The Electrochemical Society, Electrochemical Society, 2020, 167 (14), pp.140504. �10.1149/1945-7111/abbf68�. �hal-03011766�
Effective electronic and ionic conductivities of dense EV-designed
NMC-based positive electrodes using Fourier based numerical simulations
on FIB/SEM volumes
F. Cadiou1, T. Douillard1, F. Willot∗,2, J-C. Badot3, B. Lestriez†,4, and E. Maire1
1Univ Lyon, INSA de Lyon, CNRS UMR5510, Laboratoire MATEIS, F-69621, Villeurbanne, France 2Center for Mathematical Morphology, Mines Paristech, Fontainebleau, France
3Institut de Recherche de Chimie Paris, Chimie-Paristech CNRS, Paris, France
4Université de Nantes, CNRS, Institut des Matériaux Jean Rouxel, IMN, F-44000 Nantes, France
Abstract
Experimental conductivity measurements, obtained on NMC532-based electrodes with markedly
dif-ferent porosities and made with percolating and non-percolating CB/PVdF phase, are compared with full-field numerical predictions. These ones are based on segmented nanotomography images and phase bulk properties and contain no tunable parameter. A good agreement between the calculated and mea-sured transport properties is observed. 3D current density fields give insights on the microstructure impacts on the current density distribution. Ionic transport is dominated by low tortuosity micromet-ric channels. Results also highlight the presence of “dead areas” in porosity that are crossed by a very low ionic current showing that, at high rate, the effective porosity may reduce to the micrometric pore network. For electronic conductivity, the CB/PVdF mixture percolation threshold is evaluated at 6-7 % in volume. Even below this key value threshold, CB/PVdF aggregates significantly improve electronic conductivity by forming gateways between NMC clusters thus minimising the constriction resistances be-tween them. The size of the representative volume element relative to electronic and ionic conductivities is also investigated.
Introduction
The electronic and ionic transport properties of battery electrodes significantly influence their electrochemi-cal behaviour and performance [1, 2, 3, 4, 5]. These properties strongly depend on the electrode compositions
∗
Corresponding author: [email protected]
and their microstructures. Having a good knowledge and understanding of the relationships between these properties and these electrode parameters is very useful for experimenters and engineers for a good inter-pretation of the electrochemical performance limitations of their electrodes [6, 7, 8]. It is also useful for modellers who, in a complementary way, develop electrochemical models which make it possible moreover to carry out predictive calculations and to specify, at lower cost, the design of more powerful electrodes and batteries [9, 10, 11].
The measurement of the electronic and ionic transport properties of composite electrodes is not trivial. While it is easy to determine the overall electronic conductivity of the electrode film, quantitatively relating this macroscopic value to the microstructure and to the electrode composition actually requires being able to measure the electronic transport properties at different scales of the electrode to identify the most limiting factors [12, 13, 14]. To our knowledge, only broadband dielectric spectroscopy is capable of reaching this level of information, but it is a complex and very uncommon technique [15]. The measurement of ionic conductivity also requires specific experimental approaches, and the results which have been acquired in the few studies on this subject are invaluable [4, 7, 16, 17, 18, 19, 20].
The measurement interpretations of the electronic and ion transport properties of composite electrodes has greatly benefited in recent years from the development of characterisation techniques, by XR and FIB/SEM tomography, of the microstructure of the electrodes [21, 22]. It also greatly benefits from the de-velopment of numerical simulations. Initially carried out on simplified virtual microstructures [23, 24], they have recently been boosted by the development of aforementioned characterisation techniques, which offer the possibility of carrying out these simulations on real or semi-real microstructures. The FIB/SEM resolu-tion makes it possible to distinguish with good precision all the phases present (the active material (AM), the porosity, and the mixture formed by the binder and the conductive carbon), but on a limited volume which may not be representative of the corresponding electrode [6, 25, 26]. In order to perform simula-tions on larger and therefore more representative electrode volume, it is possible to consider microstructures acquired by XR tomography, which however hardly distinguish the porosity from the carbon and binder domains (CBD). Thus the pore/CBD mesostructure must be computationally generated in the empty space of the AM skeleton, either from FIB/SEM data [27, 28, 29], or by various mathematical models to reproduce the various morphologies of the CBD observed experimentally [30, 31]. The generation of entirely virtual microstructure remains used for the simulation of the transport properties because this makes it possible for example to simulate the influence of the compactness of the electrodes or of the physico-chemical processes during the implementation of the electrode slurries [32, 33, 34].
Several studies have investigated how virtual microstructure models, coupled with numerical homogeni-sation tools, may be used to simulate the microstructure and transport properties of porous materials similar to Li-ion electrodes such as fuel cell materials and more particularly their anode layers (see e.g. [35, 36, 37]). The use of mathematically-rigorous random structure models allows one to quantify and decorrelate geo-metrical features of interest, and assess their effect on transport properties. Neumann et al. [35] highlighted the role of phase connectivity and “constrictivity”, and that of “dead-end” branches on the performance of materials with complex, random microstructures (see also [38]). Such studies suggest how microstructures may be tailored for increased performance, based on numerical computations, carried out on tomography images and numerical models. Nevertheless they do not address whether tomography images are sufficient to predict the behaviour of multiscale materials (we refer to [39] for a review of similar question in mechanics).
The simulated effective transport properties can be used as inputs for electrochemical modelling to im-prove the prediction accuracy of models regarding electrode microstructure effects and in particular the tortuosity coefficient [16, 33, 40]. This way, the most recent and advanced approaches consist in performing electrochemical modelling directly in these microstructures [25, 29, 31, 41, 42]. Beyond predicting macroscale quantities such as half-cell voltage or charge/discharge capacity, it can provide a spatially mesoscale (particle-scale) resolved description of the electrochemical reaction intensity. This modeling at the mesoscopic scale is extremely rich in new information, which is however difficult to verify because it requires for this purpose the use of operando and/or spatially resolved techniques for characterising localised electrochemical phenomena [1, 2, 3, 4, 5, 43, 44, 45, 46, 47].
In the present work, experimental conductivity measurements, obtained on NMC532-based electrodes
with markedly different connectivity properties, made of percolating and non-percolating solid phases, are compared with full-field numerical predictions. Our numerical predictions are based on segmented nan-otomography images and phase bulk properties and contain no tunable parameter. The trade-off between representativity and resolution is investigated, in an effort to quantify the reliability and accuracy of numer-ical predictions. A good agreement between the calculated and measured transport properties is observed. The analysis of the current density distribution in the electrode microstructures allows us to deepen our un-derstanding of the influence of this microstructure. Two results can be highlighted. For electronic transport, minimisation of contact resistances between NMC clusters thanks to CBDs which form gateways between these clusters, even in the absence of percolation of the CB/PVdF phase. For ionic transport, the existence of dead zones in the porosity which participate very little in ionic conduction.
1
Electrode materials and electrical measurements
The electrodes studied here have an EV-design. They are fairly dense (porosity is lower than 30 %) and contain a low amount of CB and PVdF additives (total is lower than 6 % by weight). Their microstructures were characterised and digitised in a previous work where the imaging conditions and segmentation process are detailed [48]. Table 1 gives the electrodes mass and volume composition, thickness and density. NA3 and NA2 electrodes have similar composition and density (porosity) at the electrode scale as they only differ by their thickness. NA7 has a higher density and thus lower porosity than NA3 and NA2. NA2b and NA7b contain more CB/PVdF than NA3, NA2 and NA7. NA7b has a higher density and thus lower porosity than NA2b. The NMC volume fractions are close for NA3, NA2 and NA2b on the one hand, and for NA7 and NA7b on the other hand. As a consequence of their higher CB/PVdF content, NA2b has lower porosity than NA3 and NA2, and NA7b than NA7. Table 2 gives the corresponding FIB/SEM volumes compositions and densities.
The electrical properties were acquired with Broadband dielectric spectroscopy (BDS). The theoretical background and experimental setup to implement this technique are well described in previous papers. Electronic conductivity measurements are made on dry electrodes [12] or active material pellet [13, 14, 15] with the classic ex-situ cell, while ionic conductivity measurements are made from the same materials but soaked in the electrolyte with the in-situ cell [18].
2
Fast Fourier Transform numerical simulation method
The simulations were conducted using a Fourier-based method. The starting point of these methods is an integral equation involving a convolution product of the local fields (e.g. the strain tensor in mechanics) with the Green operator associated to a homogeneous reference medium [49], and referred to as the “Lippmann-Schwinger” equation by analogy with scattering theory [50]. In linear conductivity problems, the unknown is the local electric field E(x), expressed as the sum of a mean applied field E and contributions at all points x0 6= x, proportional to the deviation [σ(x) − σ0]E(x0) of the local current field with respect to the reference
conductivity σ0:
E(x) = E − Z
ddx0G0(x − x0) · (σ(x) − σ0)E(x0), (1)
and G0is the Green operator associated to σ0with symbolically G0 = graddiv/(σ
0div·grad) [51]. The
convo-lution product is advantageously computed in Fourier space, whereas the local constitutive laws are evaluated in the direct space, in regularly-spaced voxel grids [52] allowing for the use of complex microstructure derived from microtomography images [53]. Recent works have focused on reinterpreting the
Fourier-Lippmann-Shwinger method in the context of Galerkin discretization and weak-form formulations of the mechanical or conductivity-type problems [54], establishing links between Fourier and Finite Element methods [55, 56, 57], and introducing new numerical schemes inspired by those employed in minimization problems such as the conjugate gradient or Barzilai and Borwein methods [58], to name a few. Studies have highlighted the improvement achieved by Fourier methods in terms of computational and memory requirements over finite element techniques [59, 57]. Fourier-based methods, it has been argued, benefit from a better conditioning of the linear system provided by the Lippmann-Schwinger equation. In certain situations, Finite element methods, however, require a lower number of degrees of freedom to achieve comparable accuracy [57].
Fourier simulations are here performed using the homogenised Ohm’s law. The derivation for the effective electric conductivity and the effective ionic conductivity are mathematically identical and based on the following equations:
div(J (−→x )) = 0,
E(−→x ) = −−−−−−→grad(φ), J (−→x ) = σE(−→x )
(2)
Where φ is the local potential, E the electric field, J the current field and σ is the local conductivity at point −→x . The effective electronic conductivity, σef f, is calculated by applying a voltage across the domain
in the z direction (perpendicular to the current collector) and then normalising the mean current density by the applied mean electric field. Note that this approach assumes that transport across both CBD-AM interfaces and AM-AM particle contacts is ideal (no contact resistance). A calculation on a volume of around 109 voxels takes a few hours (on a standard computing station using 14 threads) depending on the microstructure and the input parameters.
An important point must be emphasised here. As in [60], but contrarily to many other works, we have simply used the ohm’s law to describe the ionic current density. From the perspective of the solver, Ohm’s law, is identical to steady state diffusion. However, during battery operation, the ionic current density within the pore space filled with electrolyte is not only governed by migration but also by diffusion and thus Ohm’s law must be modified to take into account the effect of diffusivity and its dependence on the lithium/salt concentration [25]. Using the simple ohm’s law amounts to considering a situation without dynamic salt concentration gradient. Our simulation results appear however in good agreement with our measurements as well as with the main trends in the literature, as we will see. An important aspect in our work is the study of the geometric distribution of current densities in the microstructure. A key result
is that the electrode effective porosity is reduced to its percolated network of micrometric pores from the point of view of ionic conductivity. This should also apply when a salt concentration gradient is established during battery operation.
3
Effective electronic conductivity simulation
This section focuses on electronic conductivity in the electrodes and hence the electrolyte conductivity will be considered equal to 0 Sm−1. Table 2 gives the overall (sample) and local (FIB/SEM volume) composi-tions of the electrode materials studied here.
In order to calibrate the NMC phase conductivity for the Fourier based simulations we have used mea-surements made by BDS (Broadband Dielectric Spectroscopy) on a dry stacking made of NMC particles only (NA0a sample).
As the NMC clusters used in this stacking are the same as for the electrodes, it is then possible to draw direct comparisons between this stacking conductivity and the one of the NMC skeleton in the electrodes NAX and NAXb, as long as the volume fractions are comparable.
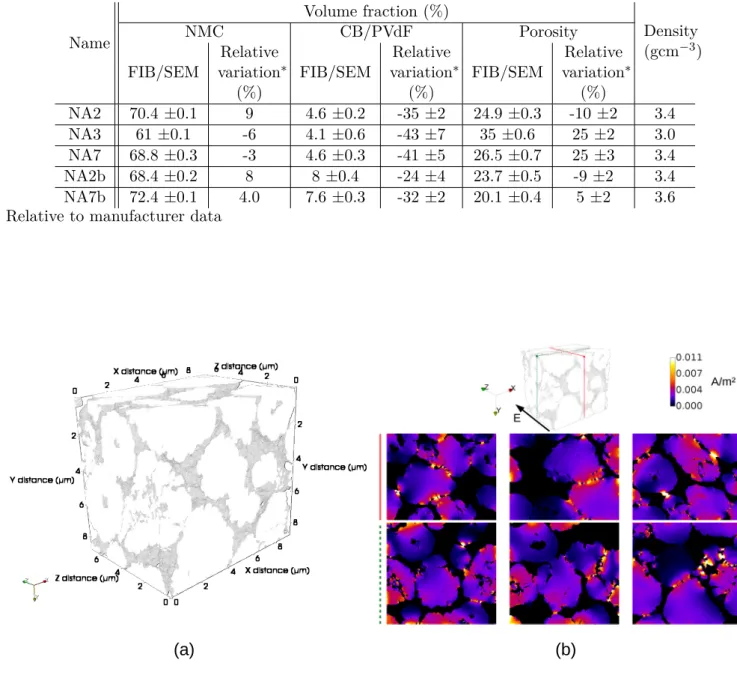
In order to estimate by reverse calculation the NMC phase conductivity, NA2 and NA3 FIB/SEM volumes were then numerically striped of their CB/PVdF to leave only NMC and porosity to mimic NA0a type microstructure (cf. Figure 1 for an example). Indeed, no 3D volume FIB/SEM acquisition has been performed on NA0a sample. In this one, NMC volume fraction is 65 % while it is 70.5 % and 61 % respectively for NA2 and NA3, which frames the NA0a one. These modified volumes are called NA2-0 and NA3-0 hereafter. Fourier based simulations are then performed on a binary microstructure of NMC (conductive) and porosity (insulating) using equations 2.
NA0a conductivity at its different scales was measured by BDS. The sample conductivity was deter-mined at 0.00136 Sm−1, the cluster one at 0.48 Sm−1 and the grain one at 120 Sm−1. The conductivity drop from grain to cluster scale is due to the resistive grain boundaries, while the drop from cluster to sample scale is due to the constriction and contact resistances between the clusters. Several simulations were then conducted by varying the NMC phase conductivity until one value was found to give the right effective conductivity (equal to the experimental one) for both volumes. We respectively obtained an NMC phase conductivity of 0.00417 Sm−1 and 0.0068 Sm−1 for the microstructures from NA2-0 and NA3-0. This discrepancy can be explained by the difference in NMC volume fraction between the two microstructures. In fact, NA3-0 has a lower NMC volume fraction than NA2-0 (respectively 61 and 70.4 %) which implies that its NMC conductivity must be higher than in NA2-0 for the two volumes to show the same effective
conductivity. Furthermore, both values are supposed to frame the one in NA0a as its NMC volume fraction is intermediate. By using a simple linear interpolation we could estimate the NMC phase conductivity in NA0a to be 0.0057 Sm−1 for its 65 % NMC volume fraction.
This NMC phase conductivity shows a quite different value than the one measured experimentally by BDS at the NMC cluster scale which is two orders of magnitude higher (0.48 Sm−1). It is thus worth mentioning that the numerically determined NMC phase conductivity considers here the NMC phase as a continuous skeleton and is then homogenised. This means the resistive contacts between NMC clusters are directly integrated in the phase and then not geometrically discriminated. This value of 0.0057 Sm−1 is then the consequence of this homogenisation and of geometrical features such as phase intraconnectivity, volume fraction and tortuosity.
To explain further this discrepancy between experimental and numerical results spotted in the previous paragraph we can stress more the fact that they are not directly comparable. Contact areas are indeed present between NMC clusters. Some of them can be very narrow thus creating a so called bottleneck effect. Above all, these contact areas are sources of discontinuities at the nanometer scale, such as insulating air gaps, that act as energy barriers to the electron transfer between two touching clusters. Moreover, the struc-ture at the NMC cluster surface itself can also act as a conductivity barrier if, as an example, the outer shell has not exactly the same composition as the cluster “core” [61]. Such kind of data are not accessible from the FIB/SEM volumes due to the limited resolution and the nature of the acquired information. To image these defects at the electron hopping phenomenon scale we should be able to image chemical maps at a 1 nm size resolution as this phenomenon is typically at the range of a few nanometers. It then makes sense that the NMC conductivity numerically measured is the NMC skeleton one, thus including contact resistances between clusters, and not the NMC cluster one. To sum up, such numerical conductivity estimation leads to a “pragmatic” value corresponding to an homogenised NMC network.
Figure 1 also shows 2D maps of the current density flux for slices in volume NA2-0 that are perpendicular or parallel to the imposed potential field. A color map is used to distinguish areas in which the potential difference application causes an enhanced electric current (in yellow-white) from areas where it is moderate (in blue) or inexistent (in black). It can be seen that narrow contacts between two clusters or grains within fragmented clusters are constrictive regions leading to more localised and denser current fluxes, hence the critical role of contact areas on the overall microstructure conductivity.
Once the question of the NMC phase conductivity is solved, it is possible to compute the effective electronic conductivity in the FIB/SEM volumes from the real electrode microstructures. To do so, we used a CB/PVdF phase conductivity of 350 Sm−1 as experimentally determined in [62]. The use of such experimental value is justified in another work [53] for a different CB/PVdF binder composition hence the difference in conductivity between this work and the previous one [53].
Simulation results are gathered in Table 3 alongside experimental measurements made by BDS. The data ranges in the experimental values in Table 3 is the result of several measurements. Numerical val-ues show overall a good agreement with the experimental ones except for the NA7 sample which exhibits considerably higher simulated effective conductivity. This difference can be explained by the presence of a localised CB/PVdF percolation in the FIB/SEM volume in the simulation direction (see Figure S1), while experimental measurement indicates that the CB/PVdF phase does not percolate in the whole electrode. This is explainable by a statistical variation in the captured microstructure due to the relatively small FIB/SEM volume size. Note that the electrodes contain a CB/PVdF volume fraction significantly higher than the one found in the FIB/SEM volumes (Table 2). This difference is due to the presence of some very bulky CB/PVdF agglomerates resulting from insufficient mixing, or from a lack of stability, in the ink used to manufacture the electrodes [48]. These bulky CB/PVdF agglomerates are few in number and clearly identifiable in the electrode cross-sections and care has been taken to make the FIB/SEM acquisitions away from them. The good agreement between the values simulated from the FIB/SEM volumes and the mea-surements carried out on the electrodes confirm that these very bulky CB/PVdF agglomerates form islands, isolated from each other, inside the electrode and therefore contribute very little to the conductivity of the whole.
Once one has segmented volumes from actual microstructures, it is possible to numerically modify these volumes to assess the impact of microstructural / composition modifications on effective properties. Such modifications were here applied to the CB/PVdF phase particularly to assess the percolation effect.
Erosion and dilatation operations were simply applied to modify the CB/PVdF phase morphology. The simplest process was to increase the CB/PVdF volume fraction using dilatation operations. The CB/PVdF phase was isotropically dilated on several distances (1, 2 or 3 voxels) and then subsequently re-added to the unmodified NMC phase. We then obtained a microstructure similar to an electrode with the same NMC loading but a virtually increased CB/PVdF volume fraction. This CB/PVdF addition was only performed in the porosity and did not affect the NMC phase.
Mimicking a CB/PVdF volume fraction decrease was slightly more complicated as a simple erosion on the CB/PVdF phase automatically led to a complete contact loss with the NMC phase. We then had to erode the CB/PVdF phase only at its contacts with the porosity. These interfaces could be identified by dilating the porosity once and then performing a boolean "and" operation between the dilated porosity and the CB/PVdF phase which gave us the CB/PVdF surface in contact with the porosity. This interface could be subtracted from the CB/PVdF phase to decrease its volume fraction. By dilating the interface, the decrease process could be magnified to further erode the CB/PVdF phase and its volume fraction. By applying this method we could obtain microstructures with the same NMC loading but less CB/PVdF. Such method naturally erases the smallest CB/PVdF regions first. These methods, graphically summarised in Figure 2, have however the disadvantage to act on the CB/PVdF internal porosity by increasing it with the erosions and closing it with the dilatation process. This microstructural feature is then altered regarding what is observable in the raw FIB/SEM volumes. However, keeping it would lead to a more complex process and we can consider that this internal porosity has little effect on the electronic conductivity within the CB/PVdF mixture.
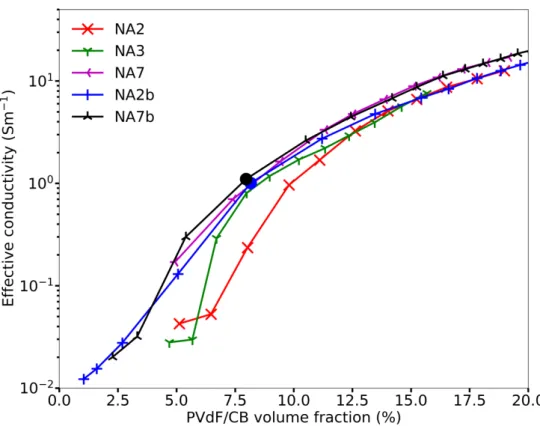
Simulated effective electronic conductivity evolution from the modified FIB/SEM volumes is shown in Figure 3 where the CB/PVdF volume fraction is either increased by dilatation for all electrodes or decreased by erosion for NA2b and NA7b electrodes only. We can notice that this curve set seems to draw a master curve at the exception of NA2 (from 4.8 % to 12 %) and NA3 (from 4.7 % to 8 %). This tendency towards a master curve existence is certainly a picture of microstructural common characteristics in the considered electrodes. In particular in the way the CB/PVdF domains are arranged on the NMC stacking surface constraining their distribution within the electrode. As the NMC clusters have the same dimensions in all the electrodes, and same way of stacking, it seems logical to find similar electronic conductivity values at similar CB/PVdF volume fractions. This so-called master curve does not exhibit a clear percolation thresh-old. Having a second less conductive and percolated phase (the NMC one) can hinder this threshold a little by smoothing the transition in effective conductivity, which has been experimentally observed on LiV3O8 based electrodes [63]. NA2 and NA3 volumes however clearly stand aside from this so-called master curve within the 5 to 8 % range (CB/PVdF volume fraction) and show a clear increase in their effective electronic conductivity around 5 to 6 % CB/PVdF volume fraction illustrating then the existence of a percolation threshold for this phase. The NA2 and NA3 FIB/SEM volumes appear more representative than NA7, as it is mentioned above, in which partial percolation of the CB/PVdF phase is observed in the direction of the simulation (i.e. the direction of the applied electrical potential difference). The difference between effective conductivities for NA2b and NA7b when the CB/PVdF volume fraction is reduced by erosion and the
effec-tive conductivities for NA2 and NA3 therefore indicates that the erosion process creates a microstructure that differs from reality. For NA2b and NA7b, starting from a CB/PVdF percolated network, the erosion process at the interface with porosity tends to retain the percolated state. Whereas an actual electrode is produced from an ink in which the CB/PVdF phase tends to agglomerate with itself under the effect of attractive interactions and thus will rather tend to form domains isolated from each other at low volume fractions.
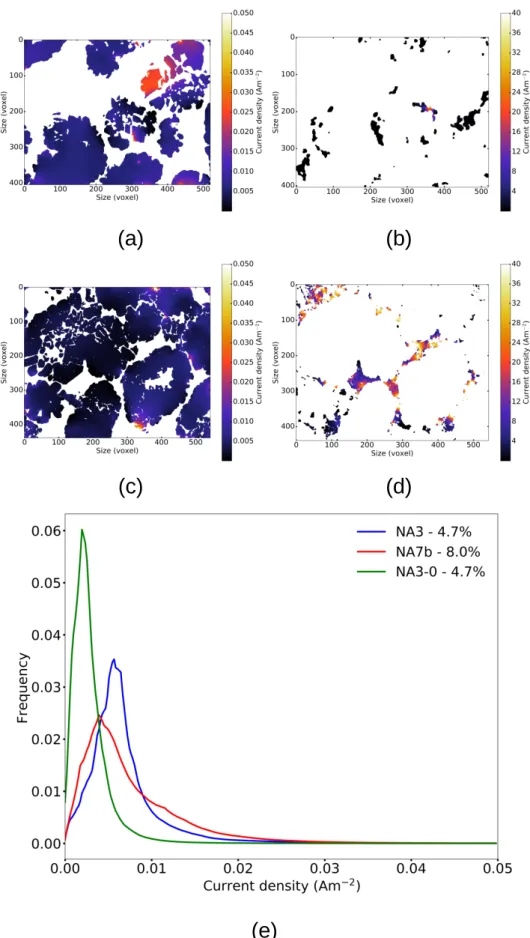
Figure 4 provides a comparison of the current density maps in both the NMC (Figure 4a and 4c) and CB/PVdF phases (Figure 4b and 4d) for NA3 (Figure 4a and 4b) and NA7b (Figure 4c and 4d). The current density distributions are also reported in the NMC phase Figure 4e. First note that the cumulative current density flowing through these two volumes, in response to the application of a potential difference of 1 V, is 5 Amm−2 for NA3 and 275 Amm−2 for NA7b, which are distributed as follows: for NA3, 0.30 Amm−2 (6 %) in the NMC phase and 4.7 Amm−2 (94 %) in the CB/PVdF phase; for NA7b, 0.63 Amm−2 (0.2 %) in the NMC phase and 274 Amm−2 (99.8 %) in the CB/PVdF phase. The higher cumulative current den-sity in NA7b is related to its higher effective conductivity stemming from the CB/PVdF phase percolation. Proportionally, the current uses more the CB/PVdF phase in a microstructure in which it is percolated com-pared to a microstructure in which it is not (respectively 99.8 vs. 94 % of the cumulative current density). However, the NMC phase in NA7b is, on the whole, crossed by a higher total current density than in NA3 (respectively 0.63 and 0.30 Amm−2). This is due to the CB/PVdF phase percolation which distributes this current more widely, and at higher levels, throughout the electrode volume and thus maximise the NMC phase use. This feature is illustrated by the current density distribution, which is wider in NA7b. The most frequent current density is lower for NA7b compared to NA3, but a fraction of the NMC phase sees a higher current density in NA7b than in NA3. The current density distribution in NA3-0 is also plotted in Figure 4e. This distribution is shifted toward lower current densities, in relation with its lower effective conductiv-ity. Compared to the two others, the cumulative current density flowing through NA3-0 is only 0.12 Amm−2.
In addition, the current density maps allows to see that near areas where the CB/PVdF phase is crossed by a high current density, the NMC phase is very little if not used. Conversely, the NMC phase appears more used where the CB/PVdF phase percolation is interrupted and thus where the NMC phase must take over from the CB/PVdF mixture for carrying the current. The comparison with the current density maps from NA2-0 volume (without CB/PVdF) shows that in NA3 and NA7b zones of current constriction at the junctions between NMC clusters are not witnessed. In fact, this current is distributed for the most part by the CB/PVdF phase and not the NMC one. Resistive constrictions between the NMC clusters are thus
avoided thanks to the CB/PVdF aggregates.
4
Effective ionic conductivity simulation
FIB/SEM volumes can also be used to compute effective ionic conductivities. To achieve that, NMC and CB/PVdF were considered as complete insulators. The same electrostatic equations were solved considering the electrolyte local ionic conductivity equal to 1 Sm−1 as measured in [64]. Results are gathered in Table 4 and plotted in Figure 5a. An experimental value could be determined by BDS on a stacking made of NMC clusters (binded with 5 %wt of PVdF) with porosity 26 % and wetted by a liquid electrolyte, LP30 (conductivity at room temperature about 1 Sm−1). The experimentally measured ionic effective conduc-tivity for this sample (named NA0-b) is 0.0625 Sm−1 which is very close to the simulated one (see Figure 5a). It suggests that the Fourier based simulations undertaken here on FIB/SEM volumes can perform a fair prediction of the electrode effective ionic conductivities. No further experimental data is however available for comparison as it is difficult to discriminate the ionic from the electronic contributions to the total conductivity. This part thus needs further investigation to assess the Fourier based method reliability to precisely predict the effective ionic conductivity in composite electrodes wetted by a liquid electrolyte. It shows nevertheless the interest of numerical estimations to overcome some experimental difficulties in measuring this property. Simulation results are also well fitted by an Archie’s law [65].
σef f = σionφmporo (3)
With σef f is the effective conductivity, σion the electrolyte conductivity and φporothe porosity volume frac-tion wetted by the electrolyte and m is an exponent that depends on the conducting phase topology and is thus related to the porous phase tortuosity. The fit results here in a m = 2 exponent. When fitted from experimental ionic conductivity from NA0-b this Archie’s law gives a m = 2.05 exponent; previous measurements done on another NMC stacking wetted by the same electrolyte gave m = 2.5 [18]. Simulation results are also compared in Figure 5a with effective ionic conductivities inferred through the tortuosity factor equation.
σef f = σion
φporo
Where T au is the tortuosity factor. This tortuosity factor accounts for all aspects that are hindering the ion transport through the electrolyte within the electrode porosity. One of these hindering aspects, at a first order, is the porosity geometric tortuosity τ . For a porous medium with Lpore as the actual path
length through pores, and Lstraight as the straight (Euclidian) distance, the strict geometrical definition of
tortuosity is:
τ = Lpores Lstraight
(5)
Epstein [66] showed that for a bundle sinuous but parallel pores, if the geometric tortuosity τ is the sole aspect influencing the ion diffusion, the tortuosity is the square root of the tortuosity factorT auas presented in equation 6.
T au= τ2 (6)
Other factors such as interactions at the solid/liquid interfaces between the active material or the CB/PVdF mixture and the electrolyte [64, 18] can influence the ion transport. It is generally consid-ered that only taking into account the geometric tortuosity is insufficient and leads to overestimating the effective ionic conductivity. The simulation results are well fitted by equation 4 considering tortuosity factors between 3.1 (for NA3) and 6.2 (for NA7b) (Table 4).
These values are in good agreement with the estimations from Usseglio-Viretta et al [28] as shown in Figure 5b. The lower and upper bound lines give limiting values that were also determined through numer-ical simulation but by solving the Laplace steady-state diffusion equation. This was done within the pore network of 3D NMC-based electrode geometries reconstructed from X-ray computed tomography data for the active material phase and mathematically generated carbon/binder domains in the empty spaces of the macrostructures. The two bounds correspond to two different arrangements of the carbon/binder domains [28]. The lower bound corresponds to a film-like morphology where the carbon/binder phase is preferentially layered at the NMC cluster surface, while the higher bound corresponds to a finger-like morphology where the carbon/binder domains are more protruding into the porosity. In this previous work the NMC-based electrode porosities ranged between 32 and 52 % and the CB/PVdF contents were 5+5 wt%. The electrodes studied here have lower porosity, lower CB/PVdF contents (sum is less than 5 wt%) and more complex microstructure due to NMC cluster fragmentation. We can see that the tortuosity factors determined here are mostly averaging the upper and lower bounds from Usseglio-Viretta et al except for NA7b which matches the upper bound. The NMC cluster fragmentation produces a porosity obstruction comparable to the finger-like carbon-binder domain morphology taken into account by Usseglio-Viretta et al [28],
ex-plaining the very good agreement between our results and theirs despite the difference in CB/PVdF content.
Thorat et al. [16] and Zacharias et al. [17] established modified Bruggeman-type functions for LiFePO4
- and LiCO2 - based electrodes for the porosity dependence of the tortuosity factor, which are reproduced
in Figure 5b. The LiFePO4 based electrodes contained 4 % carbon and 4 % PVdF by weight, and their
porosity range was 30-55 %. The LiCoO2 based electrodes contained 7.8 % carbon and 7.8 % PVdF by
weight, and their porosity range was 32-50 %. These results were obtained by measuring electrode-film tortuosity in terms of effective diffusivity. A more recent work by Pouraghajan et al. [20] found a reasonable agreement between this method and other methods that uses impedance spectroscopy to measure the effec-tive ionic [7, 19]. Figure 5b shows a good agreement between our simulations and relationships of Thorat and Zacharias [16, 17], except for NA7b likely for the same reasons that are mentioned above. We must note that we extrapolated their results in the porosity-range that corresponds to our electrodes. In addition, the electrode microstructures studied in these works is different due to a difference in the geometry of the active material particles. Also, the good agreement between our results and those of Zacharias et al. [17] and Thorat et al. [16] is to be put into perspective. Nevertheless, altogether this suggests the Fourier based method with the simple ohm’s law can give a fair prediction of the microstructure influence on the effective ionic conductivity and tortuosity.
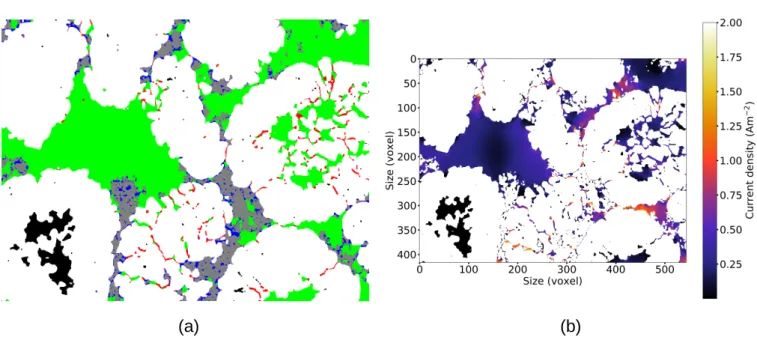
Furthermore, in our electrodes we could identify several porosity types [48]: (i) one made of large micro-metric cavities within the NMC cluster pack; (ii) one occluded in non-fragmented hollow NMC clusters; (iii) one made of nanometric pores defined by the PVdF/CB mixture morphology and (iv) one due the cracked grain boundaries within fragmented NMC clusters. Quantitatively, the micrometric porosity was defined as pore spaces wider than 60 nm. As a matter of illustration, these different porosities are identified in a 2D slice taken in the NA2b volume in Figure 6a.
Figure 6b provides a current density map within the porosity phase at the same location. The poten-tial difference is applied perpendicularly to this 2D slice. It can be noted that the current density is zero in the occluded porosities, see at the bottom left for example (around coordinates (150, 350)), which are thus useless. Some micrometric porosity areas are crossed by a low current density, less than 0.2 Am−2 Examples are the inside of fragmented NMC clusters. These regions can be dead ends or only accessible through nanopores as those formed by the NMC cluster fragmentation as in middle right (around coordi-nates (450, 200)). Figure 6b also shows that some other parts of micrometric porosity areas can be crossed by a low current density, typically less than 0.02 Am−2, such as in the middle left (coordinates (150, 200)).
Figure S2 shows a set of parallel slices to the one shown in Figure 6b, each spaced by 1 µm. It can be seen there that upstream from the middle left region (coordinates (150, 200)) there is an NMC cluster (Figure S2a). The current density is therefore very low in the central part of the porosity just after this cluster because the current lines must bypass it [67]. Such micrometric porosity areas thus poorly contribute to carry the ion flux throughout the electrode. On the contrary, other micrometric porosity zones, which are rather small, are crossed by a very high current density, greater than 1 Am−2. Such zones are localised at interstices at the vicinity of contact areas between NMC clusters. These zones, such as the one in the upper right (coordinates (400, 50)), connect to others of larger dimension situated upstream or on either side and thus act as a linking bottleneck. It can be seen on Figure S2a that on the section situated upstream of the zone in the upper right (coordinates (400, 50)) there is a zone of larger porosity which then converges into a zone of lower porosity. These observations reveal the complex microstructure influence on ionic transport. We can add that the simulation carried out here does not take into account interface effects which could be very influential insofar as high current density areas are narrow. The simulation also does not take into account ion accumulation nor depletion, upstream and downstream of the bottlenecks, which can modify the electrolyte local conductivity.
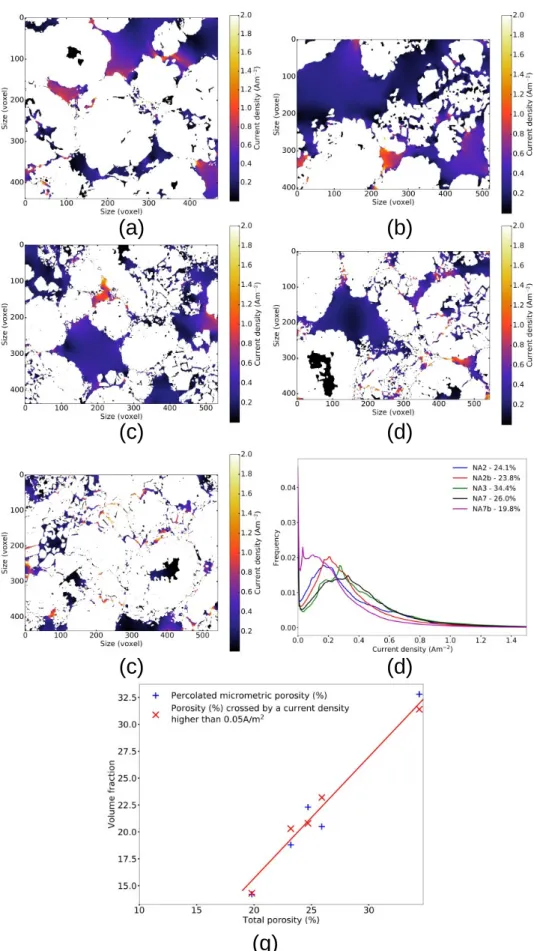
Figure 7a-e provides a comparison between current density maps, within the porosity phase, in 2D slices from the different electrode volumes. The current density distributions are also reported in Figure 7f. A comparison can be drawn between the most and the least porous of these microstructures, namely NA3 and NA7b. Current density distribution is centred towards low values for NA7b, in relation with its low effective ionic conductivity, but extends in the domain of the high current densities. These correspond to areas of strong current constriction on the map. This also shows that a part of the porosity is not crossed by the current. This porosity fraction not crossed by the current is remarkable on its distribution by the high value of the ordinate at the curve origin. By arbitrarily defining these “dead areas” as regions with current density values under 0.05 Am−2, it comes that they represent 8.8 % (NA3) to 27.6 % (NA7b) of the porosity phase. This larger “dead area” fraction in NA7b is the consequence of the low total porosity in this electrode, the NMC cluster strong fragmentation and the high CB/PVdF content, which significantly reduce the micrometric porosity fraction and create numerous bottlenecks and dead ends that form many barriers and obstacles to ion transport. Consequently, the effective porosity, which participates in the carrying of the ion current is lower than the total porosity. Comparatively, the current density, in the porosity phase, is more homogeneous and centred towards high values for NA3 which is more open and thus more fully utilised. Some “dead areas” can also be observed in the other volumes, particularly NA7 and NA2b (Figure 7c and d), near closed pores or very fragmented NMC clusters (representing respectively 15.7 %, 10.5 % and
12.5 % of the total porosity phase for NA2, NA7, NA2b). These “dead areas” illustrate the existence of a non-used micrometric porosity because isolated from the main network by confined porosities or imposed downstream of the NMC clusters due to the current lines having to bypass them. Figure S3 shows other slices with “dead areas” in volume NA7b. Figure 7g gives the percolated microporosity and the porosity crossed by a current density higher than 0.05 Am−2 as a function of the total porosity of the FIB/SEM volumes. As mentioned previously [48], the percolated micrometric porosity varies linearly with the total porosity. Moreover, it can be seen that the presence of “dead areas” clearly increases when there is less percolated micrometric porosity. Indeed, the amount of porosity that is crossed by a current density higher than 0.05 Am−2matches the amount of percolated micrometric porosity. This indicates that ionic transport is dominated by low tortuosity micrometric channels through the electrode.
This conclusion is in agreement with the modelling work of Lagadec et al. on battery separators which shows that dead ends in a pore network are ineffective for the homogenisation of a large salt concentration of lithium through the separator [68]. It is also in agreement with the experimental observations by Roberts et al. on LiFePO4-based electrodes that lithiation follows preferential pathways along the percolation of
large porosities [1]. However, Nguyen et al. simulations on virtual microstructures suggest that dead ends in a pore network might play a crucial role in the performance of real electrodes [38].
5
RVE size estimations
The same methodology as in [53] is here used to assess the FIB/SEM volume representativeness regarding electronic conductivity. The calculations were made for a non percolated microstructure (NA3) and a per-colated one (NA2b). With a relative error of 10 % we obtained a Representative Volume Element (RVE) size around 200×200×200 µm3 for the non percolated state and 30×30×30 µm3 for the percolated state.
In a non percolated state, RVE is coherent with the RVE size recently determined for NMC electrode [69]. This dimension is far superior to our electrode thicknesses which means that to capture correctly the electrode behaviour we should acquire, the whole electrode thickness in a 200×200 µm2 area with enough resolution to discriminate the CB/PVdF phase. This is clearly not feasible with a galium FIB nowadays. However, our results show a good concordance with experimental ones. This could indicate that, despite the RVE size, we are able to catch a CB/PVdF distribution and morphology that is representative enough while the overall microstructure is not.
In percolated electrodes, the RVE size decreases drastically to a 30 µm side which is not so far from our FIB/SEM volume dimensions.
We can the conclude that the CB/PVdF morphology greatly influence the RVE size for effective elec-tronic conductivity. In non percolated electrode the NMC skeleton has more influence than the CB/PVdF one and the RVE size grows to match the one in [69] which is established for the electrode mechanical properties that are naturally more dependent on the NMC phase than on the CB/PVdF one. As for the percolated electrodes, electrons will stream through the CB/PVdF mixture. The RVE size drop should then indicate that it has a characteristic morphology acquirable in smaller volumes and that the NMC skeleton will not play a major role in electron conduction.
The RVE size related to ionic conductivity was also estimated using the same volumes; i.e. NA3 with a broad porosity network and NA2b which has a more tortuous one due to its increased content in CB/PVdF. The RVE size was found to be around 15 µm wide which is close to our FIB/SEM volumes and thus sug-gests that the micrometric porosity network is captured well enough at that scale to be representative of the overall ionic diffusion in the electrode. In electrodes containing a more constrained porosity such as NA2b, the RVE size was also found around 15 µm. It can be interpreted as that the more constrained nature of the porous network does not impact much the micrometric porosity representative length scale due to its still large intraconnectivity.
Final verification of such assertions should however be made through the acquisition of microstructural volumes at these dimensions, same resolution and discriminating all the phases.
6
Conclusion
Effective electronic and ionic conductivity estimations for EV designed electrodes based on NMC532
com-posite positive electrodes were conducted using a Fourier based method and actual microstructure volumes acquired by FIB/SEM nanotomography.
For electronic conductivity, simulations were first performed on NMC only 3D microstructures to infer this phase conductivity using macroscopic experimental results. This led to an apparent phase conductivity for the NMC stacking that gathers the NMC clusters bulk conductivity together with their resistive contact interfaces. The NMC phase is indeed seen as an homogeneous one in the segmented FIB/SEM volumes. By
coupling this value to the CB/PVdF phase conductivity, effective electronic conductivities were computed in the FIB/SEM volumes and successfully compared to experimental results. The current density fields show that the NMC phase is only solicited when the CB/PVdF is lacking, which is more likely to happen in a non-percolated microstructure. However, even in that apparently more detrimental case, there is still a benefice from the presence of CB/PVdF aggregates that allow the current to bypass the constrictive junc-tions between the NMC clusters. The segmented microstructures were also numerically modified to mimic composition changes in the CB/PVdF amount. A percolation threshold was thus numerically evidenced for a CB/PVdF volume fraction around 6 to 7 %.
Predictions were also conducted regarding the effective ionic conductivity. A good agreement was found with one experimental measurement. Moreover, the tortuosity factor values deduced form the simulation results are also in good agreement with previous experimental and simulation works for other positive elec-trodes. Overall, the ionic conductivity appears to mostly rely on the percolated micrometric porosity. The current density fields show the presence of “dead areas” in that micrometric porosity due to accessibility issues caused by more confined porosities.
An RVE size estimation was conducted regarding both electronic and ionic conductivities. The elec-tronic RVE size drops from a 200 µm side to a 30 µm side when the CB/PVdF is percolated. On the contrary RVE size related to ionic conductivity was found around a 15 µm side in both electrode types indicating that the micrometric porous network is captured well enough at that length scale despite dif-ferences in pore constrictions. Comparison with experimental results are nonetheless satisfying showing that we captured representatively enough microstructures, especially when it comes to the CB/PVdF phase. Volumes should however be acquired at these dimensions and resolution to definitely confirm this hypothesis.
Acknowledgement
We are grateful to the Agence Nationale de la Recherche to the funding of the Pepite project (ANR-15-CE05-0001) and for Zeon’s support during the project.
Additional information
The software used to perform the FFT numerical simulations is called Morphhom and is available upon reasonable request to François Willlot ([email protected])
Table 1: Electrode comparison in volumes, thickness and density from manufacturer data
Name Volume fraction (%) Mass fraction (%) Thickness (µm) Density (g/cm3)
NMC PVdF/CB Porosity NMC PVdF CB NA2 64.8 7.2 28 96 1.8 2.2 81.4 3.2 NA3 64.8 7.2 28 96 1.8 2.2 48.8 3.2 NA7 70.9 7.9 21.2 96 1.8 2.2 74.4 3.5 NA2b 63.6 10.4 26.0 94.2 2.6 3.2 81.4 3.2 NA7b 69.6 11.3 19.1 94.2 2.6 3.2 74.4 3.5
Table 2: Comparison between phase volume fractions measured from FIB/SEM and from manufacturer data. Name Volume fraction (%) Density (gcm−3) NMC CB/PVdF Porosity FIB/SEM Relative variation∗ (%) FIB/SEM Relative variation∗ (%) FIB/SEM Relative variation∗ (%) NA2 70.4 ±0.1 9 4.6 ±0.2 -35 ±2 24.9 ±0.3 -10 ±2 3.4 NA3 61 ±0.1 -6 4.1 ±0.6 -43 ±7 35 ±0.6 25 ±2 3.0 NA7 68.8 ±0.3 -3 4.6 ±0.3 -41 ±5 26.5 ±0.7 25 ±3 3.4 NA2b 68.4 ±0.2 8 8 ±0.4 -24 ±4 23.7 ±0.5 -9 ±2 3.4 NA7b 72.4 ±0.1 4.0 7.6 ±0.3 -32 ±2 20.1 ±0.4 5 ±2 3.6
∗ Relative to manufacturer data
Figure 1: (a) Example of NA0 like volume, NMC is in white and porosity is left transparent (from NA2-0 data after CB/PVdF phase removal). (b) 2D maps of the current density field extracted from the 3D Fourier based simulation results.
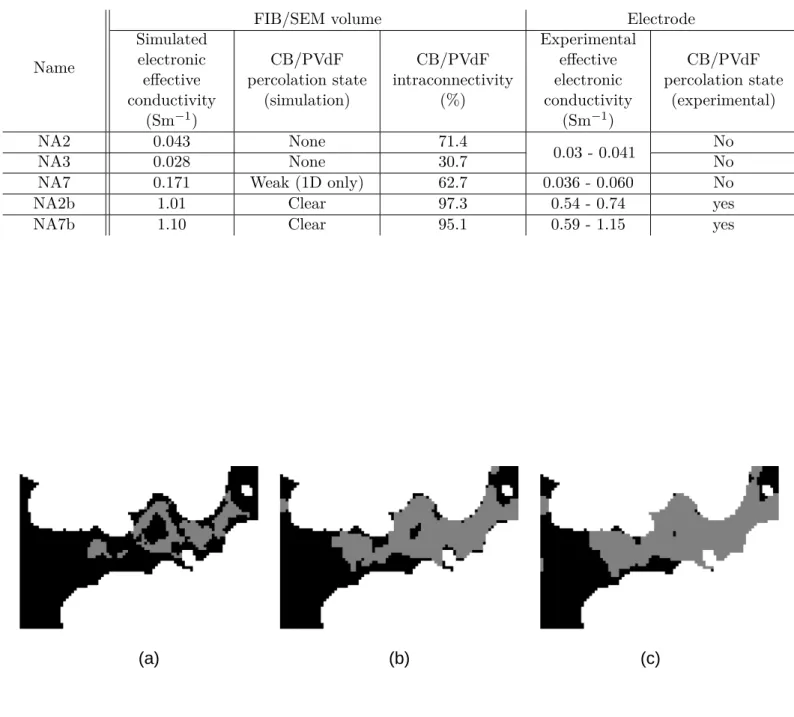
Table 3: Effective electronic conductivity estimates using Fourier based simulation on FIB/SEM volumes. Phase conductivities for NMC and CB/PVdF phases are respectively 0.0057 Sm−1 et 350 Sm−1. CB/PVdF percolation state in the simulation volumes is also mentioned as well as its intraconnectivity and the experi-mental effective conductivity associated to each sample. The electrode experiexperi-mental effective conductivities were measured by BDS and the percolation state of the CB/PVdF mixture was identified from the activation energy of the experimental effective conductivity [70].
Name
FIB/SEM volume Electrode
Simulated electronic effective conductivity (Sm−1) CB/PVdF percolation state (simulation) CB/PVdF intraconnectivity (%) Experimental effective electronic conductivity (Sm−1) CB/PVdF percolation state (experimental) NA2 0.043 None 71.4 0.03 - 0.041 No NA3 0.028 None 30.7 No
NA7 0.171 Weak (1D only) 62.7 0.036 - 0.060 No
NA2b 1.01 Clear 97.3 0.54 - 0.74 yes
NA7b 1.10 Clear 95.1 0.59 - 1.15 yes
Figure 2: Example of CB/PVdF volume fraction modification in FIB/SEM volumes. White is the NMC phase, black is porosity and grey CB/PVdF. (a) CB/PVdF phase erosion, contacts with NMC remain, (b) initial microstructure, (c) CB/PVdF phase dilatation. These subplots are focusing on how interfaces between CB/PVdF and NMC are affected by the procedure. Images are from NA2b volume: (a) after erosion (2.7 % of CB/PVdF) ; (b) initial volume (8.2 % of CB/PVdF) and (c) after dilatation (red11.2 % of CB/PVdF).
Figure 3: Effective conductivity evolution from FIB/SEM volume modification on the CB/PVdF phase. Each first point on a dilation plot is for the raw (unmodified) FIB/SEM volume, except for NA2b and NA7b where it is notified by a plain dot.
Table 4: Effective ionic conductivity values from Fourier based simulations carried out considering the total FIB/SEM volumes porosities and tortuosity factor calculated with equation 4 for σ0 = 1 Sm−1 and σef f from Fourier based simulations. The intraconnected micrometric porosity was determined in [48].
Name Total porosity (%) Intraconnected micrometric porosity (%) Effective ionic conductivity (Sm−1) Tortuosity factor NA2 24.7 22.3 0,061 3.1 NA3 34.4 32.8 0,110 3.4 NA7 25.9 20.5 0,076 4.0 NA2b 23.2 18.8 0,056 4.1 NA7b 19.8 14.2 0,032 6.2
Figure 4: Illustration of the differences in current densities between a non percolated electrode (NA3) and a percolated electrode (NA7b). (a) and (b) are extracted from current density fields in NMC and CB/PVdF phases at the same slice in NA3. (c) and (d) are similar to (a) and (b) for NA7b respectively for NMC and CB/PVdF. (e) Current density histogram comparison within the NMC phase for NA3 and NA7b. Histograms are zoomed on the population main variation window.
Figure 5: (a) Ionic effective conductivity evolution from Fourier based simulations and computed from Archie’s law (cf. equations 4 and 3) as a function of porosity, the experimental value corresponds to a NMC532/PVdF 95:5 (%m) pellet. (b) Tortuosity factor comparison between values from Fourier based
simulations and bounds determined in [28]
Figure 6: Comparison between (a) the microstructure with different porosity types (white is NMC, grey is CB/PVdF, green is (i), black (ii), blue (iii) and red (iv)) and (b) the corresponding current density map (simulation) in identical 2D slices from NA2b FIB/SEM volume.
Figure 7: Illustration of the differences in current density (2D slices) between FIB/SEM volumes from simulations and current density histogram comparison over the whole volumes. (a) NA2, (b) NA3, (c) NA7, (d) NA2b, (e) NA7b, (f) histogram. White is NMC and CB/PVdF phases in the 2D slices. (g) compares the percolated micrometric porosity to the one crossed by a current density higher than 0.05 Am−2 (red line is a linear interpolation) as a function of the total porosity.
References
[1] D. Robert, T. Douillard, A. Boulineau, G. Brunetti, P. Nowakowski, D. Venet, P. Bayle-Guillemaud, and C. Cayron, “Multiscale phase mapping of LiFePO4-based electrodes by trans-mission electron microscopy and electron forward scattering diffraction,” ACS Nano, 7, 10887 (2013).
[2] M. Katayama, K. Sumiwaka, R. Miyahara, H. Yamashige, H. Arai, Y. Uchimoto, T. Ohta, Y. Inada, and Z. Ogumi, “X-ray absorption fine structure imaging of inhomogeneous electrode reaction in LiFePO4 lithium-ion battery cathode,” Journal of Power Sources, 269, 994 (2014).
[3] X. Zhang, T. Verhallen, F. Labohm, and M. Wagemaker, “Direct observation of li-ion transport in electrodes under nonequilibrium conditions using neutron depth profiling,” Advanced Energy Materials, 5, 1500498 (2015).
[4] Y. Orikasa, Y. Gogyo, H. Yamashige, M. Katayama, K. Chen, T. Mori, K. Yamamoto, T. Masese, T. Masese, Y. Inada, T. Ohta, Z. Siroma, S. Kato, H. Kinoshita, H. Arai, Z. Ogumi, and Y. Uchimoto, “Ionic conduction in lithium ion battery composite electrode governs cross-sectional reaction distribution,” Scientific reports, 6, 26382 (2016).
[5] H. Liu, S. Kazemiabnavi, A. Grenier, G. Vaughan, M. Di Michiel, B. J. Polzin, K. Thornton, K. W. Chapman, and P. J. Chupas, “Quantifying reaction and rate heterogeneity in bat-tery electrodes in 3d through operando x-ray diffraction computed tomography,” ACS Applied Materials & Interfaces, 11, 18386 (2019).
[6] A. M. Grillet, T. Humplik, E. K. Stirrup, S. A. Roberts, D. A. Barringer, C. M. Snyder, M. R. Janvrin, and C. A. Apblett, “Conductivity degradation of polyvinylidene fluoride composite binder during cycling: measurements and simulations for lithium-ion batteries,” Journal of the Electrochemical Society, 163, A1859 (2016).
[7] N. Ogihara, Y. Itou, T. Sasaki, and Y. Takeuchi, “Impedance spectroscopy characteriza-tion of porous electrodes under different electrode thickness using a symmetric cell for high-performance lithium-ion batteries,” The Journal of Physical Chemistry C, 119, 4612 (2015).
[8] N. Besnard, A. Etiemble, T. Douillard, O. Dubrunfaut, P. Tran-Van, L. Gautier, S. Franger, J.-C. Badot, E. Maire, and B. Lestriez, “Multiscale morphological and electrical characteriza-tion of charge transport limitacharacteriza-tions to the power performance of positive electrode blends for lithium-ion batteries,” Advanced Energy Materials, 7, 1602239 (2017).
[9] M. Doyle, T. F. Fuller, and J. Newman, “Modeling of galvanostatic charge and discharge of the lithium/polymer/insertion cell,” Journal of the Electrochemical Society, 140, 6 (1993).
[10] T. F. Fuller, M. Doyle, and J. Newman, “Simulation and optimization of the dual lithium ion insertion cell,” Journal of the Electrochemical Society, 141, 1 (1994).
[11] K. Higa, S.-L. Wu, D. Y. Parkinson, Y. Fu, S. Ferreira, V. Battaglia, and V. Srinivasan, “Comparing macroscale and microscale simulations of porous battery electrodes,” Journal of The Electrochemical Society, 164, E3473, (2017).
[12] J.-C. Badot, E. Ligneel, O. Dubrunfaut, D. Guyomard, and B. Lestriez, “A multiscale descrip-tion of the electronic transport within the hierarchical architecture of a composite electrode for lithium batteries,” Advanced Functional Materials, 19, 2749 (2009).
[13] K. A. Seid, J.-C. Badot, O. Dubrunfaut, S. Levasseur, D. Guyomard, and B. Lestriez, “Mul-tiscale electronic transport mechanism and true conductivities in amorphous carbon-LiFePO4
nanocomposites,” Journal of Materials Chemistry, 22, 2641 (2012).
[14] K. A. Seid, J. C. Badot, O. Dubrunfaut, M. T. Caldes, N. Stephant, L. Gautier, D. Guy-omard, and B. Lestriez, “Multiscale electronic transport in Li1+xNi1/3−uCo1/3−vMn1/3−wO2:
a broadband dielectric study from 40 Hz to 10 GHz,” Physical Chemistry Chemical Physics, 15, 19790 (2013).
[15] J.-C. Badot, B. Lestriez, and O. Dubrunfaut, “Interest in broadband dielectric spectroscopy to study the electronic transport in materials for lithium batteries,” Materials Science and Engineering: B, 213, 190 (2016).
[16] I. V. Thorat, D. E. Stephenson, N. A. Zacharias, K. Zaghib, J. N. Harb, and D. R. Wheeler, “Quantifying tortuosity in porous li-ion battery materials,” Journal of Power Sources, 188, 592 (2009).
[17] N. A. Zacharias, D. R. Nevers, C. Skelton, K. Knackstedt, D. E. Stephenson, and D. R. Wheeler, “Direct measurements of effective ionic transport in porous Li-ion electrodes,” Jour-nal of The Electrochemical Society, 160, A306 (2012).
[18] K.-A. Seid, J.-C. Badot, C. Perca, O. Dubrunfaut, P. Soudan, D. Guyomard, and B. Lestriez, “An in situ multiscale study of ion and electron motion in a lithium-ion battery composite electrode,” Advanced Energy Materials, 5, 1400903 (2015).
[19] J. Landesfeind, J. Hattendorff, A. Ehrl, W. Wall, and H. Gasteiger, “Tortuosity determination of battery electrodes and separators by impedance spectroscopy,” Journal of the Electrochem-ical Society, 163, A1373 (2016).
[20] F. Pouraghajan, H. Knight, M. Wray, R. Subbaraman, J. Christensen, and D. Wheeler, “Quan-tifying tortuosity of porous li-ion battery electrodes: Comparing polarization-interrupt and blocking-electrolyte methods,” Journal of The Electrochemical Society, 165, A2644 (2018).
[21] D. E. Stephenson, B. C. Walker, C. B. Skelton, E. P. Gorzkowski, D. J. Rowenhorst, and D. R. Wheeler, “Modeling 3d microstructure and ion transport in porous li-ion battery electrodes,” Journal of The Electrochemical Society, 158, A781 (2011).
[22] G. Inoue and M. Kawase, “Numerical and experimental evaluation of the relationship be-tween porous electrode structure and effective conductivity of ions and electrons in lithium-ion batteries,” Journal of Power Sources, 342, 476 (2017).
[23] Y.-H. Chen, C.-W. Wang, G. Liu, X.-Y. Song, V. S. Battaglia, and A. M. Sastry, “Selection of conductive additives in Li-ion battery cathodes,” Journal of The Electrochemical Society, 154, A978 (2007).
[24] A. Awarke, S. Lauer, S. Pischinger, and M. Wittler, “Percolation–tunneling modeling for the study of the electric conductivity in LiFePO4 based Li-ion battery cathodes,” Journal of Power Sources, 196, 405 (2011).
[25] T. Hutzenlaub, S. Thiele, N. Paust, R. Spotnitz, R. Zengerle, and C. Walchshofer, “Three-dimensional electrochemical Li-ion battery modelling featuring a focused ion-beam/scanning electron microscopy based three-phase reconstruction of a LiCoO2 cathode,” Electrochimica
Acta, 115, 131 (2014).
[26] H. Mendoza, S. Roberts, V. Brunini, and A. Grillet, “Mechanical and electrochemical response of a LiCoO2 cathode using reconstructed microstructures,” Electrochimica Acta, 190, 1 (2016).
[27] L. Zielke, T. Hutzenlaub, D. R. Wheeler, C.-W. Chao, I. Manke, A. Hilger, N. Paust, R. Zengerle, and S. Thiele, “Three-phase multiscale modeling of a LiCoO2cathode: Combining
the advantages of FIB–SEM imaging and X-ray tomography,” Advanced Energy Materials, 5, 1401612 (2015).
[28] F. L. E. Usseglio-Viretta, A. Colclasure, A. N. Mistry, K. P. Y. Claver, F. Pouraghajan, D. P. Finegan, T. M. M. Heenan, D. Abraham, P. P. Mukherjee, D. Wheeler, P. Shearing,
S. J. Cooper, and K. Smith, “Resolving the discrepancy in tortuosity factor estimation for Li-ion battery electrodes through micro-macro modeling and experiment,” Journal of The Electrochemical Society, 165, A3403 (2018).
[29] C. Wieser, T. Prill, and K. Schladitz, “Multiscale simulation process and application to addi-tives in porous composite battery electrodes,” Journal of Power Sources,277,64 (2015).
[30] B. L. Trembacki, A. N. Mistry, D. R. Noble, M. E. Ferraro, P. P. Mukherjee, and S. A. Roberts, “Editors— choice—mesoscale analysis of conductive binder domain morphology in lithium-ion battery electrodes,” Journal of The Electrochemical Society, 165, E725 (2018).
[31] M. E. Ferraro, B. L. Trembacki, V. E. Brunini, D. R. Noble, and S. A. Roberts, “Electrode mesoscale as a collection of particles: Coupled electrochemical and mechanical analysis of NMC cathodes,” Journal of The Electrochemical Society, 167, 013543 (2020).
[32] A. N. Mistry, K. Smith, and P. P. Mukherjee, “Secondary-phase stochastics in lithium-ion battery electrodes,” ACS Applied Materials Interfaces, 10, 6317 (2018).
[33] V. Laue, F. Röder, and U. Krewer, “Joint structural and electrochemical modeling: Impact of porosity on lithium-ion battery performance,” Electrochimica Acta, 314, 20 (2019).
[34] A. C. Ngandjong, A. Rucci, M. Maiza, G. Shukla, J. Vazquez-Arenas, and A. A. Franco, “Multiscale simulation platform linking lithium ion battery electrode fabrication process with performance at the cell level,” Journal of Physical Chemistry Letters, 8, 5966 (2017).
[35] M. Neumann, B. Abdallah, L. Holzer, F. Willot, and V. Schmidt, “Stochastic 3D modeling of three-phase microstructures for the prediction of transport properties in solid oxide fuel cells,” Transport in Porous Media, 128, 179, 2019.
[36] G. Gaiselmann, M. Neumann, V. Schmidt, O. Pecho, T. Hocker, and L. Holzer, “Quantita-tive relationships between microstructure and effec“Quantita-tive transport properties based on virtual materials testing,” AIChE Journal, 60, 1983, 2014.
[37] B. Abdallah, F. Willot, and D. Jeulin, “Morphological modeling of three-phase microstructures of anode layers using SEM images,” Journal of Microscopy, 263, 51, 2016.
[38] T.-T. Nguyen, A. Demortière, B. Fleutot, B. Delobel, C. Delacourt, and S. J. Cooper, “The electrode tortuosity factor: why the conventional tortuosity factor is not well suited for quanti-fying transport in porous li-ion battery electrodes and what to use instead,” npj Computational Materials, 6, 1, 2020.
[39] M. Geers and J. Yvonnet, “Multiscale modeling of microstructure-property relations,” MRS Bulletin, 41, 610, 2016.
[40] B. Tjaden, D. J. L. Brett, and P. R. Shearing, “Tortuosity in electrochemical devices: a review of calculation approaches,” International Materials Reviews, 63, 47 (2018).
[41] L. Wu, X. Xiao, Y. Wen, and J. Zhang, “Three-dimensional finite element study on stress generation in synchrotron x-ray tomography reconstructed nickel-manganese-cobalt based half cell,” Journal of Power Sources, vol. 336, 12 2016.
[42] T. Danner, M. Singh, S. Hein, J. Kaiser, H. Hahn, and A. Latz, “Thick electrodes for Li-ion batteries: A model based analysis,” Journal of Power Sources, 334, 191 (2016).
[43] S. J. Harris, A. Timmons, D. R. Baker, and C. Monroe, “Direct in situ measurements of Li transport in Li-ion battery negative electrodes,” Chemical Physics Letters, 485, 265 (2010).
[44] J. Liu, M. Kunz, K. Chen, N. Tamura, and T. J. Richardson, “Visualization of charge dis-tribution in a lithium battery electrode,” The Journal of Physical Chemistry Letters, 1, 2120 (2010).
[45] M. R. Roberts, A. Madsen, C. Nicklin, J. Rawle, M. G. Palmer, J. R. Owen, and A. L. Hector, “Direct observation of active material concentration gradients and crystallinity breakdown in LiFePO4 electrodes during charge/discharge cycling of lithium batteries,” The Journal of Physical Chemistry C, 118, 6548 (2014).
[46] K. Kitada, H. Murayama, K. Fukuda, H. Arai, Y. Uchimoto, Z. Ogumi, and E. Matsubara, “Factors determining the packing-limitation of active materials in the composite electrode of lithium-ion batteries,” Journal of Power Sources, 301,11 (2016).
[47] T. Nakamura, T. Watanabe, Y. Kimura, K. Amezawa, K. Nitta, H. Tanida, K. Ohara, Y. Uchi-moto, and Z. Ogumi, “Visualization of inhomogeneous reaction distribution in the model LiCoO2 composite electrode of lithium ion batteries,” The Journal of Physical Chemistry C, 121, 2118 (2017).
[48] F. Cadiou, T. Douillard, N. Besnard, B. Lestriez, and E. Maire, “Multiscale characterisation of composite electrode microstructures for high density lithium-ion batteries guided by the specificities of their electronic and ionic transport mechanisms,” Journal of the Electrochemical Society, (2020).
[49] H. Moulinec and P. Suquet, “A fast numerical method for computing the linear and nonlin-ear properties of composites,” Comptes Rendus de l’Académies des Sciences Paris, 318, 1417 (1994).
[50] E. Kröner, Statistical continuum mechanics. No. 92, Springer (1972).
[51] F. Willot, B. Abdallah, and Y.-P. Pellegrini, “Fourier-based schemes with modified Green operator for computing the electrical response of heterogeneous media with accurate local fields,” International Journal for Numerical Methods in Engineering, 98, 518 (2014).
[52] D. J. Eyre and G. W. Milton, “A fast numerical scheme for computing the response of com-posites using grid refinement,” The European Physical Journal Applied Physics, 6, 41 (1999).
[53] F. Cadiou, A. Etiemble, T. Douillard, F. Willot, O. Valentin, J.-C. Badot, B. Lestriez, and E. Maire, “Numerical prediction of multiscale electronic conductivity of lithium-ion battery positive electrodes,” Journal of The Electrochemical Society, 166, A1692 (2019).
[54] J. Zeman, T. W. J. de Geus, J. Vondřejc, R. H. J. Peerlings, and M. G. D. Geers, “A fi-nite element perspective on nonlinear FFT-based micromechanical simulations,” International Journal for Numerical Methods in Engineering, 111, 903 (2017).
[55] M. Schneider, “An FFT-based fast gradient method for elastic and inelastic unit cell ho-mogenization problems,” Computer Methods in Applied Mechanics and Engineering, 315, 846 (2017).
[56] M. Schneider, D. Merkert, and M. Kabel, “FFT-based homogenization for microstructures discretized by linear hexahedral elements,” International Journal for Numerical Methods in Engineering, 109, 1461 (2017).
[57] J. Vondřejc and T. W. J. de Geus, “Energy-based comparison between the Fourier–Galerkin method and the finite element method,” Journal of Computational and Applied Mathematics, 374, 112585 (2020).
[58] M. Schneider, “On the barzilai-borwein basic scheme in FFT-based computational homoge-nization,” International Journal for Numerical Methods in Engineering, 118, 482 (2019).
[59] J. Gasnier, F. Willot, H. Trumel, D. Jeulin, and J. Besson, “Thermoelastic properties of micro-cracked polycrystals. Part I: Adequacy of Fourier-based methods for micro-cracked elastic bodies,” International Journal of Solids and Structures, 155, 248 (2018).
[60] A. Gully, H. Liu, S. Srinivasan, A. K. Sethurajan, S. Schougaard, and B. Protas, “Effec-tive transport properties of porous electrochemical materials — A homogenization approach,” Journal of The Electrochemical Society, 161, E3066 (2014).
[61] J. C. Badot, V. Bianchi, N. Baffier, and N. Belhadj-Tahar, “Dielectric and conductivity spec-troscopy of Li1−xNi1+xO2 in the range of 10-1010 Hz: polaron hopping,” Journal of Physics:
Condensed Matter, 14, 6917 (2002).
[62] H. Zheng, R. Yang, G. Liu, X. Song, and V. S. Battaglia, “Cooperation between active material, polymeric binder and conductive carbon additive in lithium ion battery cathode,” The Journal of Physical Chemistry C, 116, 4875 (2012).
[63] D. Guy, B. Lestriez, R. Bouchet, and D. Guyomard, “Critical role of polymeric binders on the electronic transport properties of composites electrode,” Journal of The Electrochemical Society, 153, A679 (2006).
[64] E. Panabière, J.-C. Badot, O. Dubrunfaut, A. Etiemble, and B. Lestriez, “Electronic and ionic dynamics coupled at solid–liquid electrolyte interfaces in porous nanocomposites of carbon black, poly(vinylidene fluoride), and gamma-alumina,” The Journal of Physical Chemistry C, 121, 8364 (2017).
[65] P. W. J. Glover, “A generalized Archie’s law for n phases,” GEOPHYSICS, 75, E247 (2010). [66] N. Epstein, “On tortuosity and the tortuosity factor in flow and diffusion through porous
media,” Chemical Engineering Science, 44, 777, 1989.
[67] N. Besnard, Etude des propriétés de transport des charges aux différentes échelles d’une élec-trode de batterie lithium-ion et de leurs influences sur les performances en puissance pour l’application véhicule électrique. PhD thesis, Université de Nantes, May 2016.
[68] M. F. Lagadec, R. Zahn, S. Müller, and V. Wood, “Topological and network analysis of lithium ion battery components: the importance of pore space connectivity for cell operation,” Energy & Environmental Science, 11, 3194 (2018).
[69] C. Sangrós Giménez, B. Finke, C. Schilde, L. Froböse, and A. Kwade, “Numerical simulation of the behavior of lithium-ion battery electrodes during the calendaring process via the discrete element method,” Powder Technology, 349, 1 (2019).
[70] A. Agrawal, Multiscale architectural characterisation of composite Li-ion electrodes using Broadband Dielectric Spectroscopy. PhD thesis, Universités Paris Sud, Paris Saclay, 2021.