HAL Id: hal-00876428
https://hal.archives-ouvertes.fr/hal-00876428
Submitted on 24 Oct 2013
HAL is a multi-disciplinary open access
archive for the deposit and dissemination of
sci-entific research documents, whether they are
pub-lished or not. The documents may come from
teaching and research institutions in France or
abroad, or from public or private research centers.
L’archive ouverte pluridisciplinaire HAL, est
destinée au dépôt et à la diffusion de documents
scientifiques de niveau recherche, publiés ou non,
émanant des établissements d’enseignement et de
recherche français ou étrangers, des laboratoires
publics ou privés.
Flat plate for OAM generation in the millimeter band
Anass Beniss, Ronan Niemiec, Christian Brousseau, Kouroch Mahdjoubi,
Olivier Emile
To cite this version:
Anass Beniss, Ronan Niemiec, Christian Brousseau, Kouroch Mahdjoubi, Olivier Emile. Flat plate
for OAM generation in the millimeter band. EuCAP2013 - European Conference on Antennas &
Propagation, Apr 2013, Gothenburg, Sweden. pp.1. �hal-00876428�
Flat plate for OAM generation in the millimeter band
A. Bennis
1, R. Niemiec
1,2, C. Brousseau
1, K. Mahdjoubi
1, O. Emile
21 IETR – Institut d’Electronique et de Télécommunications de Rennes, UMR CNRS 6164, Université de Rennes 1, Rennes,
France
2 LPL – Laboratoire de Physique des Lasers, URU 435, Université de Rennes 1, Rennes, France
Abstract—The use of electromagnetic waves carrying orbital
angular momentum in the radio frequency range is a growing subject, and so is the design of antennas able to produce such waves. The aim of this paper is to present a new type of antenna (a flat plate) in order to generate an electromagnetic wave carrying orbital angular momentum in the millimeter frequency band.
Index Terms—orbital; angular; momentum; phaseplate; millimeter frequency band
I. INTRODUCTION
An ElectroMagnetic (EM) wave is usually defined by its magnitude, its wave vector, its frequency and its angular momentum. The latter can be decomposed in two distinct components [1]: the Spin Angular Momentum (SAM) which corresponds to the wave polarization and the Orbital Angular Momentum (OAM) which is associated to the spatial distribution of the phase of the fields. So, an EM wave carrying OAM is characterized by an azimuthal phase dependency noted
e-jl, with l being an integer value called the topological charge and corresponding to the phase rotational mode, and the azimuthal angle. Furthermore, the phase distribution leads to a destructive interference at the beam axis, and creates a vortex.
Where polarization states are limited to only two states, each l integer value is associated to an OAM mode. Thus there is theoretically an infinite number of OAM modes. Furthermore, all these modes are orthogonal to each other and independents to the wave polarization. This orthogonality has been proposed as a new possible diversity, e.g. in telecommunications, assuming the existence of dedicated suitable transmissions systems to generate these OAM modes. This idea has received recently some attention for radio communications [2-4], to create “multiple sub-channels” distinguished by the twisting degree of the EM field structure to encode information. Since, many intense debates have been conducted comparing OAM coding and MIMO techniques, and concluding that the “OAM sub-channels” is a subset of the solutions offered by MIMO [5]. At the same time, some interference tests between an OAM beam and an unknown object have been realized in the optical domain [6] to estimate rotational symmetries, opening new perspectives in radar identification in the radio frequency band.
In this paper, we present a new type of antenna aimed to generate an OAM EM wave, using a flat phase plate with a variable permittivity, at a frequency f = 30 GHz and for an OAM of order l = 1.
II. ANTENNAS GENERATING WAVES CARRYING OAM In the radio frequency bands, circular short dipole arrays have been proposed to generate OAM of order |l| < N/2, N being the number of antennas [3]. Each array element has a
2 l/N phase shift compared with its neighbor. This leads to a 2 l phase rotation around the beam axis. Others antennas have
been used to generated OAM in these bands, such as a turnstile antenna [7]. The difference in this case is that OAM lies in the plane of the turnstile antenna only, and not ahead of it. On the other hand, spiral phase plates have been used in optics for some years, and more recently in the 100 GHz regime [8]. The spiral surface introduces a linear phase variation along the azimuthal angle , depending on the helical thickness of the plate.
Leaving aside the theoretical aspect, the first experimental demonstration of the orthogonality of OAM modes in radio frequency and in natural environment has been reported last year [4]. Besides the confirmation that OAM can indeed be used for telecommunications, the relevant point in this article relies on the antenna the authors used to generate an EM wave carrying OAM. Starting from a regular parabolic reflector dish, they “twisted” it in order to induce the azimuthal phase distribution. This antenna is the first one ever used in a telecommunication demonstration system involving OAM.
III. FLAT PHASE PLATE WITH ANGULAR VARIATION OF THE PERMITTIVITY
A. Design of the flat phase plate
This approach we used to design this phase plate is similar to that of the spiral phase plate, in the sense that the wave is subject to a phase delay upon transmission through the phase plate. The innovation here is the use of a flat plate which induces a phase delay by an angular variation of the permittivity due to holes drilled in matter, as seen in Fig. 1, instead of being due to an angular width variation. This concept has been used for the first time for spherical lenses, using radials drilled holes [9], and then for similar spherical lenses reconstructed with stepped plate lenses [10]. Here we use only one flat plate, with a totally different hole distribution. The relation between the relative permittivity r and the
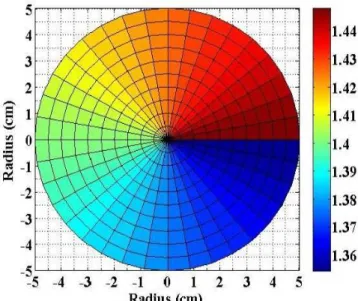
azimuthal angle is represented in Fig. 2 and defined in (1), where n is the variation of the refractive index and nm is the
refractive index of the raw material (Teflon, in our case):
r( ) = 2 n2/(2 l)2 – .nm. n/ l + nm2
This work is supported by the Université de Rennes 1, the French Ministry of Defense (DGA) and the council of Brittany (Région Bretagne).
Figure 1. Front view of the phase plate. Permittivity is controlled by drilling holes in a Teflon flat plate. Distribution of the drilled holes is a function of the
azimuthal angle .
In our case, to have an OAM topological charge |l| = 1 corresponding to a rotational phase of ±2 on the wave front, the drilled holes have to induce a refractive index varying from
1.35 to 1.45 as a function of the azimuthal angle . Equation
(2) shows the relation between the volume with the drilled holes Vh and the relative permittivity r( ) as a function of the
azimuthal angle :
Vh( ) = ( r( ) – nm2) / (1 – nm2)
The major challenge is to design a hole distribution that induces the expected variation in permittivity but that can be mechanically done.
B. Mecanichal conception of the phase plate.
As we choose to perform numerical simulations at a frequency of f = 30 GHz, this means that each drilled hole should have a diameter of the order of d = /10 = 1 mm. In our case, the plate has a radius of R = 5 = 50 mm and a length of
L = 104 mm.
Furthermore, as can be seen in Fig. 1, the number of holes is quite important, of the order of a thousand. This induces strong constraints on the raw material as it is manufactured. Another difficulty would be to have a drill with a diameter d and a length L. The problem is that an usual drill with a diameter d has a length of the order of L/10 ~ 10 mm.
To overcome this, we had to make the architecture of the flat phase plate more complex, as can be seen on Fig. 3. The flat phase plate is decomposed into smaller flat sub-plates, the hole distribution being carried on from a sub-plate to another.
To keep a comfortable safety margin, we choose to use 2 sub-plates with a length of Ls1 = 4 mm and 16 sub-plates with a
length of Ls2 = 6 mm. In principle, as long as the hole
distribution is respected the order in which these sub-plates are arranged does not matter even if the holes vary in depth, as the important thing is the volume extracted in each angular sector,
Figure 2. Refractive index as a function of the azimuthal angle .
not the continuity of each hole along the length of the flat phase plate. Nevertheless, we choose to conserve this continuity to add a visual verification (the number of holes on each sub-plate) when combining the sub-plates.
IV. RESULTS A. Numerical Simulations
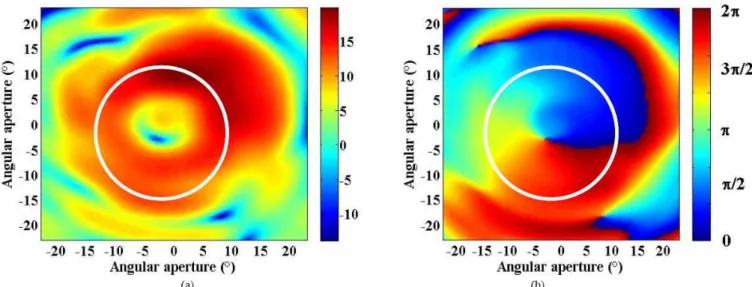
We have numerically simulated the total EM field generated by this flat phase plate, illuminated by a horn antenna. Fig. 4 presents the simulated transmitted beam in the far-field. Panel (a) on the left is a visualization of the directivity of the beam. We can see the specific “donut” shape of the intensity profile and the low intensity zone (vortex zone) around the axis of the beam. Panel (b) on the right is a visualization of the phase of the beam. As expected, we can see a well-defined rotational phase distribution from 0 to 2 , on the white circle corresponding to the maximum intensity of the EM field.
Figure 3. Side view (left) and top view (right) of the flat phase plate. The sub-plates are maintained together with the help of four nylon stick to
This simulation has been carried out for both polarization of the horn antenna in regards to the flat phase plate, for similar results. For clarity, only one set of results will be presented in this paper.
B. Comparison with other antennas
We choose to consider only the spiral lens and the “twisted” parabolic antenna arrays out of the already existing antennas in the following comparison, as the circular short dipole does not possess a single radiating element only. The first has been numerically simulated at a frequency of
f = 30 GHz and results are visible in Fig. 5. The second has
also been numerically simulated at a frequency of f = 30 GHz, but for visualization concerns (as a beam is much more focalized with a parabolic antenna) it has also been carried out at a frequency of f = 2.41 GHz (as the antenna used in [4]) for similar results which are visible in Fig. 6. In both case we can see on Panel (a), the specific “donut” shape of the intensity profile and the vortex zone around the axis of the beam, and on Panel (b), a well-defined rotational phase distribution from 0 to
2 on the white circle corresponding to the maximum intensity
of the EM field.
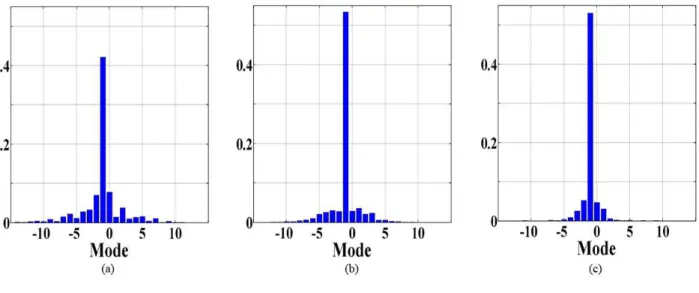
We also choose to disregard differences in directivity and to focus our attention purely on the OAM carried by the generated EM wave. But this information on the intensity of the field is still important as the information on the phase is only relevant when there is enough energy, i.e. on the “donut shape”. Thus, to compare the three antennas, we have to study the rotational phase variation on the white circle corresponding to the maximum intensity of the EM field. The criterion chosen is the mode purity of the OAM EM wave generated.
To obtain this mode purity, the phase gradient has been exploited based on the second method presented in [11]: the phase is extracted along the white circle perimeter. Mode decomposition is then obtained directly with the help of a Fourier Transform, using (3) with l being the distribution of
angular momentum and ( ) the extracted phases values [12]:
l= (1/2 ) d ( )exp(-jl )
Results for the three antennas are presented in Fig 7. The ideal case would be OAM mode with a proportion close to 1. Indeed, we can see that there is a clearly predominant OAM mode which correspond to l = -1 but with a proportion a little higher than 0.5 for the spiral lens and the “twisted” parabolic antenna and a little higher than 0.4 for the flat phase plate. This can be explained by the variation of the amplitude on the white circle as it is a constant on the ideal case. Nevertheless, we consider these results as quite good since the predominant OAM mode has a proportion 3.5 times greater than the secondary mode in the case of the flat phase lens, up to 7 in the
case of the “twisted” parabolic antenna and even 10 in the case of the spiral lens.
The intensity distribution is counterbalanced by several advantages of this plate, namely the ability to change the drilling law, and a higher versatility.
V. CONCLUSION
In this paper, we presented a new way to generate an EM wave carrying OAM in the millimeter frequency band. A flat phase plate is designed to have an OAM order equals to 1, using drilling holes in a Teflon flat plate. Details on the techniques used to manufacture the flat phase plate are presented, as well as some simulated results to held a comparative study between our antenna and the already existing ones (parabolic dish antenna and spiral phase plate).
REFERENCES
[1] J. D. Jackson, Classical Electrodynamics, 3rd ed., New York: Wiley,
1998.
[2] B. Thidé et al., “Utilization of photon orbital angular momentum in the low-frequency radio Domain,” Physical Reviews Letters, vol. 99, no. 087701, 2007
[3] S. M. Mohammadi et al., “Orbital Angular Momentum in Radio – A System Study”, IEEE Transactions on Antennas and Propagation, vol. 58, No. 2, 2010.
[4] F. Tamburini et al., “Encoding many channels on the same frequency through radio vorticity: first experimental test,” New. J. Phys., vol. 14, no. 033001, March 2012.
[5] O. Edfors and A. J. Johansson, “Is orbital angular momentum (OAM) based radio communications an unexploited area?,” IEEE Transactions on Antennas and Propagation, vol. 60, no. 2, pp. 1126-1131, 2012. [6] N. Uribe-Patarroyo, A. Fraine, D. Simon, O. Minaeva and A. Sergienko,
“Object Identification Using Correlated Orbital Angular Momentum (OAM) States,” in Frontiers in Optics, Rochester, NY, USA, 2012. [7] R. Niemiec, C. Brousseau, O. Emile, and K. Mahdjoubi, “Orbital
angular momentum induced torque on a macroscopic system”, in AES2012 – Advanced Electromagnetics Symposium, Paris, France, April 2012.
[8] G.A. Turnbull, D.A. Robertson, G.M. Smith, L. Allen and M.J. Padgett, “The generation of free-space Laguerre-Gaussian modes at millimetre-wave frequencies by use of a spiral phaseplate,” Optics Comm., vol. 127, pp. 183-188, June 1996.
[9] K.A. Zimmerman and D.L. Runyon, “Luneberg lens and method of constructing same, “ U.S. Patent 5 677 796, Oct. 14, 1997.
[10] S. Rondineau, M. Himdi, and J. Sorieux, “A sliced spheriacl Luneburg lens,” IEEE Antennas and Wireless Propagation Letters, vol. 2, pp. 163-166, 2003.
[11] S. M. Mohammadi et al., “Orbital Angular Momentum in Radio – Measurement methods,” Radio Science, vol. 45, no. 4, August 2010. [12] E. Yao, S. Franke-Arnold, J. Courtial, S. Barnett, and M. Padgett,
“Fourier relationship between angular position and optical angular momentum,” Optics Express, vol. 14, pp. 907-9076, 2006.
Figure 4. Farfield in front of the flat phase plate as obtained by numerical simulations. The white circle corresponds to the maximum intensity of the EM field. Panel (a) is a visualization of the directivity of the beam, with the characteristical “donut” shape, and panel (b) is a visualization of the rotational phase distribution
Figure 5. Farfield in front of the spiral lens as obtained by numerical simulations. The white circle corresponds to the maximum intensity of the EM field. Panel (a) is a visualization of the directivity of the beam, with the characteristical “donut” shape, and panel (b) is a visualization of the rotational phase distribution.
Figure 6. Farfield in front of the twisted parabolic antenna as obtained by numerical simulations. The white circle corresponds to the maximum intensity of the EM field. Panel (a) is a visualization of the directivity of the beam, with the characteristical “donut” shape, and panel (b) is a visualization of the rotational phase
Figure 7. Mode decomposition for the flat phase plate (a), the spiral lens (b) and the “twisted” parabolic antenna (c). In each case the reference circle is represented with a white circle.