1
Coupling curvature-dependent and shear stress stimulated neotissue
1growth in dynamic bioreactor cultures: a 3D computational model of a
2complete scaffold.
3Guyot Y,1,2 Papantoniou I,1,3 Luyten F, 1,3 Geris L. 1,2,4
4
5
1Prometheus, Division of Skeletal Tissue Engineering, KU Leuven, Onderwijs en Navorsing 1
6
(+8), Herestraat 49 - PB813, B-3000 Leuven, Belgium.
7
2Biomechanics Research Unit, Universite de Liege, Chemin des Chevreuils 1 - BAT 52/3,
B-8
4000 Liege, Belgium.
9
3Skeletal Biology and Engineering Research Center, KU Leuven, Onderwijs en Navorsing 1 (+8),
10
Herestraat 49 - PB813, B-3000 Leuven, Belgium.
11
4Department of Mechanical Engineering, Biomechanics Section, KU Leuven, Celestijnenlaan
12 300C – PB 2419, B-3001 Leuven, Belgium. 13 14 15 16 17 18 19 20 21
2
Abstract
22
The main challenge in tissue engineering consists in understanding and controlling the growth
23
process of in vitro cultured neotissues towards obtaining functional tissues. Computational
24
models can provide crucial information on appropriate bioreactor and scaffold design but also on
25
the bioprocess environment and culture conditions. In this study the development of a 3D model
26
using the level set method to capture the growth of a microporous neotissue domain in a dynamic
27
culture environment (perfusion bioreactor) was pursued. In our model, neotissue growth velocity
28
was influenced by scaffold geometry as well as by flow induced shear stresses. The neotissue was
29
modeled as a homogenous porous medium with a given permeability and the Brinkman equation
30
was used to calculate the flow profile in both neotissue and void space. Neotissue growth was
31
modeled until the scaffold void volume was filled thus capturing already established
32
experimental observations, in particular the differences between scaffold filling under different
33
flow regimes. This tool is envisaged as a scaffold shape and bioprocess optimization tool with
34
predictive capacities. It will allow control fluid flow during long-term culture, whereby neotissue
35
growth alters flow patterns, in order to provide shear stress profiles and magnitudes across the
36
whole scaffold volume influencing, in turn, the neotissue growth.
37 38 39 40 41 42
3
Introduction
43
Skeletal Tissue Engineering (TE) strategies hold a great promise for the regeneration of bone and
44
cartilage based on the combination of bioreactors, 3D biomaterials and mesenchymal stem cells
45
(MSCs). MSCs are progenitor cells crucial for skeletal TE applications due to their ability to
46
undergo osteogenic and chondrogenic differentiation under the influence of various biochemical,
47
biophysical and, importantly, biomechanical cues. Perfusion bioreactors have been extensively
48
employed for the expansion and differentiation of MSCs providing sufficient mass transport for
49
cell growth and differentiation (Sikavitsas, Bancroft et al. 2005; Grayson, Marolt et al. 2011;
50
Sonnaert, Papantoniou et al. 2014). Furthermore, shear stress can determine early stem cell
51
lineage commitment (Song, Dean et al. 2013) but also promote terminal osteogenic
52
differentiation of bone marrow, periosteum and adipose derived MSCs and enhance extracellular
53
matrix (ECM) deposition (McCoy and O'Brien 2010; Rauh, Milan et al. 2011; Papantoniou, Chai
54
et al. 2013). There is a substantial body of literature illustrating the osteogenic effect of
55
mechanical stimulation either due to fluid flow or mechanical compression (or stretching) on the
56
differentiation of MSCs when cultured in dynamic environments seeded on 3D scaffolds in vitro
57
(Wang and Chen 2013; Delaine-Smith and Reilly 2011).
58
In scaffold-based perfusion bioreactor culture, 3D cell growth and neotissue formation has been
59
observed to begin with 2D cell proliferation on the scaffold strut surface. Subsequently, cells
60
bridge scaffold struts and start growing towards the pore void followed by ECM deposition.
61
Eventually, 3D cell growth will result in scaffold void filling, something that has been studied
62
recently using computed tomography imaging techniques (Voronov, VanGordon et al. 2013;
63
Papantoniou, Sonnaert et al. 2014). The calculation of wall shear stress values in empty scaffold
64
geometries are therefore indicative of the shear stress experienced by cells during early culture
4
time (Truscello, Schrooten et al. 2011). A current challenge to further advance and utilize
66
computational modeling strategies in the TE field is to comprise a domain composed of cells and
67
ECM (a growing permeable neotissue) on real 3D scaffold geometries. There are intriguing 2D
68
studies investigating this (Sacco, Causin et al. 2011; Hossain, Bergstrom et al. 2014) however it
69
was recently shown that without the third dimension, model parameters were overestimated
70
losing accuracy in the representation of neotissue growth (Nava, Raimondi et al. 2013).
71
Computational fluid dynamics (CFD) modeling has been extensively used in the field of TE (for
72
review see (Hutmacher and Singh 2008) (Hossain, Chen et al. 2012) (Patrachari, Podichetty et al.
73
2012)). The quantification of flow-associated shear stresses as well as their spatial distribution
74
within various 3D scaffold geometries has been thoroughly investigated in perfused bioreactor
75
setups (Raimondi, Boschetti et al. 2004; Porter, Zauel et al. 2005; Boschetti, Raimondi et al.
76
2006; Cioffi, Boschetti et al. 2006; Jungreuthmayer, Donahue et al. 2009; Maes, Ransbeeck et al.
77
2009; Voronov, VanGordon et al. 2010). In previous studies, local shear stresses were defined as
78
a function of flow rate of the culture medium, bioreactor configuration, porosity and porous
79
scaffold micro-architecture (Voronov, VanGordon et al. 2010; Pham, Voronov et al. 2012). Most
80
3D CFD studies to date only use empty scaffold geometries to calculate shear stress magnitude
81
and distribution across the empty scaffold surface i.e. wall shear stress. The aforementioned
82
studies do not take into account the transient nature of the 3D neotissue domain as a result of
83
neotissue growth which has been observed experimentally (Papantoniou, Sonnaert et al. 2013).
84
There have been few attempts to capture 3D neotissue growth on scaffolds, limited to gradually
85
increasing scaffold struts (Lesman, Blinder et al. 2010), representing the neotissue layer as an
86
impermeable domain. A recent interesting study describes the growth of a ‘biomass’ domain
5
(similar to what we term neotissue in this study) whose growth was coupled to oxygen
88
concentration and shear stress (Nava, Raimondi et al. 2013).
89
In addition to flow associated shear stress, neotissue growth kinetics have been also linked to the
90
geometric features of scaffolds. Pore size (Zeltinger et al. 2001b), pore shape (Knychala et al.
91
2013), and more specific features such as local curvature (Rumpler et al. 2008; Gamsjager et al.
92
2013) have been demonstrated to control cell fate both for in vitro (Rumpler et al. 2008; Guyot et
93
al. 2014) and in vivo applications (Bidan et al. 2012).
94
Building on our previous studies where we investigated the effect of local curvature on in vitro
95
3D growth (Guyot et al., 2014) and where we used the evolving neotissue growth in a 3D
96
scaffold to accurately determine the shear stress values in both the void space and the neotissue
97
during the bioreactor culture process (Guyot et al., 2015), this study demonstrates the added value
98
of using also the shear stress as a parameter that influences the neotissue growth. Hereto this
99
study shows the development of a level-set based computational tool able to capture the
100
difference in growth of a microporous neotissue domain in a dynamic culture environment
101
(perfusion bioreactor) under different flow rates. Capturing this difference is only possible by the
102
explicit incorporation of flow-induced shear stresses as a parameter in the calculation of the
103
neotissue growth velocity (alongside the scaffold geometry which was already present (Guyot et
104
al., 2014)). This tool provides the ability to steer fluid flow during long term culture in order to
105
provide given shear stress profiles and magnitudes across the whole scaffold volume.
106
107
Methods
6
In this section, the model describing the neotissue growth, the calculation of the flow-induced
109
shear stresses and the influence of the latter on the former will be explained.
110
Neotissue growth via the level set method
111
The growth induced changes in the neotissue topology during the culture process can be seen as a
112
moving interface between two different domains (Sethian 1999): in this study, one domain
113
represents the neotissue volume , and the other one is the void , separated by an interface
114
, with a normal (see Fig 1B). The level set method (LMS) is a technique that has been
115
developed to deal with this kind of moving interfaces and it is used in the context of this study to
116
simulate the evolution of the frontline between neotissue and void space in a mesh-free
117
manner. The principle of the LSM consists in defining a signed distance function φ in =
118
∪ with the following properties:
119
> 0 < 0
= 0
(1) In order to capture the evolution of the moving interface , the following transient advection
120
equation is solved with a given growth velocity and homogenous Neumann boundary
121
condition ( / = 0, with being the normal to the computational domain ).
122
+ ∙ ∇ = 0 . (2)
With = ∙ , and =|∇ |∇ . The expression of the growth velocity magnitude will be
123
described later. The initial configuration of the distance function φ corresponds to a homogenous
124
single cell layer over the scaffold struts with a thickness equal to 20 µm (Darling and Guilak
7
2008). The time discretization of equation (2) was done using the backward Euler method and the
126
advection term was treated with the method of characteristics. For more details about the
127
implementation, please refer to (Guyot, Papantoniou et al. 2014).
128
Shear stress distribution
129
During dynamic culture, the neotissue grows, eventually filling up the whole scaffold void. These
130
changes affect the flow patterns developed, depending on the presence (or not) of neotissue and
131
so the flow profile has to be treated differently in and (as described in detail in Guyot et
132
al., 2015). In , due to a low Reynolds number (Re<1), the flow profile was approximated via
133
the Stokes equation (3). In , the complex structure of the neotissue can be seen as a
134
homogenous porous medium with a given permeability , leading to the flow profile being
135
calculated with the Darcy equation (4). According to the definition of the LSM, the interface is
136
never conforming to the computational mesh, resulting in difficulties to couple equation (3) and
137
(4) together with suitable boundary conditions at the interface. To overcome this, the Brinkman
138
equation (5) was used to calculate the flow profile in the whole domain (see Fig 1C). A no-slip
139
boundary condition was applied on the scaffold surface as well as on the chamber walls. The
140
scaffold was placed at a sufficient distance from the inlet avoiding refluxes occurring at the
141
entrance of the scaffold (Papantoniou, Guyot et al. 2014), so the boundary condition for the
142
inflow was set to a Poiseuille profile with a velocity u corresponding to the given flow rate Q.
143 − ∆ + ∇ = 0 in ∇. = 0 in (3) + ∇ = 0 in ∇. = 0 in (4)
8
− ∆ + ∇ + = 0 in ∇. = 0 in Ω
(5) This technique can be seen as a penalization method, indeed, when K is equal to the neotissue
144
permeability ( ≪ 1) in , it makes the Stokes term in (5) negligible. At the contrary, when
145
K is set to a very high value ( ≫ 1) in , it leads to the Darcy term to be close to zero. To
146
avoid numerical problems, this switch between the two values was implemented using a space
147
and time dependent smeared out Heaviside function H (6), and K was updated according to this
148
function (7) ( = 1.5ℎ, with h the mesh size).
149 150 ( ) = 0, < − 1 2 + 2 +2 sin1 , − < < 1, > − (6) ( ) = 10 (1 − ) + (7)
The parameter was estimated using the random fibers theory approximation. In (Nabovati A.
151
2009), the authors provide an approximation of the permeability of a porous media made of a
152
random fiber web:
153
= 0.491 − 1 . . (8)
154
In this equation, represents the porosity of the media (neotissue, assumed to be equal to 90% in
155
this study, which is in the range of porosities of soft tissues and hydrogels) and corresponds to
156
a percolation threshold or a threshold porosity where flow is permitted (set to zero in this study).
9
Finally, represents the micro-pore size of the neotissue and was set to 50 µm, assuming the
158
pore size equal to half to one third of the size of a fully spread cell of the type used in this study
159
(Eyckmans, Lin et al. 2012).
160
In this study, we distinguished two different wall shear stresses acting on cells depending on their
161
location. The first one ( ) is the shear stress acting on the interface due to the different
162
flow profiles from either side and is calculated with the usual definition:
163
= + + , ℎ = + . (9)
The second one ( ) is the shear stress acting within the neotissue, it is associated with the
164
interstitial flow through the micro-porous neotissue and is approximated following the method
165
presented in (Whittaker, Booth et al. 2009). This method is based on the fact that the
micro-166
porous neotissue is assumed to be composed of cylindrical ducts of diameter . Since the Darcy
167
equation just gives the average (Darcy) velocity u, the interstitial velocity magnitude uin is
168
calculated from results of equation (5) and is turned into a Poiseuille velocity profile ( ) in a
169
cylindrical channel in order to have an analytical expression of local wall shear stress (on the
170
wall of the cylindrical ducts, representing here the micro-pores), allowing for the estimation of
171 SSin. 172 = | |/ (10) ≈ 2 1 − 2 (11) = / ≈ 8 ≈8 | | (12) 173
10
Neotissue growth velocity
174
A key parameter of the study is the local growth velocity of the neotissue. In (Guyot,
175
Papantoniou et al. 2014), this space dependent velocity was only depending on the local mean
176
curvature of the interface as it has been shown in (Bidan, Kommareddy et al. 2012) or (Rumpler,
177
Woesz et al. 2008). Another important growth influencing factor is the local shear stress on cells.
178
In (Nava, Raimondi et al. 2013), authors present a biomass growth model for cartilage describing
179
an interface moving in time in function of the fluid-induced shear stress and in (Chapman,
180
Shipley et al. 2014) the authors introduce a growth model for cell aggregates in hollow fiber
181
bioreactors where cell population growth increased or decreased depending on wall shear stresses
182
experienced by cells. In this study, a similar approach is used and the local neotissue growth
183
velocity is described as a function of both the mean curvature and the flow-induced shear
184
stress:
185
= ∙ ∙ ( ). (13)
The neotissue growth velocity parameter was estimated from the experimental data obtained
186
for the low flow rate results obtained in (Papantoniou, Sonnaert et al. 2014) using a trial and error
187
approach and was set equal to 4 ∙ 10 m2/s. As described extensively in (Guyot et al, 2014),
188
the basis of the influence of curvature on the neotissue growth comes from the observation that
189
neotissue grows faster where the curvature is higher and that it does not grow if the curvature is
190
negative or equal to zero (Bidan, Kommareddy, et al. 2013). The mean curvature influence
191
function ( ) can therefore be expressed mathematically as follows:
11
( ) = − 0 ≤ 0 , > 0 (14) where is the local mean curvature (κ = ∇ ∙ ) and the second row of equation (14) depicts that
193
there is no growth when the curvature is null or negative. The negative sign in equation (14)
194
comes from the fact that according to our definition of φ, the normal points toward neotissue,
195
so growth has to be towards the opposite of ∇ . The surface shear stress influence function
196
(unit less) was inspired by (Nava, Raimondi et al. 2013) (Fig 1D) and defined as a
197 continuous function 198 = 0.5 +0.5 ∙ 0 ≤ < 1 ≤ < − − ≤ < 0 ≤ (15)
This function was established in order to have an optimal shear stress influence that enhances the
199
growth ( < < ), and a critical threshold ( > ) above which shear stress
200
inhibits the cells and growth cannot occur anymore, in this study , , were respectively set
201
to 0.05, 0.15 and 0.2 Pa (Chapman, Shipley et al. 2014). Table 1 summarizes all the parameters
202
used in the calculation of the neotissue growth velocity vG.
203
204
Table 1: model parameters used for the calculation of the neotissue growth rate vG.
205
Parameter Value References
12
2015)
Neotissue micro-pore size, 50 µm (Guyot, Papantoniou et al, 2015)
Neotissue growth rate, A 4 ∙ 10 m2/s Determined from
(Papantoniou, Sonnaert et al. 2014)
Minimal shear stress value enhancing neotissue growth,
0.01 (Chapman, Shipley et al. 2014).
Maximal shear stress value enhancing neotissue growth,
0.03 (Chapman, Shipley et al. 2014).
Critical shear stress value, 0.05 (Chapman, Shipley et al. 2014).
206
Implementation
207
The full model was implemented with the free partial differential equation solver FreeFem++
208
(Hecht 2012). The computational domain (see Fig 1A) chosen consisted of the part of the
209
perfusion bioreactor chamber comprising the entire scaffold including 2mm of the chamber at
210
each scaffold side. This was done in order to avoid numerical refluxes and was meshed with
211
approximately 3 million tetrahedrons. The numerical problem was solved in parallel using a 12
212
core facility. In order to avoid unnecessary computational effort, the Brinkman equation was
13
solved on only one quarter of the full mesh cut along the flow axis and with respect to
214
symmetrical boundary condition.
215
Summary of Experimental set-up
216
In this study, results presented in (Papantoniou, Sonnaert et al. 2014) were used in a first
217
calibration and validation set-up. The set-up of the experiment is briefly repeated below.
Three-218
dimensional additive manufactured open porous Ti6Al4V scaffolds (Ø = 6 mm, h = 6 mm,
219
porosity = 73% ± 1%, strut diameter = 245 ± 2 mm and pore size = 755 ± 3 mm), produced on an
220
in-house developed selective laser melting (SLM) machine (Van Bael, Kerckhofs et al. 2011)
221
were used. Human Periosteal Derived Stem Cells (hPDCs, one of the known sources of MSCs)
222
were isolated from periosteal biopsies of different donors as described previously (Eyckmans and
223
Luyten 2006) and expanded in culture flasks. When a sufficient amount of these cells was
224
produced in this 2D culture (number of population doublings = 15), cells were harvested by
225
trypsinization with Tryple Express (Invitrogen) and seeded on the scaffolds, which marked the
226
start of the bioreactor experiment. The TE constructs were cultured in an in-house developed
227
bioreactor for 14, 21 and 28 days under dynamic culture conditions (n = 9 per flow rate –
228
triplicates per time point). Two different perfusion flow rates were used: 4 mL/min (Q1, high) and
229
0.04 mL/min (Q2, low). After culture, three constructs for each time point were prepared for
230
contrast-enhanced nanofocus Computed Tomography (NanoCT) imaging (Kerckhofs 2013)
231
allowing for visualization and quantification of the neotissue volume formed inside the
232
constructs.
14 234
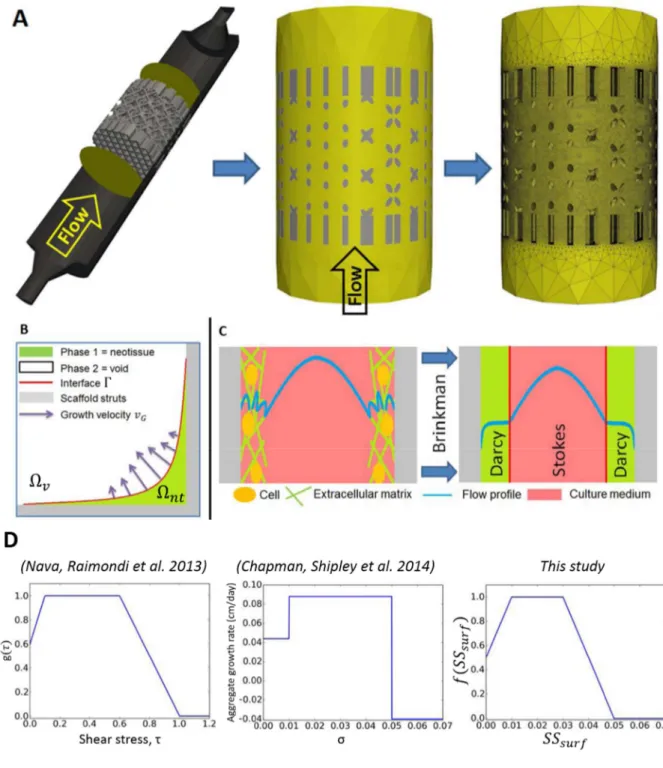
Fig 1: Model setup. (A) Representation of the scaffold and the bioreactor chamber, the region of
235
interest is delimited by two yellow circles. The scaffold is then removed from a cylinder
236
representing the delimited area. Finally, a mesh is created in the computational domain. (B)
237
Schematic representation of curvature driven neotissue growth using the level set method. (C)
15
Schematic representation of the Brinkman approximation used in this study. (D) The influence of
239
shear stress on the neotissue growth velocity in this study (right) is a combination of the
240
continuous shape proposed by (Nava, Raimondi et al. 2013) and the values by (Chapman, Shipley
241 et al. 2014) (middle). 242 243
Results
244The model was run for different flow rates according to the experimental set up described in
245
(Papantoniou, Sonnaert et al. 2014). Simulations show a significant difference between the two
246
conditions regarding the total amount of neotissue that has been produced at different time points
247
(Fig 2 and Fig 3). Indeed, under the high flow rate , the local shear stress acting on the neotissue
248
interface is higher than for the lowest flow rate, resulting in an acceleration of neotissue growth.
249
Although differences can be observed between the simulations and experiments, the simulations
250
are capable of capturing the experimentally observed differences between the two flow rates in
251
terms of volume filling (Fig 3B). The model was also able to compute quantitative data (shown in
252
Fig 4) regarding important culture variables during neotissue growth such as pressure drop across
253
the scaffold along the flow axis, average surface and inner shear stresses, giving an overview of
254
different mechanical stimuli acting on cells over culture time.
255
The pressure drop (Fig 4A) across the scaffold varied from almost 4 Pa in the first days of culture
256
to 11 Pa at day 28 for the high flow rate Q1, while it ranged from 0.03 Pa to 0.08 Pa for the low
257
flow rate Q2 in an equivalent period of time. The surface shear stresses (Fig 4B) and inside shear
258
stresses (Fig 4C) differed by a factor of 100 between the two different flow rates. For both flow
16
rates, the inner shear stress, the stress acting on cells embedded into the neotissue, can be around
260
3 (for early time points) to 20 (for late time points) times bigger than the interface shear stress
261
acting on cells at interface in contact with the free flow. Fig 5 shows how the flow regime
262
changes from when the scaffold is almost empty (Fig 5A) to where it is partially filled (Fig 5B).
263
Fig 6 depicts the local growth velocity showing the influence of the distributed shear stress as
264
well as the local mean curvature of the surface. Maximal neotissue growth velocities of 3 and 7
265
µm/day were obtained for the low and high flow rates respectively.
17 267
Figure 2: Neotissue growth (green) on scaffold (grey) at different time points for two different
268
flow rates and two different views (direction of flow rate is from bottom to top in side view).
269
Gradual scaffold pore closure can be observed. Scale bar represents 1 mm.
270
18 272
Fig 3: Comparison between simulations and experimental results (Papantoniou, Sonnaert et al.
273
2014). (B) Evolution of volume filling over culture time for the two different flow rates used in
274
this study. Experimental results are presented through the mean and standard deviation (n=3).
275
(A) Quantitative differences in volume filling between the different flow rates, indicating that the
276
simulated differences are similar to those experimentally observed.
19
278
Fig 4: Mechanical characterization of the predicted tissue growth for flow rates Q2
279
(0.04ml/min, left) and Q1 (4ml/min, right). (A) Pressure drop between the entrance and the exit of
280
the scaffold. (B) Average neotissue surface shear stress. (C) Average inside neotissue shear
281
stress. Notice the difference in scale on the vertical axes between left and right figures.
20
283
Fig 5: Close-up view on a section of the scaffold illustrating the different flow profiles (u) at
284
early (A) and late (B) time points (neotissue volume is indicated in pink). In image (A), the
285
scaffold is almost empty, so the flow is mostly ruled by the Stokes equation leading to Poiseuille
286
flow in the bottom part. In (B), the bottom part of the scaffold is completely filled with neotissue,
287
so the flow profile in this area is ruled by the Darcy equation. +=scaffold, □=neotissue, Δ=void.
288 289 290 291 292 293
21
294
Fig 6: Local distribution of the neotissue growth velocity (m/s) at the neotissue-void interface
295
at 28 days for flow rates Q2 (0.04ml/min, left) and Q1 (4ml/min, right). the neotissue is indicated
296 in light grey). 297 298 299 300 301 302 303
22
Discussion
304
Understanding spatiotemporal cell growth in dynamic cultures constitutes a challenge in TE, in
305
particular the quantification, distribution and interplay between scaffold geometry, shear stress
306
and neotissue growth. The present model provides a foundation that will allow the quantitative
307
investigation of the effect of shear stresses on cell growth and ECM production, which today is
308
still not well understood. The most important contribution of this study is the extension of a
309
previously developed model of local curvature-dependent neotissue growth to incorporate the
310
influence of the local shear stresses on the neotissue growth, on complete scaffolds in 3D. The
311
importance of 3D models in comparison to 2D has been shown by (Nava, Raimondi et al. 2013),
312
the latter suffering from a lack of accurate representation which leads to loss of information and
313
an incorrect parameter estimation.
314
Recent experimental observations have revealed that hPDCs (the MSC source used in this study)
315
may grow in the third dimension by bridging scaffold struts, leading to complete filling of
316
scaffold pores when cultured in perfusion bioreactors in glucose based growth medium (Sonnaert,
317
Papantoniou et al. 2014) and in growth factor containing osteogenic medium (Papantoniou Ir,
318
Chai et al. 2013). NanoCT imaging has been employed to confirm that complete pore closure
319
could be obtained depending on bioreactor operating conditions (Papantoniou, Sonnaert et al.
320
2014). Similar 3D cell growth behavior upon seeding on scaffolds has been also observed for
321
other cell types such as human bone marrow MSCs (Zhao, Pathi et al. 2005; Li, Tang et al. 2009),
322
primary fibroblasts (Joly, Duda et al. 2013) and cell lines such as MC3T3-E1 pre-osteoblast cells
323
(Kommareddy, Lange et al. 2010). This opens the possibility to create 3D in vitro tissue-like
324
structures where cells may grow independently of the initial scaffold surface allowing for the
325
study of the interaction between cells and their own ECM and the culture environment.
23
Additionally, this means that when simulating the experimentally observed void filling due to 3D
327
neotissue growth, models should take into account the specificity of the experimentally used cell
328
type (Chapman, Shipley et al. 2014). In this work we attempt to investigate this for adult stem
329
cell types in particular for hPDCs.
330
Neotissue growth kinetics in 3D dynamic and scaffold-based culture set ups, has been linked with
331
oxygen level (Zhao, Pathi et al. 2005), shear stress (Nava, Raimondi et al. 2013) and scaffold
332
geometry - in particular curvature (Bidan, Kommareddy et al. 2013; Knychala, Bouropoulos et al.
333
2013). In our study, oxygen was not investigated since for the flow rate and scaffold dimensions
334
used in this work, taking into account the the oxygen consumption rate of hPDCs (Lambrechts,
335
Papantoniou et al. 2014), there is no significant oxygen drop detected from inlet to outlet.
336
Therefore the assumption that the whole cell population is exposed to the same level of dissolved
337
oxygen tension (atmospheric) seems to be justified. When other flow regimes and/or other cell
338
types will be studied, this assumption has to be re-evaluated. An additional assumption was the
339
existence of an initial single cell layer at the start of the simulations. This layer was assumed to
340
be 20 µm based on 2D suspended MSC diameter values (Darling and Guilak 2008), leading to an
341
initial filling percentage of 18 %. Provided that a high number of cells is used for cell seeding
342
(Chen, Bloemen et al. 2011), a homogeneous distribution can indeed be achieved across the
343
scaffold. This step has been studied in detail for regular geometry scaffolds (Melchels, Tonnarelli
344
et al. 2011). The initial filling percentage is likely an overestimation of the real filling and is (in
345
its current way of calculating) dependent on the available surface of the scaffold under study.
346
With the currently used measurement technique (NanoCT) the experimental value for the initial
347
filling cannot be obtained due to the absence of matrix produced by the cells immediately after
348
seeding. This parameter therefore merits further study in future work. Neotissue shrinkage/loss
24
due to cell death was not incorporated in the presented model, however, there is a possibility that
350
this shrinkage/loss occurs for those cases were excessively harsh culture conditions are developed
351
i.e. very low dissolved oxygen tension (anoxia) and glucose concentration or high lactate
352
concentration (Flaibani, Magrofuoco et al. 2010). Further efforts are required in order to
353
incorporate the aforementioned physico-chemical components in our model. However this is out
354
of the scope of the present study, where geometry and fluid dynamics are the main regulators of
355
neotissue growth.
356
In this study neotissue growth velocity was coupled to the local scaffold topography (curvature)
357
(Guyot, Papantoniou et al. 2014) and local fluid flow induced shear stress. Shear stress was
358
modeled to enhance increasingly neotissue growth from 0 to reaching a maximum value
359
between and (equal to 0.01 and 0.03 Pa respectively). The lower amount of neotissue
360
observed at the periphery of the scaffolds is due to the low values of fluid flow induced shear
361
stresses at that location. This in turn is due to the flow demonstrating a Poiseuille profile when
362
entering the scaffold, thereby positively influencing to a greater extent the neotissue formation at
363
the center of the scaffold. When the shear stress reaches threshold equal to 0.05 Pa, its effect
364
on neotissue growth was modeled to change into a prohibitive one with decreasing neotissue
365
growth for increasing shear stresses beyond a3. Experimental observations of 0.015 Pa as an
366
optimum shear stress level for human bone marrow MSCs cultured in perfusion bioreactors
367
confirmed this hypothesis (Li, Tang et al. 2009). A similar range of shear stresses has been
368
reported for human bone marrow MSCs by (Grayson, Bhumiratana et al. 2010) although these
369
values referred to empty scaffold geometries. We have recently experimentally observed the
370
adverse effects of excessive shear stress on neotissue growth by hPDCs in perfusion bioreactors
371
resulting in inhomogeneous tissue engineered constructs (Papantoniou, Guyot et al. 2014). This
372
was observed for shear stress values in excess of 0.05 Pa which is the threshold value used in this
25
study. Interestingly (McCoy, Jungreuthmayer et al. 2012) estimated a critical threshold for human
374
bone MSC detachment from irregular scaffolds at 0.088 Pa closely matching the one used here,
375
taking into account the differences in scaffold architecture and cell type.
376
The growth velocity term A was estimated in a trial and error fashion based on in-house
377
experimental observations (Papantoniou, Sonnaert et al. 2014) measuring neotissue growth on the
378
simulated scaffold for the low flow rate Q2 . The prediction obtained for the high flow rate Q1
379
shows an increase in volume filling, similar to the experimental data (Fig 3B). The discrepancy
380
observed between experimental and computationally-derived neotissue growth kinetics seen in
381
Fig 3 could be attributed to numerical and physical factors. For the former (numerical factor), we
382
did not go through an objective and rigorous optimization process to find the value for A because
383
of the insufficient quantity of experimental data available. In a follow-up study, dedicated
384
experimental data will be generated to parametrize the model. As to the latter (physical factor),
385
neotissue growth kinetics do not solely depend upon scaffold geometry and shear stress
386
magnitude. The introduction in the model of additional physico-chemical parameters that are well
387
known for their influence on neotissue growth such as dissolved oxygen tension (Grayson, Zhao
388
et al. 2007; Dos Santos, Andrade et al. 2010), glucose concentration (Saki, Jalalifar et al. 2013)
389
and lactate concentrations (Schop, Janssen et al. 2009) in the medium, could help to improve the
390
agreement between experimentally and computationally determined values. Even though for the
391
experiments used in this study (Papantoniou, Sonnaert et al. 2014), no global changes in oxygen
392
tension were observed between the inlet and outlet for the flow rate and cell source used, the
393
model allows to quantify these variable throughout the entire scaffold, potentially showing
394
pockets of decreased oxygen tension (and neotissue growth) coming from improper perfusion due
395
to local geometrical particularities. Additionally, the possibility that higher flow rates might lead
26
to the secretion of more ECM could also explain to a certain extent the differences in volume
397
filling patters between simulations and experiments.
398
In a very interesting recent study, neotissue was modeled in 3D by (Nava, Raimondi et al. 2013)
399
using the arbitrary Lagrangian–Eulerian (ALE) method to implement mesh movement. However,
400
the flow was only modeled in the void space, which is acceptable for the early growth phase, but
401
is not suitable to simulate complete filling of the scaffold. In this study, we employed the level set
402
method to represent neotissue growth as described previously in (Guyot, Papantoniou et al. 2014
403
and Guyot et al. 2015). This method, separating the movement of the interface from the definition
404
of the mesh allows tracking the neotissue kinetics until full scaffold pore filling is reached. A
405
maximal neotissue growth velocity of 3 and 7 µm/day was obtained for the low and high flow
406
rates respectively as seen in Fig 6. The average growth velocities from the present study are the
407
same order of magnitude than the ones estimated in (Nava, Raimondi et al. 2013) which were in
408
the order of 1 µm/day and higher than the values adopted in previous tissue growth models
409
(Sacco, Causin et al. 2011). This could be due to the fact that chondrocytes modeled in that work
410
are slow proliferating cells compared to hPDCs.
411
Numerical predictions obtained in this study (Fig 4 and Fig 5) are in general agreement with
412
published literature with regard to the range of shear stresses calculated at the neotissue
413
interphase during neotissue growth (Boschetti, Raimondi et al. 2006; Cioffi, Boschetti et al. 2006;
414
Lesman, Blinder et al. 2010; Nava, Raimondi et al. 2013). However shear stresses developed
415
within the neotissue (SSin) were seen to be an order of magnitude higher than the surface shear
416
stresses. It is interesting to note that the average values obtained for inner shear stress for the high
417
flow rate in this work, reaching 0.7 Pa, compared closely to the ones determined for native bone
418
(1–3 Pa) (Zeng, Cowin et al. 1994), closer than what has been reported to date for tissue
419
engineered constructs. In this study it was assumed that the pores within the neotissue had a size
27
of 50 µm, this was justified, for our case study, for large hPDC cells whose size has been shown
421
to range between 100-150 µm when fully spread (Eyckmans, Lin et al. 2012). This value could
422
become smaller upon 3D confluency when cells ECM secretion might lead to fuller neotissue
423
structures. Interestingly, the calculated inner neotissue (microporous) shear stress magnitude for
424
the selected neotissue pore size matched closely to those determined via single cell simulations
425
(Jungreuthmayer, Donahue et al. 2009; Verbruggen, Vaughan et al. 2014; Zhao, Vaughan et al.
426
2014). Empty scaffold simulations may be useful for early time points and have been successfully
427
used to determine stem cell lineage commitment (Song, Dean et al. 2013) however for later
428
culture time points these models seem to be insufficient.
429
Using the whole scaffold geometry it was also possible to determine changing pressure drop
430
values during neotissue growth and subsequent scaffold pore closure. The maximum pressure
431
drop values obtained for the high flow rate, for completely full scaffolds, equaled to 11 Pa for the
432
parameters of this study (cylindrical scaffold dimensions d = 6 mm, h = 6 mm; neotissue porosity
433
90%, pore size = 50 µm). This value is close to pressure drop measured computationally in
434
microporous polyester scaffolds in flow through perfusion bioreactors (ΔP = 46 Pa, scaffold h =
435
20 mm, d = 100 mm, flow rate 10 ml/min (Podichetty, Bhaskar et al. 2014)) but also with
436
experimentally measured pressure drop values for chitosan-gelatin scaffolds (with 80-92 %
437
porosity and pore size ~100 µm, d = 100 mm, h = 2 mm (Podichetty, Dhane et al. 2012)).
438
Pressure drop is a parameter that can be measured online during bioreactor culture and, when
439
linked to this whole-scaffold model, could provide a non-invasive readout to monitor neotissue
440
growth in perfusion bioreactors. The continuous secretion of ECM, in particular upon reaching
441
3D ‘confluency’, is expected to lead a decrease in neotissue permeability. This will occur mostly
442
towards the later stages of perfusion culture. To achieve this in the present model a
time-443
dependent parameter could be coupled to the porosity parameter making it decrease over time,
28
reflecting ECM deposition. This could be experimentally validated by measuring pressure drop
445
across the tissue engineered construct over time, for fixed flow rates. 446
Scaffold design in perfusion bioreactors can affect neotissue growth in two ways. First, due to
447
their geometry, the scaffolds provide topographies that will enhance 3D cell growth and neotissue
448
formation (Melchels, Barradas et al. 2010; Van Bael, Chai et al. 2012). Second, their design will
449
define fluid flow patterns throughout the entirety of the scaffold affecting the mechanical stimuli
450
exerted on the cells (Hutmacher and Singh 2008) and the resulting growth kinetics. The
451
computational tool developed in this study could be used to assess biomechanical regimes that
452
will develop in a particular scaffold during neotissue growth but also to evaluate the effect of
453
specific geometries using scaffold CAD designs on these regimes. This model could also suggest
454
‘ideal’ geometries where shear stress variation exerted on cells across the scaffold could be
455
minimized, resulting thus in a more homogeneous cell population phenotype. The spatiotemporal
456
mapping of shear stress levels will allow to more accurately link phenotypic responses in
457
bioreactors (Gomes, Sikavitsas et al. 2003; Yu, Botchwey et al. 2004; Grayson, Marolt et al.
458
2011) with the experienced biomechanical microenvironment. Moreover, already observed
459
phenomena such as shear stress dependent ECM secretion and mineralization (Gomes, Sikavitsas
460
et al. 2003; Sikavitsas, Bancroft et al. 2005; Papantoniou, Chai et al. 2013) could be also linked
461
to the experienced microenvironment. For their validation such models will require 3D tools of
462
high resolution such as NanoCT as presented here or synchrotron X ray microCT as reported
463
elsewhere (Albertini, Giuliani et al. 2009; Voronov, VanGordon et al. 2013).
464 465
Conclusion
466
In this study, a 3D model of microporous neotissue growth in a dynamic culture environment was
467
presented in which the neotissue growth velocity depends on scaffold geometry and fluid flow
29
induced shear stress. The obtained simulation results showed a correspondence with established
469
experimental observations. Although the model can be extended to include additional
470
determinants of the growth process, in its current state it is already able to act as a scaffold shape
471
and bioprocess optimization tool, allowing for a control of the flow-induced mechanical
472
stimulation and growth of the neotissue.
473
Acknowledgments
474
Y.G. is funded by Belgian National Fund for Scientific Research (FNRS) grant FRFC 2.4564.12.
475
I.P. is funded by an advanced European Research Council grant under the European Union’s
476
Seventh Framework Program (FP/2007-2013)/ERC Grant Agreement No. 294191). The research
477
leading to these results has received funding from the European Research Council under the
478
European Union’s Seventh Framework Program (FP/2007-2013)/ERC Grant Agreement No.
479
279100. This work is part of Prometheus, the Leuven R&D division of Skeletal Tissue
480
Engineering.
481
References
482
Bidan, C. M., K. P. Kommareddy, et al. (2012). "How Linear Tension Converts to Curvature: Geometric 483
Control of Bone Tissue Growth." PLoS One 7(5). 484
Bidan, C. M., K. P. Kommareddy, et al. (2013). "Geometry as a Factor for Tissue Growth: Towards Shape 485
Optimization of Tissue Engineering Scaffolds." Advanced Healthcare Materials 2(1): 186-194. 486
Boschetti, F., M. T. Raimondi, et al. (2006). "Prediction of the micro-fluid dynamic environment imposed 487
to three-dimensional engineered cell systems in bioreactors." Journal of Biomechanics 39(3): 488
418-425. 489
Chapman, L. A., R. J. Shipley, et al. (2014). "Optimising cell aggregate expansion in a perfused hollow 490
fibre bioreactor via mathematical modelling." PLoS One 9(8): e105813. 491
Chen, Y., V. Bloemen, et al. (2011). "Characterization and optimization of cell seeding in scaffolds by 492
factorial design: quality by design approach for skeletal tissue engineering." Tissue Eng Part C 493
Methods 17(12): 1211-1221. 494
Cioffi, M., F. Boschetti, et al. (2006). "Modeling evaluation of the fluid-dynamic microenvironment in 495
tissue-engineered constructs: A micro-CT based model." Biotechnology and Bioengineering 496
93(3): 500-510. 497
30 Darling, E. M. and F. Guilak (2008). "A neural network model for cell classification based on single-cell 498
biomechanical properties." Tissue Engineering Part A 14(9): 1507-1515. 499
Delaine-Smith, R. M. and G. C. Reilly (2011). "The effects of mechanical loading on mesenchymal stem 500
cell differentiation and matrix production." Vitam Horm 87: 417-480. 501
Dos Santos, F., P. Z. Andrade, et al. (2010). "Ex vivo expansion of human mesenchymal stem cells: a more 502
effective cell proliferation kinetics and metabolism under hypoxia." J Cell Physiol 223(1): 27-35. 503
Eyckmans, J., G. L. Lin, et al. (2012). "Adhesive and mechanical regulation of mesenchymal stem cell 504
differentiation in human bone marrow and periosteum-derived progenitor cells." Biol Open 505
1(11): 1058-1068. 506
Eyckmans, J. and F. P. Luyten (2006). "Species specificity of ectopic bone formation using periosteum-507
derived mesenchymal progenitor cells." Tissue Eng 12(8): 2203-2213. 508
Flaibani, M., E. Magrofuoco, et al. (2010). "Computational Modeling of Cell Growth Heterogeneity in a 509
Perfused 3D Scaffold." Industrial & Engineering Chemistry Research 49(2): 859-869. 510
Grayson, W. L., S. Bhumiratana, et al. (2010). "Spatial regulation of human mesenchymal stem cell 511
differentiation in engineered osteochondral constructs: effects of pre-differentiation, soluble 512
factors and medium perfusion." Osteoarthritis and Cartilage 18(5): 714-723. 513
Grayson, W. L., D. Marolt, et al. (2011). "Optimizing the medium perfusion rate in bone tissue 514
engineering bioreactors." Biotechnol Bioeng 108(5): 1159-1170. 515
Grayson, W. L., F. Zhao, et al. (2007). "Hypoxia enhances proliferation and tissue formation of human 516
mesenchymal stem cells." Biochem Biophys Res Commun 358(3): 948-953. 517
Guyot, Y., I. Papantoniou, et al. (2014). "A computational model for cell/ECM growth on 3D surfaces 518
using the level set method: a bone tissue engineering case study." Biomech Model Mechanobiol. 519
Guyot, Y., I. Papantoniou, et al. (2015). " A three-dimensional computational fluid dynamics model of 520
shear stress distribution during neotissue growth in a perfusion bioreactor." Biotechnol Bioeng. 521
2015 Jun 9. doi: 10.1002/bit.25672Hecht, F. (2012). "New development in freefem++." Journal of 522
Numerical Mathematics 20(3-4): 251-265. 523
Hossain, M. S., D. J. Bergstrom, et al. (2014). "Prediction of cell growth rate over scaffold strands inside a 524
perfusion bioreactor." Biomech Model Mechanobiol. 525
Hossain, M. S., X. B. Chen, et al. (2012). "Investigation of the in vitro culture process for skeletal-tissue-526
engineered constructs using computational fluid dynamics and experimental methods." J 527
Biomech Eng 134(12): 121003. 528
Hutmacher, D. W. and H. Singh (2008). "Computational fluid dynamics for improved bioreactor design 529
and 3D culture." Trends Biotechnol 26(4): 166-172. 530
Joly, P., G. N. Duda, et al. (2013). "Geometry-driven cell organization determines tissue growths in 531
scaffold pores: consequences for fibronectin organization." PLoS One 8(9): e73545. 532
Jungreuthmayer, C., S. W. Donahue, et al. (2009). "A Comparative Study of Shear Stresses in Collagen-533
Glycosaminoglycan and Calcium Phosphate Scaffolds in Bone Tissue-Engineering Bioreactors." 534
Tissue Engineering Part A 15(5): 1141-1149. 535
Kerckhofs, G., Sains, J., Wevers, M., Van de Putte, T., and Schrooten, J. (2013). "Contrast-enhanced 536
nanofocus computed tomography images the cartilage subtissue architecture in three 537
dimensions." European Cells and Materials accepted. 538
Knychala, J., N. Bouropoulos, et al. (2013). "Pore geometry regulates early stage human bone marrow 539
cell tissue formation and organisation." Ann Biomed Eng 41(5): 917-930. 540
Kommareddy, K. P., C. Lange, et al. (2010). "Two stages in three-dimensional in vitro growth of tissue 541
generated by osteoblastlike cells." Biointerphases 5(2): 45-52. 542
Lambrechts, T., I. Papantoniou, et al. (2014). "Model-Based Cell Number Quantification Using Online 543
Single-Oxygen Sensor Data for Tissue Engineering Perfusion Bioreactors." Biotechnology and 544
Bioengineering 111(10): 1982-1992. 545
31 Lesman, A., Y. Blinder, et al. (2010). "Modeling of flow-induced shear stress applied on 3D cellular 546
scaffolds: Implications for vascular tissue engineering." Biotechnol Bioeng 105(3): 645-654. 547
Li, D. Q., T. T. Tang, et al. (2009). "Effects of Flow Shear Stress and Mass Transport on the Construction of 548
a Large-Scale Tissue-Engineered Bone in a Perfusion Bioreactor." Tissue Engineering Part A 549
15(10): 2773-2783. 550
Maes, F., P. Ransbeeck, et al. (2009). "Modeling Fluid Flow Through Irregular Scaffolds for Perfusion 551
Bioreactors." Biotechnology and Bioengineering 103(3): 621-630. 552
McCoy, R. J., C. Jungreuthmayer, et al. (2012). "Influence of flow rate and scaffold pore size on cell 553
behavior during mechanical stimulation in a flow perfusion bioreactor." Biotechnol Bioeng 554
109(6): 1583-1594. 555
McCoy, R. J. and F. J. O'Brien (2010). "Influence of Shear Stress in Perfusion Bioreactor Cultures for the 556
Development of Three-Dimensional Bone Tissue Constructs: A Review." Tissue Engineering Part 557
B-Reviews 16(6): 587-601. 558
Melchels, F. P., A. M. Barradas, et al. (2010). "Effects of the architecture of tissue engineering scaffolds 559
on cell seeding and culturing." Acta Biomater 6(11): 4208-4217. 560
Melchels, F. P., B. Tonnarelli, et al. (2011). "The influence of the scaffold design on the distribution of 561
adhering cells after perfusion cell seeding." Biomaterials 32(11): 2878-2884. 562
Nabovati A., L. E., Sousa A.C.M. (2009). "A general model for the permeability of fibrous porous media 563
based on fluid flow simulations using the lattice Boltzmann method." Composites: Part A: 860-564
869. 565
Nava, M. M., M. T. Raimondi, et al. (2013). "A multiphysics 3D model of tissue growth under interstitial 566
perfusion in a tissue-engineering bioreactor." Biomech Model Mechanobiol 12(6): 1169-1179. 567
Papantoniou, I., Y. Guyot, et al. (2014). "Spatial optimization in perfusion bioreactors improves bone 568
tissue-engineered construct quality attributes." Biotechnol Bioeng 111(12): 2560-2570. 569
Papantoniou, I., M. Sonnaert, et al. (2014). "Three-dimensional characterization of tissue-engineered 570
constructs by contrast-enhanced nanofocus computed tomography." Tissue Eng Part C Methods 571
20(3): 177-187. 572
Papantoniou Ir, I., Y. C. Chai, et al. (2013). "Process quality engineering for bioreactor-driven 573
manufacturing of tissue-engineered constructs for bone regeneration." Tissue Eng Part C 574
Methods 19(8): 596-609. 575
Patrachari, A. R., J. T. Podichetty, et al. (2012). "Application of computational fluid dynamics in tissue 576
engineering." J Biosci Bioeng 114(2): 123-132. 577
Pham, N. H., R. S. Voronov, et al. (2012). "Predicting the stress distribution within scaffolds with ordered 578
architecture." Biorheology 49(4): 235-247. 579
Podichetty, J. T., P. R. Bhaskar, et al. (2014). "Modeling Pressure Drop Using Generalized Scaffold 580
Characteristics in an Axial-Flow Bioreactor for Soft Tissue Regeneration." Annals of Biomedical 581
Engineering 42(6): 1319-1330. 582
Podichetty, J. T., D. V. Dhane, et al. (2012). "Dynamics of diffusivity and pressure drop in flow-through 583
and parallel-flow bioreactors during tissue regeneration." Biotechnol Prog 28(4): 1045-1054. 584
Porter, B., R. Zauel, et al. (2005). "3-D computational modeling of media flow through scaffolds in a 585
perfusion bioreactor." Journal of Biomechanics 38(3): 543-549. 586
Raimondi, M. T., F. Boschetti, et al. (2004). "The effect of media perfusion on three-dimensional cultures 587
of human chondrocytes: Integration of experimental and computational approaches." 588
Biorheology 41(3-4): 401-410. 589
Rauh, J., F. Milan, et al. (2011). "Bioreactor systems for bone tissue engineering." Tissue Eng Part B Rev 590
17(4): 263-280. 591
Rumpler, M., A. Woesz, et al. (2008). "The effect of geometry on three-dimensional tissue growth." 592
Journal of the Royal Society Interface 5(27): 1173-1180. 593
32 Sacco, R., P. Causin, et al. (2011). "A multiphysics/multiscale 2D numerical simulation of scaffold-based 594
cartilage regeneration under interstitial perfusion in a bioreactor." Biomech Model Mechanobiol 595
10(4): 577-589. 596
Saki, N., M. A. Jalalifar, et al. (2013). "Adverse effect of high glucose concentration on stem cell therapy." 597
Int J Hematol Oncol Stem Cell Res 7(3): 34-40. 598
Schop, D., F. W. Janssen, et al. (2009). "Growth, Metabolism, and Growth Inhibitors of Mesenchymal 599
Stem Cells." Tissue Engineering Part A 15(8): 1877-1886. 600
Sethian, J. A. (1999). Level set methods and fast marching methods : evolving interfaces in computational 601
geometry, fluid mechanics, computer vision, and materials science. Cambridge, U.K. ; New York, 602
Cambridge University Press. 603
Sikavitsas, V. I., G. N. Bancroft, et al. (2005). "Flow perfusion enhances the calcified matrix deposition of 604
marrow stromal cells in biodegradable nonwoven fiber mesh scaffolds." Annals of Biomedical 605
Engineering 33(1): 63-70. 606
Song, M. J., D. Dean, et al. (2013). "Mechanical modulation of nascent stem cell lineage commitment in 607
tissue engineering scaffolds." Biomaterials 34(23): 5766-5775. 608
Sonnaert, M., I. Papantoniou, et al. (2014). "Human periosteal-derived cell expansion in a perfusion 609
bioreactor system: proliferation, differentiation and extracellular matrix formation." J Tissue Eng 610
Regen Med. 611
Truscello, S., J. Schrooten, et al. (2011). "A computational tool for the upscaling of regular scaffolds 612
during in vitro perfusion culture." Tissue Eng Part C Methods 17(6): 619-630. 613
Van Bael, S., Y. C. Chai, et al. (2012). "The effect of pore geometry on the in vitro biological behavior of 614
human periosteum-derived cells seeded on selective laser-melted Ti6Al4V bone scaffolds." Acta 615
Biomater 8(7): 2824-2834. 616
Van Bael, S., G. Kerckhofs, et al. (2011). "Micro-CT-based improvement of geometrical and mechanical 617
controllability of selective laser melted Ti6Al4V porous structures." Materials Science and 618
Engineering a-Structural Materials Properties Microstructure and Processing 528(24): 7423-7431. 619
Verbruggen, S. W., T. J. Vaughan, et al. (2014). "Fluid flow in the osteocyte mechanical environment: a 620
fluid-structure interaction approach." Biomech Model Mechanobiol 13(1): 85-97. 621
Voronov, R., S. VanGordon, et al. (2010). "Computational modeling of flow-induced shear stresses within 622
3D salt-leached porous scaffolds imaged via micro-CT." Journal of Biomechanics 43(7): 1279-623
1286. 624
Voronov, R. S., S. B. VanGordon, et al. (2013). "3D Tissue-Engineered Construct Analysis via Conventional 625
High-Resolution Microcomputed Tomography Without X-Ray Contrast." Tissue Engineering Part 626
C-Methods 19(5): 327-335. 627
Wang, Y. K. and C. S. Chen (2013). "Cell adhesion and mechanical stimulation in the regulation of 628
mesenchymal stem cell differentiation." J Cell Mol Med 17(7): 823-832. 629
Whittaker, R. J., R. Booth, et al. (2009). "Mathematical modelling of fibre-enhanced perfusion inside a 630
tissue-engineering bioreactor." J Theor Biol 256(4): 533-546. 631
Zeng, Y., S. C. Cowin, et al. (1994). "A Fiber-Matrix Model for Fluid-Flow and Streaming Potentials in the 632
Canaliculi of an Osteon." Annals of Biomedical Engineering 22(3): 280-292. 633
Zhao, F., P. Pathi, et al. (2005). "Effects of oxygen transport on 3-d human mesenchymal stem cell 634
metabolic activity in perfusion and static cultures: experiments and mathematical model." 635
Biotechnol Prog 21(4): 1269-1280. 636
Zhao, F., T. J. Vaughan, et al. (2014). "Multiscale fluid-structure interaction modelling to determine the 637
mechanical stimulation of bone cells in a tissue engineered scaffold." Biomech Model 638
Mechanobiol. 639
33 641