Deep Drawing Simulations With Different Polycrystalline
Models
Laurent Duchêne*, Pierre de Montleau*, Salima Bouvier
†and Anne Marie
Habraken*
*Dpt. of Mechanics of Materials and Structures, University of Liège, Ch. des Chevreuils 1, 4000 Liège, Belgium
†LPMTM-UPR9001,University Paris 13, 99 av. J.B. Clément, 93430 Villetaneuse, France
Abstract. The goal of this research is to study the anisotropic material behavior during forming processes, represented by both complex yield loci and kinematic-isotropic hardening models. A first part of this paper describes the main concepts of the ‘Stress-strain interpolation’ model that has been implemented in the non-linear finite element code Lagamine. This model consists of a local description of the yield locus based on the texture of the material through the full constraints Taylor’s model. The texture evolution due to plastic deformations is computed throughout the FEM simulations. This ‘local yield locus’ approach was initially linked to the classical isotropic Swift hardening law. Recently, a more complex hardening model was implemented: the physically-based microstructural model of Teodosiu. It takes into account intergranular heterogeneity due to the evolution of dislocation structures, that affects isotropic and kinematic hardening. The influence of the hardening model is compared to the influence of the texture evolution thanks to deep drawing simulations.
INTRODUCTION
An accurate description of the material’s behavior is required to obtain valuable finite element predictions in sheet forming processes. From a numerical point of view, a key point is therefore the yield locus defining the plastic behavior of the material. The shape of the yield locus can be captured accurately thanks to micro-mechanical models based on the crystallographic texture of the material. The size of the yield locus, i.e. the isotropic hardening is related to the dislocation density while the kinematic hardening defines the position of the yield locus in the stress space and is associated to the process of dislocation pile-up. Furthermore, it is well-known that plastic deformations induce texture evolution which is responsible of an evolution of the mechanical behavior of the material. This can be taken into account through an evolution of the yield locus shape.
In order to take all these features into account during FEM simulations, the combination of a texture based yield locus (see [1]) and the Teodosiu’s hardening model (see [2]) has been implemented in the
FE code LAGAMINE (developed at the M&S department of the University of Liège).
The texture based yield locus which allows the computation of the texture evolution within sensible computation time is based on Taylor’s model and is described in the next paragraph (MINTY constitutive law). The Teodosiu’s hardening model is also described.
A deep drawing application is presented in this paper. The effect of the hardening behavior and the effect of the texture evolution are assessed through the analysis of the final geometry of the cup and the final material behavior (using the Lankford’s coefficients).
Beside the presented constitutive law, the Hill 1948 [3] yield criterion is also available combined with Teodosiu’s hardening model. On the other hand, another texture based yield locus (ANI3VH) has been investigated (see [4]). It consists of a global yield locus formulation defined by an analytical sixth order series in stress space. The analytical yield locus is fitted on numerous points computed by Taylor’s model. The
main difference between MINTY and ANI3VH is the formulation of the yield locus (global-local). ANI3VH is only available with the Swift hardening model, while the Hill yield locus and MINTY are combined with Teodosiu and Swift models.
NUMERICAL MODELS
Local Yield Locus Approach
Interpolation Formulation
The ‘Stress-strain interpolation’ model, which is the main originality of the texture based constitutive law MINTY, is particular in the sense that it does not use a yield locus formulation neither for the interpolation nor in the stress integration scheme. It uses a linear stress-strain interpolation described by equation (1).
τ
= ⋅ •
s
C u
(1)In this equation, σ is a 5-D vector containing the deviatoric part of the stress; the hydrostatic part being elastically computed according to Hooke’s law. The 5-D vector u is the deviatoric plastic strain rate direction; it is a unit vector. τ is a scalar describing the work hardening. Its evolution is obtained from the hardening model.
The interpolation is included in the matrix C of Equation 1 and is based on the following concepts. We assume 5 directions: ui (i=1…5) advisedly chosen in
the deviatoric strain rate space and the associated deviatoric stress: σi (i=1…5) lying on the yield surface according to Taylor’s model. These points define the interpolation domain and are called stress nodes. Additionally, we compute the contravariant vectors ssi
and uui defined by equations (2) and (3).
i
•
j=
δ
ijss
s
(2)i
•
j=
δ
ijuu
u
(3)With the use of those contravariant vectors we define intrinsic co-ordinates in the interpolation
domain. For any stress vector σ*, the intrinsic co-ordinates are computed by projection according to
equation (4) and for any plastic strain rate direction u* with equation (5). * i i
η
= •
s
ss
(4) * i iη
= •
u
uu
(5) The most important assumption of our stress -strain interpolation states that if the stress σ* and the plastic strain rate direction u* physically correspond to each other, then the intrinsic co-ordinates ηi computed for σ*(equation (4)) or for u* (equation (5)) are equal.
The interpolation is achieved with the use of those intrinsic co-ordinates to compute the stress or the strain rate with a common formulation:
i i i
η
=
∑
⋅
s
s
(6) i i iη
=
∑
⋅
u
u
(7)Combining equations (5) and (6), we can compute the stress associated to a plastic strain rate direction and get the expression of the interpolation matrix C (the hardening not being taken into account here):
i i i =
=
∑
⋅
•
Cs
s
uu
u
1424
3
(8)As long as the interpolation is achieved in the domain delimited by the 5 stress nodes, all the 5 ηi
remain comprised between 0 and 1. When one of the 5
ηi becomes negative, it means that the current stress is
out of the domain and an updating of the stress nodes must take place. The classical updating method consists of finding 5 new stress nodes defining a new domain containing the current stress direction. An improved updating method makes use of the adjacent domain. Therefore, only 1 new stress node is computed with Taylor’s model and 4 of the 5 old stress nodes are kept for the interpolation. The main advantages of this method are that it requires only 1 (instead of 5) call to Taylor’s model for an updating and it improves the continuity of the resulting yield locus and the continuity of its normal.
Stress Integration Scheme
As already mentioned, the stress-strain interpolation relation (equation (1)) does not use the concept of yield locus in a classical way. So, a specific integration scheme has been developed. An iterative procedure is used to find the plastic strain rate associated to the stress state at the end of the time step. As it has been observed during several finite element simulations, this stress integration scheme is well adapted for a local yield locus description and induces a reasonable number of interpolation domain updating.
Implementation of The Texture Updating
The principal characteristic of our texture updating model is that it is based on the application of the Taylor’s assumptions with a full constraint method on a discrete set of orientations representing the material’s texture (computed according to [5]).
It should be pointed out that the constitutive law is based on the interpolation method described earlier and on Taylor’s model applied on the actual set of crystallographic orientations. These orientations are represented with the help of Euler’s angles ranging from 0° to 360° for ϕ1 and from 0° to 90° for φ and ϕ2
so as to take crystal cubic symmetry into account but not the sample symmetry. In the code, a loop on the elements especially dedicated to texture evolution has been added in order to achieve the orientation set updating only after time step convergence. The lattice rotation of each crystal is also computed with Taylor’s model by subtracting the slip induced rotation from the rigid body rotation included in the strain history.
Hardening Models
The Teodosiu’s hardening model is described by 13 material parameters:
p R Sd SL X
C ,C , C ,C ,C ,
R ,S ,
Sat satX , Y , f , r , n , n
0 0 L (9)and depends on four state variables:
P
,S
,X
,R
(10) The variableP
is a second order-tensor that depicts the polarity of the persistent dislocation structures (PDSs in [6]) andS
is a fourth-order tensor that describes the directional strength of the PDSs. The scalarR
represents the isotropic hardening due to the randomly distributed dislocations and the second-ordertensor
X
is the back stress. These state variables evolve with respect to the equivalent plastic strain ratep&
with the formY
&
=
f Y p
( )
&
. A precise description of these evolution equations can be found in [1]. The yield condition is given byy
Y
0R
f | |
σ σ
=
=
+ +
S
(11) whereσ
is the equivalent stress, function ofs
−
X
,y
σ
is the current elastic limit,Y
0 is the initial size of the yield locus andR
+
f |
S
|
represents the isotropic hardening. The expression ofσ
depends on the definition of the yield locus.For comparison purposes, the classical isotropic Swift hardening is used. The formulation is:
(
)
n yC
0p
σ
=
ε
+
(12)where p is the cumulated equivalent plastic deformation, and
C,
ε
0 and n are material parameters.APPLICATION: DEEP DRAWING
The geometry of the deep drawing process proposed by [7] is used here. It consists of an axisymmetric deep drawing process with a punch having a flat bottom. The diameter of the blank is 100mm, the punch diameter is 50mm (the drawing ratio is then 2.0), the punch fillet radius is 5mm, the matrix opening is 52.5mm and the matrix fillet radius is 10mm. The blankholder force is prescribed to 5 kN. The Coulomb friction coefficient between the blank and the tools obtained with the experimental lubrication method is µ=0.05.
The material used is the FeP06t steel. It presents a significant initial anisotropy with Lankford coefficients ranging from 1.9 (at 45° from the rolling direction (RD)) to 2.24 (along RD and the transverse direction (TD)). The initial texture presents a γ-fiber typical of rolled steel sheets with a maximum of the ODF equal to 14.8. The hardening parameters of this steel are summarized in Table 1.
The geometry is axisymmetric. However, as the FeP06t steel sheet is orthotropic, a quarter of the process is studied. The blank is meshed with one layer of 531 BLZ3D elements (see [8]). The tools are
meshed with triangular foundation facets. One particular point of this deep drawing process is that the punch travel is not stopped before the whole blank has passed along the matrix shoulders. The mesh of the blank after deep drawing simulation is presented in Fig. 1.
TABLE 1. Hardening parameters for FeP06t steel.
Model Parameters Swift C=530.4 MPa, ε0=0.002524, n=0.277 Teodosiu CP=3.5, CR=50.8, CSD=6.9, CSL=6.67, CX=145.1, f=0.859, n=1.0, nP=48.9, r=8.5, Y0=114.9MPa, Rsat=29.7MPa, Ssat=245.8MPa, X0=16.0MPa
Earing Profile
The anisotropy of the steel sheet can be analyzed through the earing profile. As all the steel sheet is swallowed during the punch travel, the earing profile is measured by the cup height as a function of the angle from RD.
Figure 2 presents the earing profile computed by the constitutive law MINTY described above. The computation of the texture evolution has been activated (curves called “EVOL”) or not, i.e. the initial texture is used throughout the simulation (curves “MINTY”). The influence of the hardening behavior has also been analyzed. The isotropic hardening of Swift type is used (curves “SWIFT”) and the mixed hardening of Teodosiu presented above is also tested (curves “TEO”). According to Fig. 2, it appears that the influence of the hardening behavior on the earing profile is relatively small, especially when the texture
FIGURE 1. Deformed mesh for the deep drawing
simulation and localization of the studied element
is not updated. This is consistent with the results of [6]. The effect of the texture evolution is to reduce the mean cup height (of about 0.5 mm), and the shape remains almost identical.
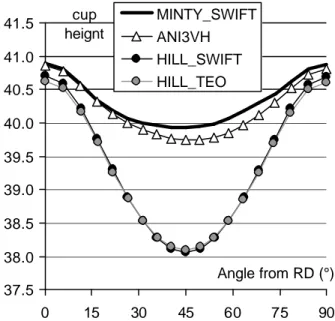
The Hill 1948 [3] yield locus has also been investigated for the deep drawing simulation. Figure 3 presents the earing profile obtained with the Hill law linked with the Swift hardening and the Teodosiu hardening. The influence of the hardening model is
38.5 39.0 39.5 40.0 40.5 41.0 41.5 0 15 30 45 60 75 90 Angle from RD (°) cup height MINTY_SWIFT MINTY_TEO EVOL_SWIFT EVOL_TEO
FIGURE 2. Earing profile for MINTY constitutive
law
FIGURE 3. Earing profile for Hill law and ANI3VH
37.5 38.0 38.5 39.0 39.5 40.0 40.5 41.0 41.5 0 15 30 45 60 75 90 Angle from RD (°) cup heignt MINTY_SWIFT ANI3VH HILL_SWIFT HILL_TEO
almost not existent on these curves. The global yield locus approach of ANI3VH has also been investigated. The earing profile is close to the one predicted by MINTY_SWIFT. These both models are indeed based on the Taylor’s model with a Swift isotropic hardening. The main difference is the definition of the yield locus.
Final Anisotropy
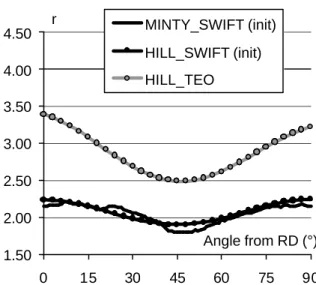
To characterize the final anisotropy of the steel sheet after deep drawing, we focus on the Lankford coefficients (r-values). For the particular finite element identified in Fig. 1, which is located at 45° from RD, the Lankford coefficient as a function of the angle from RD is computed on the basis of the final yield locus. The evolution of the Lankford coefficient with our constitutive law can be attributed to the texture evolution and to the kinematic hardening. The curve MINTY_SWIFT (no texture evolution and isotropic hardening) in Fig. 4 corresponds then to the initial Lankford coefficients of the FeP06t steel sheet. According to Fig. 4, it appears that, for the selected element, the effect of the texture evolution is limited while the influence of the kinematic hardening on the Lankford coefficient is large. The large influence of the kinematic hardening on the Lankford coefficient can also be observed with the Hill constitutive law (see Fig. 5). Note that, on Fig. 5, the curves HILL_SWIFT and MINTY_SWIFT both correspond to the initial Lankford coefficients; the difference between these curves is attributed to the different yield locus definition. 1.50 2.00 2.50 3.00 3.50 4.00 4.50 0 15 30 45 60 75 90 Angle from RD (°) r MINTY_SWIFT (init) MINTY_TEO EVOL_SWIFT EVOL_TEO
FIGURE 4. Evolution of the Lankford coefficients during deep drawing simulations with MINTY constitutive law
1.50 2.00 2.50 3.00 3.50 4.00 4.50 0 15 30 45 60 75 90 Angle from RD (°) r MINTY_SWIFT (init) HILL_SWIFT (init) HILL_TEO
FIGURE 5. Evolution of the Lankford coefficients with Hill constitutive law
FIGURE 6. Evolution of the hardening internal variables
-150 -100 -50 0 50 100 150 200 250 300 350 0 10 20 30 40 50 Punch travel (mm) MPa 0 1 2 3 4 Elasto- plastic Elastic
σ
eq|
S|
Sd|
SL|
Evolution of The Hardening Variables
Figure 6 presents the evolution of the hardening internal state variables for the Teodosiu model. The particular element identified by Fig. 1 has been investigated. The black thick lower curve shows the elastic (lower value) or the elasto-plastic (higher value) state of the material. As the selected element is initially just above the matrix shoulders, after a small elastic loading, the punch travel induces plastic strains. The bending of the steel sheet is in progress. After a punch travel of approximately 17mm, the bending of the zone including the selected element is finished; elastic unloading occurs. For a punch travel comprised between 25mm and 35mm, successive elastic and elasto-plastic states are observed.
The evolution of the equivalent stress (
σ
eq) is also presented in Fig. 6 (the upper gray thick curve). During the elastic loading,σ
eq is constant while it increases rapidly during the first elasto-plastic loading. After the unloading and even during the next elasto-plastic loadings,σ
eq remains constant. This behavior can be explained by a saturation of the hardening or more likely to a too low subsequent loading. Finally, Fig. 6 shows the evolution of the state variableS of the Teodosiu hardening model. The evolution of
its norm |S| is similar to the evolution of the equivalent stress. For a punch travel between 5mm and 10mm, there is no abrupt strain path changes but a continuous evolution of the plastic strain rate direction which is responsible of the increase of the latent part of S called
SL. During the elastic unloading, the values are
constant. The second elasto-plastic loading corresponds to an abrupt strain path change which activates SL while Sd the strength of S associated with
the currently active slip systems decreases suddenly. For a punch travel larger than 38mm, the zone around the selected element is only submitted to a rigid body translation without further loading; the subsequent elastic state is characterized by constant hardening variables.
CONCLUSIONS
One deep drawing process has been simulated by several constitutive laws. The influence of the hardening model and the texture evolution are analyzed through the earing profile and the final Lankford coefficients of the material. The Teodosiu’s hardening model does not have a significant influence on the earing profile (this is in agreement with the results of [6]), except if the texture evolution is
activated. Contrarily, the final Lankford coefficients are largely modified if the Teodosiu’s hardening model is used. The back stress, linked to the kinematic hardening, is at the origin of the evolution of the r-values. The abrupt strain path change observed during the deep drawing simulation can be captured by the Teodosiu’s hardening model (see Fig. 6). But, as it arises late during the simulation, it cannot influence the final geometry of the cup. Finally, a significant influence of the texture evolution has been noticed.
ACKNOWLEDGEMENTS
A. M. Habraken is mandated by the National Fund for Scientific Research (Belgium). The authors thank the Belgian Federal Science Policy Office (Contract P5/08) for its financial support.
REFERENCES
1. Habraken AM, Duchêne.L, Anisotropic elasto-plastic finite element analysis using a stress-strain interpolation method based on a polycrystalline model, in Int. J. of
Plasticity (in press)
2. Bouvier S., Teodosiu C., Haddadi H. and Tabacaru V., “Anisotropic Work-Hardening Behaviour of Structural Steels and Aluminium Alloys at Large Strains”, in J.
Phys. IV France 105 (2003), pp215-222
3. Hill R., “A theory of the yielding and plastic flow of anisotropic metals”, Proc. Roy. Soc. London A193, 1948, pp. 281-297.
4. Winters J., “Implementation of Texture-Based Yield Locus into an Elastoplastic Finite Element Code”, Ph. D. Thesis, 1996, KUL, Leuven, Belgium.
5. Toth L. S. and Van Houtte P., “Discretization techniques for orientation distribution function”, in Textures and
Microstructures, Volume 19, 1992, pp. 229-244.
6. Li S., Hoferlin E., Van Bael A., Van Houtte P., Teodosiu C., “Finite element modelling of plastic anisotropy induced by texture and strain-path change”, in Int. J.
Pla., 19, 2003, pp. 647-674.
7. Li S., Hoferlin E., Van Bael A., Van Houtte P., “Application of a texture-based plastic potential in earing prediction of an IF steel”, in Advanced Engineering
Materials, 3, No. 12, 2001, pp. 990-994.
8. Zhu Y.Y., Cescotto S., “Transient thermal and thermomechanical analysis by F.E.M.”, in Computers