1
UNIVERSITÉ DE MONTRÉAL
COMPARISON OF EPICARDIAL MAPPING AND NONCONTACT
ENDOCARDIAL MAPPING IN DOG EXPERIMENTS AND COMPUTER
SIMULATIONS
SEPIDEH SABOURI
INSTITUT DE GÉNIE BIOMÉDICAL
Département de physiologie
MÉMOIRE PRÉSENTÉ EN VUE DE L'OBTENTION
DU DIPLÔME DE MAÎTRISE ÈS SCIENCES APPLIQUÉES
(GÉNIE BIOMÉDICAL)
May 2013
2 Abstract
Atrial fibrillation is the most common clinical arrhythmia currently affecting 2.3 million patients in North America. To study its mechanisms and potential therapies, animal models of atrial fibrillation have been developed. Epicardial high-density electrical mapping is a well-established experimental instrument to monitor in vivo the activity of the atria in response to pacing, remodeling, arrhythmias and modulation of the autonomic nervous system. In regions that are not accessible by epicardial mapping, noncontact endocardial mapping performed through a balloon catheter may provide a more comprehensive description of atrial activity.
In this study, a dog experiment was designed and analyzed in which electroanatomical reconstruction, epicardial mapping (103 electrodes), noncontact endocardial mapping (2048 virtual electrodes computed from a 64-channel balloon catheter), and direct-contact endocardial catheter recordings were simultaneously performed. The recording system was also simulated in a computer model of the canine right atrium.
For simulations and experiments (after atrio-ventricular node suppression), activation maps were computed during sinus rhythm. Repolarization was assessed by measuring the area under the atrial T wave (ATa), a marker of repolarization gradients. Results showed an epicardial-endocardial correlation coefficient of 0.8 (experiment) and 0.96 (simulation) between activation times, and a correlation coefficient of 0.57 (experiment) and 0.92 (simulation) between ATa values.
Noncontact mapping appears to be a valuable experimental device to retrieve information outside the regions covered by epicardial recording plaques.
Keywords: Cantact epicardial mapping, Noncontact endocardial mapping, Atrial fibrillation, Balloon catheter, Cardiac computer model
3 Résumé
La fibrillation auriculaire, l'arythmie la plus fréquente en clinique, affecte 2.3 millions de patients en Amérique du Nord. Pour en étudier les mécanismes et les thérapies potentielles, des modèles animaux de fibrillation auriculaire ont été développés. La cartographie électrique épicardique à haute densité est une technique expérimentale bien établie pour suivre in vivo l'activité des oreillettes en réponse à une stimulation électrique, à du remodelage, à des arythmies ou à une modulation du système nerveux autonome. Dans les régions qui ne sont pas accessibles par cartographie épicardique, la cartographie endocardique sans contact réalisée à l'aide d'un cathéter en forme de ballon pourrait apporter une description plus complète de l'activité auriculaire.
Dans cette étude, une expérience chez le chien a été conçue et analysée. Une reconstruction électro-anatomique, une cartographie épicardique (103 électrodes), une cartographie endocardique sans contact (2048 électrodes virtuelles calculées à partir un cathéter en forme de ballon avec 64 canaux) et des enregistrements endocardiques avec contact direct ont été réalisés simultanément. Les systèmes d'enregistrement ont été également simulés dans un modèle mathématique d'une oreillette droite de chien.
Dans les simulations et les expériences (après la suppression du nœud atrio-ventriculaire), des cartes d'activation ont été calculées pendant le rythme sinusal. La repolarisation a été évaluée en mesurant l'aire sous l'onde T auriculaire (ATa) qui est un marqueur de gradient de repolarisation. Les résultats montrent un coefficient de corrélation épicardique-endocardique de 0.8 (expérience) and 0.96 (simulation) entre les cartes d'activation, et un coefficient de corrélation de 0.57 (expérience) and 0.92 (simulation) entre les valeurs de ATa.
La cartographie endocardique sans contact apparait comme un instrument expérimental utile pour extraire de l'information en dehors des régions couvertes par les plaques d'enregistrement épicardique.
Mots clés: Cantact cartographie épicardique, Noncontact cartographie endocavitaire, La fibrillation auriculaire, Cathéter à ballonnet, Modèle informatique cardiaque
4
Table of contents
Abstract ... 2 Résumé ... 3 List of figures ... 6 List of tables ... 11 List of abbreviation ... 12 Acknowledgment ... 13 Dedication ... 14 1 Introduction ... 151.1 Cardiac mechanical activity ... 16
1.2 Superior and inferior vena cava ... 17
1.3 Cardiac electrical activity ... 18
1.3.1 Cardiac action potential ... 19
1.3.2 Heart rate ... 23
1.4 Arrhythmia ... 26
1.4.1 Atrial fibrillation ... 27
1.5 Heart mapping system ... 29
1.5.1 Cardiac anatomical imaging system... 30
1.5.2 Three dimensional electroanatomical mapping system (EAM) ... 32
1.6 Computer modeling... 38
1.7 Forward and Inverse problem ... 40
1.7.1 Forward problem ... 41
1.7.2 Inverse problem... 41
1.8 Signal processing tools... 45
1.8.1 Activation time ... 45
1.8.2 Area under the atrial T wave ... 52
2 Article ... 55
2.1 Abstract ... 56
2.2 Introduction ... 56
2.3 Material and methods ... 58
2.3.1 Animal preparation ... 58
2.3.2 Experimental recording system ... 58
5
2.3.4 Simulation of epicardial electrograms ... 62
2.3.5 Simulation of noncontact endocardial electrograms ... 63
2.3.6 Processing of atrial electrograms ... 65
2.3.7 Correspondence between epicardial and endocardial maps ... 67
2.4 Results ... 67
2.4.1 Activation maps ... 67
2.4.2 Morphology of bipolar electrograms ... 69
2.4.3 Area under the atrial T wave ... 71
2.4.4 Temporal changes in area under the atrial T wave... 73
2.5 Discussion ... 75
2.6 Acknowledgments ... 78
3 Discussion ... 79
3.1 Activation time maps in the presence of neurogenically induced repolarization gradient80 3.2 SA node shift ... 83
3.3 ATa maps during neurogenically induced AF ... 84
3.4 Summary of advantages and disadvantages of mapping systems ... 86
6
List of figures
Figure 1.1- Heart anatomy include right and left atria and ventricles ………....17
Figure 1.2- Overview of blood circulation through the heart chambers………..18
Figure 1.3- Heart anatomy; Heart veins, valves, and vessels; Superior vena cava and inferior vena cava……….…....19
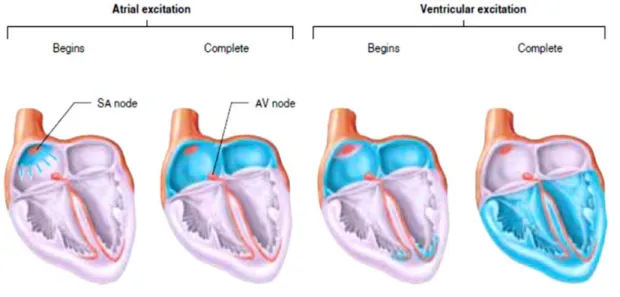
Figure 1.4- Heart electrical activity pathway; the blue color is correspond to the areas that are excited by depolarization waves………..………...21
Figure 1.5- (A) Heart electrical activity path and associated action potentials have been shown by blue color. Electrocardiogram (ECG) is equal to sum of the action potentials propagate in conduction path (B) Sinoatrial action potential on left side and ventricular action potential on right side ……….……...……….…….22
Figure 1.6- Sympathetic and parasympathetic effects on the SA node action potential………..25
Figure 1.7- Central nervous system block diagram……….……….…...26
Figure 1.8- Autonomic nerves system; (A) Parasymphetic nerve (B) Sympathetic nerve from spinal cord to heart………..………27
Fig1.9- Ablation procedure is shown by fluoroscopy imaging system. A: Before ablation. B: After ablation. CS: coronary sinus catheter. Eso: esophagus……….………32
Figure 1.10- (A) 4 healthy Pulmonary veins captured by CT. (B) Pulmonary vein of a patient with AF before undergoing radiofrequency ablation. Asterisks show the left atrial appendage A: healthy B: thrombus……….………..……...33
Figure 1.11- Left panel is a CARTO bipolar map and right panel is MRI images. The arrows indicate the location of scar in the two systems which is miss matched………..…………..34
7
Figure1.12- Epicardial mapping; five epicardial electrode plaques include: LAA, RAA—left and right atrial appendage; LAFW, RAFW—left and right atrial free wall; BB—Bachmann bundle; PV—pulmonary veins……….………37
Figure1.13- Non-contact mapping system; Balloon catheter; Asterisks are two rings electrodes that are used to construct cardiac geometry………37
Figure 1.14- Definition of the Forward problem; Arrows indicate the direction of computation which is from heart surface potential to the body surface potential; ∅His heart surface potential and ∅B is body surface potential……….………….…………44
Figure 1.15- Definition of the inverse problem; Arrows indicate the direction of computation which is from body surface potential to the heart surface potential. ∅His heart surface potential and ∅B is body surface potential……….….………...……….45
Figure1.16- Application of inverse problem in electrocardiography. The procedure of reconstruction of heart surface potential from body surface potential……….………..…46
Figure1.17- Application of inverse problem in the noncontact mapping. Balloon catheter is inside the cardiac chamber and compute the endocardial potential by solving inverse problem………..………..46
Figure1.18- The concept of activation time; (A) Action potential is going to reach to cell beneath the electrode (Depolarization phase). (B) Action potential has reached beneath the electrode (Repolarization). (C) Action potential is going to pass to adjacent cells (Rest)……….………..49
Figure1.19- Activation time mathematical definition is shown by red dot. (A) An atrial beat. (B) Derivative of A. (C) Transmembrane voltage……….…………..……….50
Figure 1.20- Activation times and ventricular beats are plotted for (A) Right ganglionic plexus and (B) for all experiments……….52
Figure 1.21: Concordance between epicardial and non-contact endocardial activation times for all catheter locations. The purple dots are non-contact endocardial activation times, the black
8
dots are epicardial activation times, and blue stars are ventricular beats………..………..……….…...……53
Figure1.22- Experimental activation times; (A) Activation times are plotted for one catheter location to notice the correspondence between the beats. (B) Activation times are mapped for the same beats. Anatomical locations are shown by the stars and arrows. SVC superior vena cava; IVC inferior vena cava, RAGP right atrium ganglionated plexus (catheter location)……….……..……….…………..55
Figure1.23- Simulated activation times; (A) Activation times are plotted for one experiment to notice the correspondence between the beats. (B) Activation times are mapped for the same beats. Anatomical locations are shown by the stars and arrows. SVC superior vena cava; IVC inferior vena cava, RAGP right atrium ganglionic plexus (catheter location)……….……..……….……....……..56
Figure1.24- The area under the atrial T wave; ATa is shown by green color……….……..….58
Figure 1.25- Baseline correction for computation of ATa……….………...59
Figure 2.1- Right atrium geometry and electrode configuration. (A) Endocardial surface of a canine right atrium as reconstructed by the EnSite NavX system (left side: anterior view; right side: posterior view). Anatomical features identified by the catheter localization system are shown in red. Blue stars represent recording sites of the direct-contact endocardial catheter (B) 3D geometrical model (same views as panel A) of the right atrium after processing. Dashed circles represent the location of heterogeneity regions, shown here with a radius of 3 mm. (C) Epicardial electrode position for the two plaques in the computer model. (D) Left side: Balloon catheter with its 64 electrode. Right side: closed endocardial surface used for the inverse problem. RAA: right atrium appendage; SVC: superior vena cava; IVC: inferior vena cava; TV: tricuspid valve; CS: coronary sinus; SAN: sinoatrial node; RAGP: right atrium ganglionated plexus; IA: inter-atrial bundles……….………..65
Figure 2.2- Endo- and epicardial activation maps in the experiment (A-C) and in the computer model (D-F). (A) Color-coded experimental endocardial activation map. White dots represent epicardial electrode positions. The white star denotes the earliest activation point. (B)
9
Experimental epicardial activation map for the same atrial beat. (C) Epi- vs. endocardial experimental activation times, along with the linear regression curve (dashed black line), for the three beats (each shown with a different color) that served to identify epicardial plaque location. (D) Simulated endocardial activation map in control. (E) Simulated epicardial activation map. (F) Epi- vs endocardial simulated activation times. SVC: superior vena cava; IVC: inferior vena cava; RAA: right atrium appendage; BB: Bachmann's bundle; RAGP: right atrium ganglionated plexus……….…….75
Figure 2.3- Morphology of direct-contact (catheter) and non-contact bipolar electrograms for 7 recording sites in the experiment and in the computer model. SVC: superior vena cava; RAGP: right atrium ganglionated plexus; IA: inter-atrial bundles; CS: coronary sinus………..………...……77
Figure 2.4- Examples of unipolar epicardial and noncontact endocardial electrograms measured at corresponding epi- and endocardial sites (both experimental and simulated). The area under the atrial T wave is displayed as a shaded area. Simulated signals are saturated to highlight their atrial T wave……….…….…………..78
Figure 2.5- Endo- and epicardial ATa maps in the experiment (A-C) and in the computer model (D-F). (A) Color-coded experimental endocardial ATa map. White dots represent epicardial electrode positions. (B) Experimental epicardial ATa map for the same beat. (C) Epi- vs. endocardial experimental ATa for all beats combined, along with the linear regression curve and 50% confidence interval. Data point density estimated by kernel-based method is displayed as contour lines. (D) Simulated endocardial ATa map in the presence of repolarization heterogeneity with a radius of 3 mm around the white star. (E) Simulated epicardial ATa map for the same beat. (F) Epi- vs. endocardial ATa for all simulations with different repolarization heterogeneity distributions. SVC: superior vena cava; IVC: inferior vena cava; RAA: right atrium appendage; BB: Bachmann's bundle; RAGP: right atrium ganglionated plexus………...………...79
Figure 2.6- Endocardial ATa maps. (A) First experimental beat. (B) Another beat at a later time. (C) Difference between maps A and B. (D) Simulated ATa map during sinus rhythm in a uniform substrate. (E) Simulated ATa map with repolarization heterogeneity (3 mm radius in the
10
right atrium ganglionated plexus; shown as a dashed circle). (F) Difference between maps D and E………..……….81
Figure 3.1- The upper diagram is a schematic view of 2 plaques carrying 103 unipolar recording contacts distributed over the entire right atrial epicardial surface (SVC, IVC –superior and inferior vena cava; RAA- right atrial appendage; RAFW- right atrial free wall). The unipolar epicardial electrogram demonstrates responses of the right atrium to the electrical stimuli which were delivered to the vagal nerve. It illustrates the sinus rhythm followed by tachycardia, bradycardia, and atrial fibrillation. Epicardial maps demonstrate activation pattern of the selected beats. Beat 1 to 5 (group B) are basal beats or sinus rhythms in which the earliest epicardial activations (shown by asterisks) are started from SVC- SA node located in the SVC- then continued toward inferior portion of the right atrium, and finally terminated in the IVC and RAA. Group C (tachycardia), the earliest epicardial activations start from inferior right atrial regions i.e. the areas where the earliest activation shifted to the locations in IVC; and terminated at RAA which are indicated as irregularities in the heart’s electrical activity pathways. It can be seen that the electrical activities are completely erratic in the last beat of this group. Finally, the latter beats are bradycardia before AF where earliest activations were shifted toward RAFW. The last map is atrial fibrillation which is difficult to interpret due to presence of multiple breakthrough areas……….88
Figure 3.2- (A) Unipolar endocardial electrograms of same case as the previous figure. AF started after 4 beats. (B) The earliest endocardial activation, shown by asterisks for the 4 beats, is caudally shifted from superior portion toward inferior portion of the right atrium. Atrial beat is started from IVC toward SVC instead of starting from SVC. The origin of activation is
developed towards RAFW in last two beats……….……..…….89
Figure 3.3- (A) Electrical activity starts from superior portion of right atrium or SVC. (B) It is longer lasting in the peripheral and inferior reigns of SVC than SA node center. The earliest endocardial activation time is shown by asterisks………..………91
Figure 3.4- The repolarization gradient heterogeneity of the atria during sinus rhythm (A) and neurogenically induced atrial fibrillation (B)……….……….………92
11
List of tables
Table 1.2- Summary of the autonomic nerves system effects on the heart…………...…….…28
Table 3.1- Summary of characteristic of contact epicardial mapping and non-contact endocardial mapping………..…..93
12
List of abbreviation
ATa: Area under the atrial T wave
AV: Atrioventricular
SVC: Superior vena cava
IVC: Inferior vena cava
SA: Sinoatrial
ECG: Electrocardiogram
AF: Atrial fibrillation
APD: Action potential duration
CT: Computed tomography
MRI: Magnetic resonance imaging
EAM: Electroanatomical mapping system
RAT: right atrial tachycardia
13
Acknowledgment
I would like to express my sincere gratitude to my advisors Dr. Vincent Jacquemet for the continuous support of my MS study and research, for his patience, motivation, enthusiasm, and immense guidance. First and most, I would like to thank him from the bottom of my heart for all their contributions, guidance, remarkable/practical ideas, and encouragement. I could not have imagined having a better advisor and mentor for my Master study. Throughout my research period, he provided encouragement, sound advices and lots of good ideas.
Thanks Dr. Vincent Jacquemet.
I would also like to thank the members of my defence committee, Dr. Pierre A. Mathieu and Dr. Philippe Comtois for taking their valuable time to examine my thesis.
My special thanks to faculty and staff of the UdeM Institute of Biomedical Engineering who have been always helpful.
My deepest heartfelt gratitude goes out to my husband, Hamid and my mother, Pooran, and my father, Kamran. Words simply cannot express my gratitude for their love and support.
14
Dedication
This thesis work is dedicated to my husband, Hamid, who has been a constant source of support and encouragement during the challenges of graduate school and life. I am truly thankful for having you in my life. This work is also dedicated to my parents, Kamran and Pooran, who have always loved me unconditionally and whose good examples have taught me to work hard for the things that I aspire to achieve.
15
Introduction
During atrial arrhythmias, electrical activity in two upper chambers of heart (atria) is chaotic and causes fibrillating (i.e., quivering) instead of achieving coordinated contraction. Repetitive episodes of arrhythmias may cause further pathological changes1. The autonomic nervous system, such as vagal and mediastinal nerves, can modulate electrophysiological and dynamical properties of heart2. The automatic nervous system also plays a significant role as a potential trigger of atrial fibrillation, especially in early stage of diseases. Therefore, knowledge about anatomy, function and electrical/mechanical activity of the heart is required for a better understanding the sources of heart dysfunction.
Our aim is to compare two cardiac mapping systems, namely contact epicardial mapping and noncontact endocardial mapping, in dog experiments and computer simulations in terms of their ability to describe and characterize atrial depolarization and repolarization. Cardiac mapping systems provide valuable tools for diagnosis and treatment of cardiac arrhythmias. In addition, many fundamental insights about atrial fibrillation can be derived from animal models. Computer models have been developed based on bioelectrical and mathematical formulation of cardiac impulse propagation to assist in interpretation of cardiac electrical activity using forward and inverse problem.
In this chapter, we will first look at heart anatomy and electrophysiology. Secondly, an introduction about cardiac mapping systems will be presented. Furthermore, we will review computer models of the heart and their applications to the interpretation of bioelectric signals. Finally, basic mathematical definitions for computation and interpretation of cardiac electrical activity called forward and inverse problems will be discussed.
16 1.1 Cardiac mechanical activity
Heart is a muscular organ consisting of two right and left chambers, each side consisting of an atrium and a ventricle shown in figure 1.1. Atria and the ventricles are connected through atrioventricular (AV) valves, which allow blood to circulate within the heart.
Figure 1.1- Heart anatomy include right and left atria and ventricles (Reproduced from www.webmd.com/heart/chambers-of-the-heart3
).
Inner and outer layers of the heart are composed of cardiac muscle cells called endocardium and myocardium, respectively. The cardiac-muscle cells of the myocardium are settled in layers and make contact with adjacent cardiac-muscle cells through gap junctions, and they completely cover the cardiac chambers4.
The function of heart is to pump oxygen-rich blood to the other organs in the body. In order to pump blood, the heart needs to complete a cardiac cycle (heartbeat) which consists of cardiac muscle contraction and relaxation. The conducting system of the atria initiates a heartbeat. The human heart beats approximately 80,000 to 100,000 a day and pumps almost 2,000 gallons of blood, which means the heart of a person living 70 to 90 years, beats approximately two to three
17
billion times and pumps 50 to 65 million gallons of blood4. A heartbeat consists of systolic and diastolic phases (figure 1.2)5:
Diastole: The atria start to become filled with oxygen-poor blood, while ventricles are relax and
not contracting. At the end of this stage, atria pumps blood through the AV valves (mitral or tricuspid valve) into the ventricles.
Systole: In this stage, ventricles contract which allows the blood to be pumped to the other
organs.
Figure 1.2- Overview of blood circulation through the heart chambers (Reproduced from Widmaier et al.4
).
1.2 Superior and inferior vena cava
The Superior Vena Cava (SVC) and the Inferior Vena Cava (IVC) are two large veins connected to right atrium shown in figure 1.3. These veins are responsible for bringing deoxygenated blood
18
to the heart. The superior vena cava carries blood from the upper part of body and the inferior vena cava carries blood from the lower part of body to right atrium.
The mapping systems we are going to use can label SVC and IVC on a reconstructed geometry representing the right atrium. These two anatomical elements will serve as reference landmarks to help identify locations within the right atrium. .
Figure 1.3- Heart anatomy; Heart veins, valves, and vessels; Superior vena cava and inferior vena cava (Reproduced from nyp.org/health/cardiac-anatomy.html6).
1.3 Cardiac electrical activity
As previously described, the main function of the heart, initiated by the atrial contraction followed by the ventricles, is to pump the oxygen-rich blood to body. Cardiac muscle is a smooth muscle whose contraction is triggered by the depolarization of the plasma membrane of the cardiac muscle cells. Membrane depolarization initiates a sudden increase of electrical activity, known as action potential. This initiation starts in a group of cells located in the sinoatrial (SA)
19
node in right atrium near the entrance of superior vena cava and propagates into and throughout the atria and then the ventricles as shown in figure 1.44.
The cardiac impulse travels from the SA node through the internodal pathways to the atrioventricular node (AV node). The action potential or impulse is delayed slightly at this point to allow complete emptying of atria before ventricles contract; continues through the AV bundle and down the left and right bundle branches of the Purkinje fibers. The Purkinje fibers conduct the impulse to all parts of ventricles, causing contraction.
Figure 1.4- Heart electrical activity pathway; the blue color is correspond to the area that is excited by the depolarization waves (Reproduced from Widmaier et al.4).
1.3.1 Cardiac action potential
20
Figure 1.5- (A) Heart electrical activity path and associated action potentials have been shown by blue color. Electrocardiogram (ECG) is equal to sum of action potentials propagate in conduction path (B) Sinoatrial action potential on the left side and ventricular action potential on the right side (Reproduced from bentollenaar.com/_MM_Book/Ch.19.htm7).
Pacemaker potential
21
The numbers on the action potential graphs (figure 1.5) indicate different phases:
Phase 0: Voltage-gated sodium channels open and increase the concentration of Na+ inside the cell; at the same time, the permeability to potassium decreases. Therefore, the membrane potentials start to be positive which is termed as depolarization phase of the action potential.
Phase 1: The voltage-gated sodium channels quickly close to prevent rising sodium
permeability; membrane potential decrease to 0 mV. As well, outward movement of the potassium starts in this phase by the opening of slow delayed potassium channels.
Phase 2: Calcium permeability increases which causes membrane to remain depolarized at 0
mV. As a result, the gradient of the calcium ions into the cell will be more than the gradient of the potassium ions out of the cell; known as a plateau phase.
Phase 3: The calcium channels are closed while the potassium channels are still open,
consequently, the membrane permeability to calcium decreases and potential falls down to the rest potential. This process is known as a repolarisation phase.
The action potential of the cardiac cell, either atrial or ventricular cell, is similar except that the plateau phase of atrial cells is shorter than the ventricular cells. The resting potential of SA cells is not steady (upward potential drift).
Pacemaker potential is defined as threshold above which action potentials is triggered. The potential in the SA node cells spontaneously crosses the threshold to provide self-excitation or automaticity. Some cells located in the conducting system exhibit automatic activity like SA node cells; they are termed ectopic pacemakers.
22
The AV node - defined as an anatomical feature for electrical connection between right atrium and right ventricule - can be affected by some diseases and pharmacological substances. In our project, we disassociated the ventricular activity from atrial activity by using a drug. Consequently, the AV node could not transfer the impulse from atrial to ventricular which allowed us to isolate the atrial electrical activity.
The electrocardiogram (ECG) is obtained by the summation of the all action potentials present in the heart as shown in the figure 1.5 A. ECG is used to follow electrical events within the heart. Generally, physicians divide a normal ECG into three parts:
1) P wave: Atrial depolarization or atrial contraction. Usually, atrial repolarization cannot be seen in the ECG signal. It is hidden by the ventricular depolarization phase or QRS complex. It also has relatively small amplitude.
2) QRS complex: Usually happens after 0.15s and corresponds to ventricular depolarization or contraction. It has more deflections as compared to P wave due to the path taken by the impulse to propagate through the ventricles; lead to different depolarization waves. 3) T wave: Ventricular repolarization.
As already mentioned, atrial repolarization is usually masked by ventricular depolarization. Hence, we will analyze atrial electrogram waveforms outside of ventricular activity after AV node suppression to have access to atrial repolarization waves.
While the ECG can provide global information about cardiac electrical activity, it does not give detailed electrophysiological information about individual cardiac cells.
23 1.3.2 Heart rate
The conducting system of the heart can be affected by hormones and nerves. Neuronal elements like sympathetic and parasympathetic postganglionic fibers in the SA node can change heart rate to a much higher (over 100 beats per minute) or lower value (below 50 beats per minute) than normal condition4. Generally, parasympathetic activities are stronger than sympathetic activities in a healthy heart. Heart rate is increased by sympathetic nerves activation whereas; parasympathetic nerves have an opposite effect (figure 1.6).
Figure 1.6- Sympathetic and parasympathetic effects on the SA node action potential (Reproduced from Widmaier et al.4).
As shown in the figure 1.6, the slope of the pacemaker potential increases during sympathetic nerve stimulation which cause the SA-node cells reach their threshold more rapidly. Hence, it will increase heart rate. Conversely, the slope of the pacemaker potential decreases by stimulation of parasympathetic nerves, cells reach to their threshold more slowly, and heart rate decreases.
24
A summary of central nervous system, branches, and their effects are described in the figure 1.7, as well as, the sympathetic/parasympathetic nerves with their connection to the heart are shown in the figure1.8.
Figure 1.7- Central nervous system block diagram
Central nervous system
Somatic nervous
system movementsVoluntary
Autonomic nervous system Sympathetic Alpha receptors Accelerates heartbeat Beta receptors
25
Figure 1.8- Autonomic nerves system; (A) Parasymphetic nerve (B) Sympathetic nerve from spinal cord to the heart.
The neurotransmitters released by the sympathetic and parasympathetic nerves can change the pacemaker potential. The parasympathetic neurotransmitters, like norepinephrine, increase the sodium current into the cell by opening the voltage-gated sodium channels to initiate depolarization phase. On the other hand, sympathetic neurotransmitters, such as acetylcholine, close them to prevent early depolarization phase4.
Vagus nerve (Parasympathetic) To SA node To AV node Spinal cord Synaptic junction Ach release
Sympathetic chain ganglion
To AV node To SA node A
26
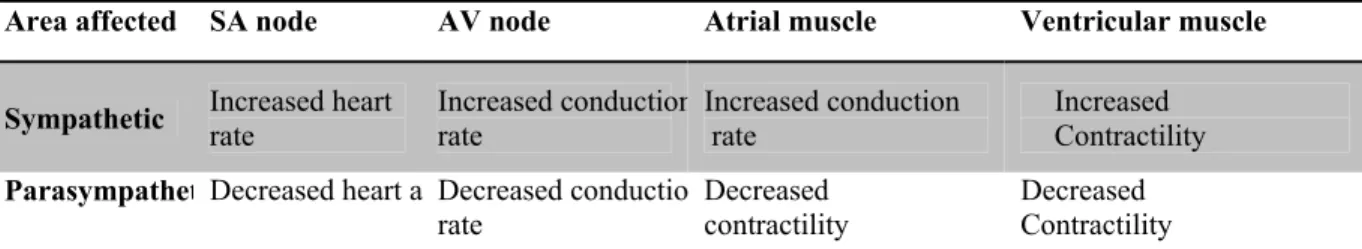
The rate of spread of excitation (conduction velocity) through the conduction system increases by sympathetic stimulation and decreases by parasympathetic stimulation.
Table 1.2 Summary of the autonomic nerves system effects on the heart
1.4 Arrhythmia
An arrhythmia is a well-known heart disease, observed as an irregularity in heart rhythm including beating too fast or too slow. Several physiological and anatomical factors, such as problems with the electrical conduction system of the heart, some substances or drugs, and abnormal heartbeats may trigger cardiac arrhythmias. Mechanisms of cardiac arrhythmias include:
1) Generation of abnormal or extra excitation waves 2) Slow conduction or conduction block
3) Traveling along abnormal pathways or circuits through the heart, called reentry.
In addition, electrophysiological and neurological substrate of the heart - such as alteration of the cellular membrane kinetics, anatomical abnormalities, and perturbations of the neurovegetative balance - can initiate heart arrhythmias8.
It has also been recognized since 1914 that atrial arrhythmias can be induced by stimulation of autonomic nervous system9-13.
Area affected SA node AV node Atrial muscle Ventricular muscle
Sympathetic Increased heart rate Increased conductionrate Increased conduction rate Increased Contractility ParasympathetDecreased heart a Decreased conductio
rate
Decreased contractility
Decreased Contractility
27
Reentry is one of the important mechanisms which can maintain important arrhythmias like atrial fibrillation, atrial flutter, atrioventricular (AV) nodal reentry, etc.14. In atrial fibrillation and flutter, reentrant circuits are located in the atrial myocardium. Circuits can also be found in the SA node or in the AV node (SA or AV node reentry). Finally, ventricular tachycardia is maintained by a circuit located in the ventricles.
1.4.1 Atrial fibrillation
Atrial fibrillation (AF) is the most common cardiac arrhythmia that causes 15% to 20% of strokes. AF currently affects 2.3 million patients in North America alone 15. In the age of 50-60 and 80 years or older the prevalence are, respectively, 0.5% and 8.8%. Age, gender, race and cardiovascular diseases (hypertension, congestive heart failure, myocardial infarction, and valvular disease) are some factors that affect AF prevalence. The risk of AF development in men is higher than women at all ages16.
AF increases risk of stroke, impairs quality of life, decreases work efficiency, and increases rates of hospitalization. In 2004, AF caused losing over 9 million working days. In 2006, estimated cost of AF-associated stroke was $12 billion16. AF presents a considerable challenge for patients, clinicians, and hospital managers, due to increasing prevalence, frequent complications, and large expenses. New diagnostic methods and treatments are essential to provide best care for these patients.
During AF, electrical activity in the two upper chambers (atria) of the heart is chaotic and causes fibrillating (i.e., quivering), instead of achieving coordinated contraction. Ventricular response causes poor blood flow to the body. AF may cause pathological changes (AF-induced remodeling) which include dilatation of the atrial chambers, fibrosis and loss of cell-to-cell
28
coupling, that can facilitate progression of the heart arrhythmias ("AF begets AF")1. The autonomic nervous system also plays a significant role in AF, especially at its early stage (vagal AF)16.
The mechanisms of human atrial fibrillation are poorly understood. Moe and Abildskov17 have defined the random propagation of multiple wavelets across the atria as AF. This hypothesis has been verified experimentally by Allessie et al18. They demonstrated that sustained AF consists of four or six wavelets in dogs. Clinically, different forms of AF are observed. It often starts as transient self-terminating arrhythmia and becomes more persistent with time. It may be highly symptomatic (palpitations, dizziness, fainting, fatigue, shortness of breath, chest pain), or remain completely unnoticed. It is secondary to hypertension, coronary heart disease, valvular dysfunction, or heart failure but may also occur in the absence of organic heart disease (lone AF)16.
The presence of AF can be confirmed either in the electrocardiogram (ECG) by the absence of P waves or by an irregular ventricular rate. Therefore, biophysics underlying the P wave which is atrial depolarization and repolarization must be studied. Certainly, it helps us to discover more about the initiation of heart arrhythmias.
Action potential duration (APD)19can act as middle for AF development. It is defined as the time when cell reaches to the excitation threshold and starts to be depolarized till the time cell excitability is restored. APD shortening can increase the arrhythmogenicity of the substrate. Focal activation or circuits of macroreentry also promote or facilitate the initiation and maintenance of AF. Wavelength, which is defined as the distance travelled by an impulse during the refractory period, is one of the factors that affect the maintenance of arrhythmias. It is
29
calculated as the product of conduction velocity by refractory period. Researchers have shown that refractoriness is shorter in the left atrium than in the right atrium20,21.The Na+ current (I ) is a significant factor leading to the conduction velocity variation. Diminishing I can cause reduction of conduction velocity and wavelength shortens; hence, diminishing I may help maintain AF.
The American College of Cardiology, American Heart Association, and European Society of Cardiology divide AF into three categories: paroxysmal, persistent, and permanent22. A recurrent wavelet self terminates in less than 7 days is paroxysmal AF. Localized sources leading to fibrillatory conduction cause paroxysmal AF. Moreover, random multiple-wavelet reentry decreases the likelihood of self-termination. A recurrent wavelet for more than 7 days is called persistent AF. Permanent AF means that the recurrent wavelet is present in the long term and the heartbeat cannot be reverted back to a normal rhythm.
Understanding the electrophysiology underlying heart action potential like depolarization and repolarization phases, APD, conduction velocity etc. not only can help physicians for detection of ectopic beat and making a good surgical ablation strategies but also engineers can have better understanding of AF mechanisms, and consequently, they can design better future catheters used in treatments.
1.5 Heart mapping system
Heart mapping systems allows physicians and scientists to investigate heart diseases, notably heart rhythm disturbances. In this section we will look at the heart anatomical and electrophysiological mapping technologies and their role in understanding the genesis of arrhythmias.
30 1.5.1 Cardiac anatomical imaging system 1.5.1.1 Fluoroscopy
Fluoroscopy uses x-ray to visualize the motion of liquid and anatomical structure of a patient. This system has been the first imaging system used in catheter ablation procedure of atrial fibrillation. Catheter ablation procedure using fluoroscopy is shown in the figure 1.9. The radiation exposure time is critical for patient and operator safety during ablation, especially for long and repetitive procedures.
Figure 1.9- Ablation procedure is shown by fluoroscopy imaging system. A: Before ablation. B: After ablation. CS: coronary sinus catheter. Eso: esophagus (Reproduced from Natale et al.22
).
1.5.1.2 Computed tomography
Cardiac computed tomography (CT) system is a non-invasive heart imaging system that uses an x-ray machine rotates around patient body and takes clear and detailed picture of the desired organ. CT can be used to reconstruct the geometry of pulmonary veins since it is the major anatomical region in the atria with high likelihood of atrial fibrillation triggers (figure 1.10). These images can be used for AF treatment notably navigation of the catheter during ablation procedure. However, access to the anatomical structure alone is not sufficient to identify cardiac diseases.
31
Figure 1.10- (A) 4 healthy Pulmonary veins captured by CT. (B) Pulmonary vein of a patient with AF before undergoing radiofrequency ablation. Asterisks show the left atrial appendage A: healthy B:throumbus(Reproduced from Prat-Gonzalez et al23)
1.5.1.3 Magnetic resonance imaging
Magnetic resonance imaging is a non-invasive and radiation-free system for generating organ and tissue images. Cardiac MRI has been used to obtain pictures of the beating heart and to evaluate its structure and function. Mostly, MRI is used to improve treatment procedure such as radiofrequency ablation by its role in pre-surgical planning, preacquired anatomical mapping used during the procedure itself, and post-surgical confirmation of the integrity of the procedure. MRI images with 3-D electroanatomical navigation systems such as CARTO XP EP Navigation System by Biosense Webster and EnSite™ System by St. Jude Medical can be an excellent combination to facilitate catheter navigation, pre-procedure planning, and therapy delivery for arrhythmia (figure 1.11).
32
Figure 1.11- Left panel is CARTO bipolar map and right panel is MRI images. The arrows indicate the location of scar in the two systems which is miss matched ( Reproduced from Cordreanu et al.24
). 1.5.2 Three dimensional electroanatomical mapping system (EAM)
Why AF is difficult to treat? one of the reasons is that we lack a good understanding of its causes. AF can change the pathophysiological and electrophysiological aspects of underlying tissue (remodeling) which results in other electrical and mechanical adaptations that aggravate the vulnerability to AF. One option to determine and observe degree of remodeling is to measure electrical changes from the inside of the heart by means of electroanatomical mapping systems.
Electroanatomic mapping systems (EAM) include Biosense CARTO, EnSite/NavX, Non-contact mapping, and Real-Time position management system. They are used to gain access to the electrophysiological substrate of the heart. They display activation and propagation maps on three dimensional geometry of cardiac chamber of interest by non-fluoroscopic catheter. This
33
facilitates and increases accuracy of ablation procedure. Each EAM system has its own strengths and weaknesses, and should be chosen based on the information that we need (activation mapping, substrate mapping, and cardiac geometry) for therapy.
The EAM systems allow operators to observe the location of origin of arrhythmia or ectopic beat in cardiac chamber geometry and catheter manipulation without fluoroscopic guidance. EAM system advantages such as less fluoroscopy time, less radiation dose, and procedure time have been proved by several studies. The most significant of these is its application to treatment of atrial fibrillation25-33.
In summary, here are the main advantages of EAM as compared to the conventional mapping system:
1. Facilitates cardiac arrhythmia mapping and ablation procedure 2. Reduced fluoroscopy time
3. Radiation dose 4. Procedure time
In our study, we used EnSite NavX system to preform catheter navigation and localization in the canine right atrium. It was also used to reconstruct canine right atrium geometry for creating the computer model which will be discussed in the method section.
1.5.2.1 Contact epicardial mapping
Epicardial mapping is an experimental tool to study the electrophysiological characteristics of the atrial fibrillation. This system simultaneously records electrical activity from several or even hundreds of electrodes placed directly on the epicardium during open-chest surgery. We need information from all anatomical location of the heart for mapping characteristics of AF- chaotic
34
and rapidly changing of activation. Our system (Figure 1.12) consists of 5 silicone plaques with 191 unipolar recording contacts (4.6–5.9 mm spacing) were positioned on (1) Bachmann bundle and adjacent base of the medial atrial appendage on the right and the left side, (2) the right atrial free wall and lateral right atrial appendage, (3) the left atrial free wall, (4) the lateral left atrial appendage, (5) the dorsal left atrial wall between the pulmonary veins to cover entire atria.
Contact endocardial mapping is also possible using an inflatable balloon constructed with nylon and with 64 electrodes placed on its surface34. This balloon is inserted in the atrial chamber through an incision in the atrial appendage. The balloon is inflated to ensure contact with the endocardium. Continuous recording over multiple beats is difficult since the balloon has to be deflated to avoid affecting too much cardiac hemodynamics.
(A) (B)
Figure 1.12- (A) Epicardial mapping system; (B) Five epicardial electrode plaques include: LAA, RAA—left and right atrial appendage; LAFW, RAFW—left and right atrial free wall; BB—Bachmann bundle; PV— pulmonary veins
35 1.5.2.2 Non-contact endocardial mapping
The EnSite Array multielectrode array (MEA; Endocardial Solutions, St. Jude Medical, Inc., St. Paul, MN, USA) is a new technology for non-contact cardiac electroanatomic mapping (figure 1.13). It has been Introduced in 200135and is able to produce three dimensional pictures of the electrical activity of the cardiac chamber of interest.
Figure 1.13- Non-contact mapping system; Balloon catheter; Asterisks are two rings electrodes that are used to construct cardiac geometry.
Non-contact mapping system includes a computer workstation that is used to display three dimensional maps of cardiac electrical activity, custom designed amplifier system, with a balloon shape multi-electrode array catheter (MEA) to map endocardial activation.
The MEA is a collapsible balloon-shaped catheter consisting of 64 intersecting electrodes on its surface which will be expanded once located in the cardiac chamber of interest. The electrical potential present on the MEA’s surface is recorded, permitting calculation of the endocardial potential by solving an inverse problem (see section 1.7). This allows reconstruction of electrograms at endocardial sites in the absence of physical electrode contact at those locations. MEA position in the chamber is identified by applying a low level 5.6 kHz current in two ring electrodes along its shaft and measuring the resulting potential on the body surface. Finally, moving the mapping catheter along the endocardial surface helps to reconstruct chamber geometry (figure 1.16 (asterisks)).
36
Recording cardiac electrical activity from thousands of points simultaneously and enabling reconstructing over 2048 electrograms from a single beat are two of the most elegant abilities of the non-contact mapping system. For these reasons, non-contact mapping has been validated for its application in human ventricles and atria36-40. It has been also validated in a human study for reconstruction of the endocardial electrograms in human left ventricular during sinus rhythm41.
It has been demonstrated that non-contact endocardial mapping is practical in the diagnosis and treatments (such as catheter ablation) for various cardiac arrhythmias35 including atypical right atrial flutter42, focal right atrial tachycardia (RAT)43, right ventricular tachycardia44,45, left atrial tachycardia46 and atrial fibrillation36,47,48. Non-contact endocardial mapping has been used in different types of arrhythmias for the purpose of investigation and treatment. For example, the circuit of the right atrial flutter and the zones of the slow conduction have been identified using non-contact endocardial mapping system for performing radiofrequency ablation49,50.It is also able to show the macroreentry circuit during atrial flutter even with functional and anatomical variations between different patients51.
The majority of the researches by this new catheter were done in right atrial (56%) due to anatomical limitation of the left atrium; thus its application in the left atrial still needs more investigations35.
From the treatment point of view, most important advantages of non-contact endocardial mapping are tracking an arrhythmia and guiding an ablation catheter by a single beat. In addition, construction of 2048 signals from one beat allows precise mapping even in a patient with rare focal activity. Fluoroscopy time, radiation dosage, and procedure time are reduced by using non-contact mapping conjunction with conventional mapping strategies52. Other useful features are:
37
radiation-free catheter navigation, re-visitation of points of interest, and cataloging ablation points on the three dimensional model.
Non-contact endocardial mapping has a good precision in recording the endocardial potential at distance <40 mm from the MEA; hence, the equator of the MEA ought to be placed close to the area of interest 47,53,54. Earley et al. used non-contact endocardial mapping to map the permanent AF and validate noncontact mapping. Based on their work, the signal morphology, correlation and the timing are strongly dependent on the distance of the balloon catheter from the recorded point38. Hindricks et al. had 17 patients with episodes of paroxysmal atrial fibrillation who underwent non-contact mapping of the left atrium to identify the localization of pulmonary vein foci that initiate paroxysmal atrial fibrillation36.
Disadvantages of this technique can be listed as: 1) inaccuracy of the recorded potentials in terms of time and morphology at great distances from the MEA, 2) limited accuracy of the reconstructed signal because it is the solution to an inverse problem which is an ill-posed problem, 3) difficulty in deployment of the balloon catheter into the atria, 4) inaccuracy in recording the electrical potentials in certain atrial geometry like appendages and 5) the possibility of inducing non-sustained arrhythmia by MEA36.
On the other hand, the conventional mapping technologies, like CARTO, can only map one location at time. Therefore, it is time consuming and, sometimes, mechanical induction of ectopic activity might occur during localization of arrhythmogenic foci.
Atrial fibrillation is often triggered by ectopic foci in pulmonary veins for that reason, this focal triggers are typically targeted by ablation strategy55.
38
Ectopic foci are critical points for designing ablation strategy. Hindricks et al. have determined the location of pulmonary vein foci by using noncontact mapping36and, ability of the system to identify scar and low voltage areas in right atrial has been proved53.
1.6 Computer modeling
The electrophysiological and neurological mechanisms underlying cardiac arrhythmias are complicated. Investigations about cardiac arrhythmias can be performed in patients, in animal models, or in computer models. Testing a new approach or technology in patients is not trouble-free and cost efficient. Hence, a combination of animal models and computer models may provide more details about electrophysiological and neurological mechanisms underlying heart functionality and cardiac arrhythmias like atrial fibrillation.
Computer models of the heart allow us to selectively change the local properties of ionic channels and set it to work only on the target that we are interested in. This option reduces confounding effects related to the physiological substrate. Changing the electrical properties of individual cardiac cells can set the stage for AF. Each cardiac cell contains a large number of ion channels of different types, and the proper function of a cardiac cell depends on a choreography involving all of these ion channels i.e. the proper number of each type of ion channels, the individual channels that must open and close at the proper time. Consequently, by ionic channel manipulation, the conditions necessary for a re-entrant arrhythmia or AF may be created.
Computer simulation of function of the heart offers the potential to guide disease treatment and management, to clarify the causes creating these conditions and eventually, to develop new treatment tools and drugs to reduce their threat to life.
39
In order to achieve a predictive model of the heart, we should first consider the electrophysiological details about cardiac cell i.e. ions fluxes across membranes and from cell to cell.
The first atrial cell models were developed using rabbit atrial cells by Hilgemann et al.56 and Lindblad et al.57Later, Nygren et al.58 and Courtemanche et al.59 introduced two human atrial cell models. The Courtemanche model can be modified to produce atrial arrhythmias and incorporate the effect of acetylcholine (vagal stimulation) 58. Moreover, a canine version of the model has been created.
Excitable cells are connected through gap junctions. The interconnections of the cellular network form the cardiac tissue. Action potential propagates from cell to cell by this pathway. When this network is approximated by a continuous conductive medium, impulse propagation is governed by the monodomain or bidomain equations (nonlinear partial differential equations of the reaction-diffusion type)8.
The geometry of atria has been constructed using different medical imaging modalities like magnetic resonance imaging60,61, electroanatomical mapping system, computer aided tomography62, and dataset resulting from Visible Human project63-66.
The computer models are able to simulate heart disease, genetically modified cells, and regional heterogeneity by changes in membrane kinetics8, mainly ionic currents which have a significant impact on the repolarization phase of the action potentials and on the occurrence of conduction
Molecular level
Membrane
40
block or reentry67-70. They have been used to study the effect of cardiac cell remodelling- a pathophysiological adaptation of the atrial cells to the fibrillatory rhythm8.
As already mentioned, the autonomic nervous system has a complementary role to create AF substrate. Vagal stimulation and acetylcholine (ACh) concentration can change rhythm adaptation and spatial heterogeneity in the heart. Computer models provide a framework to investigate the role of nervous system in atrial arrhythmias. For instance, Vigmond et al. induced reentries in a 3-D canine atrial model by modulating ACh 71.
In this work, we are going to create an electro-anatomical computer model of canine right atrium based on geometrical data acquired from catheter localization system (EnSite NavX). This model will be used to generate contact and noncontact (epicardial/endocardial) signals to validate and evaluate the signal processing tools and relevance of the both mapping systems.
In the next section, we are going to define the concepts used to compute electrical signals in noncontact mapping system and produce a mathematical model of the heart.
1.7 Forward and Inverse problem
In recent years, scientists have applied mathematics for visualizing important electrical phenomena in the human heart. As mentioned earlier, the heart is a pump that works efficiency if the conduction system sends impulse properly. Electrical impulse starts from the SA node and propagates throughout the whole heart, causing contraction in heart muscle. Distribution of these waves in the heart is termed heart electrical activity which reflects to the chest, which allows physicians to measure electrical potential called an electrocardiogram or ECG.
41 1.7.1 Forward problem
Computing electrical potentials on the thorax surface (body surface potential) from heart surface potentials is known as the forward problem of electrocardiography (figure 1.14). One of the main applications of the forward problem is in the simulation of ECG signals in computer models and studying the effects of torso inhomogenities on the ECG. The solution to the forward problem entails surface methods and volume methods. More detail information about these methods can be found in 72.
Figure 1.14- Definition of the Forward problem. Arrows indicate the direction of computation which is from heart surface potential to the body surface potential; ∅ is heart surface potential and ∅ is body surface potential (Reproduced with permission from Cluitmans et al.73).
However, application of forward problem in medical domain is limited since we need information about heart surface potentials and electrophysiological activity of the heart, notably, the potentials at the outer heart wall (the epicardium). Hence, computing heart surface potentials from body surface potentials is desirable for clinical applications72.
1.7.2 Inverse problem
The inverse problem consists in predicting electrical potentials on the heart surface using electrical potential on the body surface (Figure 1.15).
42
Figure 1.15- Definition of the inverse problem; Arrows indicate the direction of computation which is from body surface potential to the heart surface potential. ∅ is heart surface potential and∅ is body surface potential (Reproduced with permission from Cluitmans et al.73).
The procedure of reconstructing heart surface potentials or solving the inverse problem is illustrated in the figure 1.15. 74 Briefly, it starts by acquiring potential recordings (ECGs) on the body surface of a patient, finding the anatomical relationship between the heart and body surface (transfer matrix) which requires generating a patient-specific model of the torso, and finally reconstructing the heart surface potentials (epicardial) using mathematical techniques (pseudo-inverse and regularization) (figure 1.16).
In our project, the balloon catheter was located in the cardiac chamber and the endocardial activity was computed by means of an inverse problem (figure 1.17).
43
Figure1.16- Application of inverse problem in electrocardiography. The procedure of reconstruction of heart surface potential from body surface potential (Reproduced with permission from Cluitmans and et al.73,75).
Recording Source Torso Heart
Balloon Catheter Right atrium
Figure 1.17- Application of inverse problem in noncontact mapping; Balloon catheter inside the cardiac chamber and compute the endocardial potential by using inverse problem (Reproduced with permission from Cluitmans and Salinet et al.73,75).
Noncontact mapping Body surface potential maps
44
In figure 1.17, electrical potential is recorded from chest and balloon catheter, respectively, for body surface potential maps and noncontact mapping. Next, heart and right atrium endocardial electrical activity are reconstructed from the recorded electrical potentials -from the chest and balloon catheter- by means of inverse problem.
Nowadays, medical companies are interested in non-invasive technology and also other similar procedures due to their unique properties. Any successful demonstration of application of this technique would significantly advance cardiac diagnostic procedures. Unfortunately, up to now in most cases the quality of reconstructed electrical potentials has not been satisfactory enough for a reliable diagnosis72.
The main source of the difficulty stems from the fact that the inverse problem in cardiac electrophysiology is well known to be a mathematically ill-posed problem; i.e. its solution can oscillate wildly with the slightest noise or measurement errors or it is not unique or even exists. The number of parameters in the desired solution, i.e. the complexity of the assumed heart model, can change the ill-posed nature of the inverse problem. Therefore, the solution to the inverse problem may vary depending on the assumptions of the computer model72.
In order to remove ill-posed nature of inverse problem the desired solution needs to be stabilized by a mathematical technique known as regularization.
The solutions to the inverse problem may be based on 70:
1) Multipole coefficient
2) Moving-dipole inverse solutions 3) Multiple-dipole inverse solutions
45
In our project, forward problem was used to compute the electrical potential appearing on the surface of the balloon catheter (64 electrodes) and the electrical potential of 103 electrodes on the 2 silicone plaques, for noncontact endocardial and epicardial mapping respectively.
Right atrium endocardial electrical activity (2048 signals) was reconstructed from electrical activity recorded by 64 electrodes on the surface of balloon catheter by solving an inverse problem.
These methods provide comprehensive information about cardiac electrophysiological activity.
1.8 Signal processing tools
In this section we are looking at basic principles underlying intracardiac electrogram analysis and their technical applications in cardiac electrophysiology. To describe atrial depolarization and repolarization, two parameters have been considered in this study: activation time and area under the atrial T waves (ATa). These parameters provide basic information about normal and abnormal electrophysiological properties.
1.8.1 Activation time
Activation time is one of the most fundamental factors to describe the mechanisms of atrial arrhythmias. For instance, identifying the earliest activation site by mapping activation time is essential for ablation procedure to recognize sites of ectopic beats. The concept of activation time is defined in figure 1.18 for a unipolar electrogram76.
46
Figure 1.18- The concept of activation time. (A) Activation is going to reach to cell beneath the electrode (Depolarization phase). (B) Activation has reached beneath the electrode (Plateau and repolarization). (C) Activation is going to pass to adjacent cells (Rest).
Activation time was defined as the time where the peak negative derivative reach the maximum value and validated by Ndrepepa77 using extracellular electrograms. It has been recognized as the most accurate indicator of activation beneath the electrode, and is supported by both experimental and theoretical work77-80.
In figure 1.19, the first signal represents an atrial depolarization and the red point indicates the activation time. The red point is located at the peak negative in the panel B. The last signal is the transmembrane potential that indicates the cellular activation beneath the electrodes after red point or activation time (the extracellular potential is directly proportional to the second temporal derivative of the intracellular potential).
Activation time is the moment when the action potential passes underneath the electrode
Electrode
47
Figure 1.19- Activation time mathematical definition is shown by red dot. (A) An atrial beat. (B) Derivative of A. (C) Transmembrane voltage.
Mapping of activation sequence has been studied in epicardial and endocardial signals in the isolated canine right atrium to determine the concordance between epicardial and endocardial activation times. The difference between epicardial and endocardial activation was small during sinus rhythm but can be significant during arrhythmias80.
Armour et al used epicardial and non-contact endocardial mapping to identify the sites of origin of sinus or ectopic beat preceding atrial fibrillation. They also have shown the contribution of the efferent neuronal elements in electrophysiological substrate of the atrial tachyarrhythmias81.
In order to map the activation time sequence of the endocardial surface of cardiac chamber, we can use cardiac anatomical mapping systems by either one catheter or multielectrode catheter. A balloon catheter with 64 electrodes was used in our study. In addition, three dimensional color coded maps was reconstructed using electroanatomical mapping system (EnSite array).
The maximum negative derivative of an electrogram corresponds to the upstroke of action potential
Transmembrane voltage
B A
48
Our aim is to compare two cardiac mapping systems in term of activation times by analyzing right atrium beats in canine experiments. To avoid having ventricular beat mask relevant atrial activity (notably repolarization), atrial activity was disassociated from ventricular activity by pharmacological suppression of the AV node and ventricular pacing. Ventricular beats remained present but were not synchronized with atrial repolarization. In order to choose appropriate beats in which ventricular beats were located far enough from atrial beats (250-300 ms later), activation times and ventricular beats were plotted for each catheter location and for all experiments as shown in figure 1.20. For instance, the time interval between activation time and ventricular beat is less than 300 ms in beat number 1, 2, 3 in the figure 1.20 (A), therefore, beat number 4and 5 were chosen for this case.
49
Figure 1.20- Activation times and ventricular beats are plotted for (A) Right ganglionic plexus and (B) for all experiments. - * Activation time Ventricular beat Activation time (ms)
Beat: 1 Beat: 2 Beat: 3 Beat: 4 Beat: 5
Time (ms)
V (mv) A
50
In order to choose the corresponding beats between epicardial and non-contact endocardial signals, the delay between these two mapping system was calculated then the activation times were plotted for all experiments in figure 1.21.
Figure 1.21- Concordance between epicardial and non-contact endocardial activation times for all catheter locations; The purple dots are non-contact endocardial activation times, the black dots are epicardial activation times, and blue stars are ventricular beats.
In addition, activation times were plotted for each catheter location separately, as seen in the figure 1.22. Also, we mapped them on the epicardial and endocardial geometry to ensure that the correspondent beats were chosen.
For example, the activation times for both mapping systems are plotted for catheter located in the right atrium ganglionated plexus in figure 1.25. Beats number 1 to 4 of the epicardial signals
0 0.5 1 1.5 2 2.5 3 3.5 4 x 10⁴ 1 2 3 4 5 6 7 8 9 10 11 12 13 14 15 16 17 18 19 Time (ms) CS1 IA1 IA2 IA3 IA4 IA5 IA6 IA7 RAGP1 RAGP2 SVC1 Vag1_1 Vag1_2 Vag1_3 Vag1_4 Vag1_5 Vag1_6 Vag2_1 Vag2_2 Activation time Time (ms) Activation time
51
correspond to beats number 1 to 4 of the endocardial signals in figure 1.25(A). Meanwhile, the earliest activation time happens near the SVC for both mapping systems (shown as asterisks).
Figure 1.22- Experimental activation times; (A) Activation times are plotted for one catheter location to notice the correspondence between the beats. (B) Activation times are mapped for the same beats. Anatomical locations are shown by the stars and arrows. SVC superior vena cava; IVC inferior vena cava, RAGP right atrium ganglionated plexus (catheter location).
The same procedure was done for the simulated epicardial and endocardial signals shown in figure 1.23.
SVC SVC
SVC SVC
IVC IVC IVC
IVC
SVC SVC SVC SVC
IVC IVC IVC
IVC RAGP2
Beat 1 Beat 2 Beat 3 Beat4
Epi Endo RAGP2 A B Activation time (ms)
52
Figure 1.23- Simulated activation times; (A) Activation times are plotted for one experiment to notice the correspondence between the beats. (B) Activation times are mapped for the same beats. Anatomical locations are shown by the stars and arrows. SVC superior vena cava; IVC inferior vena cava, RAGP right atrium ganglionic plexi (catheter location).
1.8.2 Area under the atrial T wave
Spatial repolarization changes can be measured by computing the area under the repolarization waveform. For atrial waves, it is known as area under the atrial T wave or ATa. ATa is a marker of arrhythmogenic repolarization gradient. We computed ATa by integration over a defined
400 600 800 1000 1200 1400 1600 1800 2000 2200 2400 1 Activation time (ms) Epi Endo RAGP2 RAGP2
Beat 1 Beat 2 Beat 3 Beat4
IVC IVC IVC IVC
SVC SVC SVC SVC
SVC SVC SVC SVC
IVC IVC IVC IVC
A
53
distance start from 40 ms after the activation time, as shown in figure 1.24.The effect of stimulation of efferent autonomic neural elements on the atria has been studied by the area of QRST deflections to detect regional changes in atrial electrical activity82. Page et al. introduced ATa to identify the different spatial regions affected by specific nerve stimulation. The spatial distribution of repolarization changes displayed heterogeneity in atrial electrical response to autonomic nervous system stimulation19,82.
Cardinal et al. induced tachyarrhythmias by mediastinal nerve stimulation to point out the relation between the origin of the beat immediately preceding tachyarrhythmias onset and spatially concordant sites of neurogenically induced repolarization changes using epicardial and non-contact endocardial mapping. They also showed the role of spatial heterogeneity of atrial repolarization properties in tachyarrhythmias initiation. Based on their results, further information about arrhythmias could be extracted by gaining insights into the electrophysiological markers related to repolarization properties in the atria83.
Figure 1.24- The area under the atrial T wave; ATa is shown by green color.
Activation time
54
1.8.2.1 Correction of the baseline for ATa calculation
One of the difficulties for ATa calculation was possible (low frequency and typically small amplitude in our data) baseline wandering. We addressed this problem by detecting the last point of the integration and shifting it to zero for each beat in all 103 epicardial signals and 2048 endocardial signals (figure 1.25).