Proteomics for prediction and characterization of response to infliximab in
Crohn's disease: A pilot study
Marie-Alice Meuwis a,1, Marianne Fillet a,1, Laurence Lutteri a, Raphaël Marée b, Pierre Geurts c, Dominique de Seny d, Michel Malaise d, Jean-Paul Chapelle a, Louis Wehenkel c, Jacques Belaiche e, Marie-Paule Mervillea,2, Edouard Louise,2
a Laboratory of Clinical Chemistry, GIGA Research, University of Liege, Belgium b GIGA Bioinformatics Platform, University of Liege, Belgium
c Department of Electrical Engineering and Computer Sciences, GIGA Research, University of Liege, Belgium d Rheumatology, CHU, University of Liege, Belgium
e Department of Hepato-Gastroenterology, CHU, University of Liege, GIGA Research, University of Liege, B34, Sart Tilman, 4000 Liege, Belgium
Abstract
Objectives: Infliximab is the first anti-TNFα accepted by the Food and Drug Administration for use in
inflammatory bowel disease treatment. Few clinical, biological and genetic factors tend to predict response in Crohn's disease (CD) patient subcategories, none widely predicting response to infliximab.
Design and methods: Twenty CD patients showing clinical response or non response to infliximab were used
for serum proteomic profiling on Surface Enhanced Lazer Desorption Ionisation-Time of Flight-Mass
Spectrometry (SELDI-TOF-MS), each before and after treatment. Univariate and multivariate data analysis were performed for prediction and characterization of response to infliximab.
Results: We obtained a model of classification predicting response to treatment and selected relevant potential
biomarkers, among which platelet aggregation factor 4 (PF4). We quantified PF4, sCD40L and IL-6 by ELISA for correlation studies.
Conclusions: This first proteomic pilot study on response to infliximab in CD suggests association between
platelet metabolism and response to infliximab and requires validation studies on a larger cohort of patients.
Keywords: Proteomics; Serum profiling; Infliximab; Crohn's disease; PF4
Introduction
Infliximab is the first anti-TNFα agent accepted for inflammatory bowel disease (IBD) treatment. This chimeric antibody is composed of a murine variable region targeting membrane and soluble TNFα and a human IgGl constant part [1]. It has been used for therapy of refractory Crohn's disease (CD), for around a decade [2]. The more recent ACT I and II studies have provided evidence for its beneficial effect on ulcerative colitis (UC) [3], The majority of IBD show significant clinical improvement with this therapy: around 70% for CD and 60% for UC.
Currently, clinical activity index and c-reactive protein (CRP) level can be used to monitor clinical and biological response, respectively. Other works proposed the use of proteins involved in intestinal inflammation or acute phase reactants for the follow-up of treated patients and to predict relapse [4]. Moreover, genetic studies allowed the identification of several gene variants associated with the response to infliximab in CD [5-9]. Nevertheless, none can be considered as a widely valid marker predicting the response to this anti-TNFα antibody at an individual level. Due to cost and potential side effects of this drug, any biomarker able to predict response would be useful [7]. Furthermore, precise mechanism of action of infliximab is still poorly understood. While it was first conceived as an agent blocking soluble TNFα, several other mechanisms, mainly implicating membrane-bound TNFα have been suggested [1,10]. While other anti-TNF treatments are in development, it is particularly important to disclose which mechanisms are essential to the efficiency of such treatments.
Recently, proteomics arose with new strategies and techniques to discover protein biomarkers which may be useful for diagnosis or to understand disease physiopathology [11,12]. In this pilot study, we tested the feasibility of using an agnostic proteomic strategy of serum profiling to disclose markers associated with response to
1
The two first authors equally contributed. 2
infliximab in CD. Furthermore, we observed changes in sera protein profiles after treatment dividing our CD population according to clinical response.
Materials and methods Patients and treatment
Forty patients with CD treated with infliximab were previously included in a Belgian infliximab Expanded Access Program (Schering-Plough NV/SA, study 011246-1) at the CHU of Liege. The study was accepted by the ethical committee of Liege University hospital and all the patients gave their informed consent both for the compassionate use program and ancillary studies, including the search for serum markers predicting response to treatment. Infliximab (Remicade; Centocor Inc, Malvern, PA) was given as an IV infusion of 5 mg/kg either at baseline for non fistulizing disease or at baseline, week 2 and week 6 for fistulizing disease. Clinical and biological responses, assessed by the decrease of the Crohn's disease activity index (CDAI) and CRP level respectively, were determined 4 weeks after treatment induction (week 4 for non fistulizing disease and week 10 for fistulizing disease). Among this cohort, for the present pilot study, we selected 20 cases showing clear clinical response (10 R) or non response (10 NR) to treatment. At baseline, patients showed clinically active disease characterized by a CDAI > 150. A clear clinical response to treatment was defined by a CDAI < 150 with a decrease of at least 70 points or for patients not in remission at final evaluation, a decrease of at least 100 points. This definition of clinical response based on CDAI was used for all patients, including those with
draining fistula. In this case, the draining fistula was simply included in the calculation of CDAI. A clear absence of response to treatment was defined as no decrease in CDAI or a decrease of less than 70 points. Two blood samples were taken from every patient: before treatment and after infliximab induction (week 4 for non fistulizing and week 10 for fistulizing patients). The sera were collected and stored at -80 °C until use. The characteristics of the 20 patients selected in this study are shown in Table 1.
Proteomic serum profiling
We performed serum profiling with a Surface Enhanced Lazer Desorption Ionization-Time Of Flight-Mass Spectrometer PBSΠ (BioRad, Inc, USA). We used hydrophobic H4 protein chip arrays without pre fractionation of samples as previously described [13]. Briefly, we loaded directly on each spot a normalized amount of 12 µg of total serum proteins per sample, prior diluted in phosphate buffer supplemented with Triton X100 0.5% and 30 mM NaCl. Two washing steps were performed to discard unbound material with the same binding buffer. Four additional washing steps were performed with the same phosphate buffer: two without salt and two without salt neither detergent. Matrix used was saturated CHCA (BioRad) prepared as recommended by the
manufacturer.
Reading parameters, baseline and saturating matrix signal sub-straction, as well as normalization were performed as recommended by BioRad and described in details in Meuwis et al. [ 14]. Reading's parameters were set up to obtain the best spectra, in terms of peak detection in the m/z range encompassing m/z 1000 to 15000 (monitoring signal to noise ratio, intensity, resolution) and these were kept constant through the entire experiment. The quality control (QC) used in this study was the same serum sample taken from a healthy control. A new -80 °C frozen aliquot of the same batch was used every day of the study and loaded with exactly the same standardized protocol as for patient samples. Ten chips were prepared a day and a QC was placed on every chip to monitor interchips and intra-experiment reproducibility.
Calibration was performed with the "all in one peptide mix" (BioRad) supplemented with Cytochrome C bovine and Myoglobine equine (BioRad) loaded onto NP20 chip.
Seven spectra replicates were obtained per sera sample and 2 samples of serum were analyzed per patient, one sample taken before (T0) and one after treatment (T4-10). A total of 280 spectra were recorded and analyzed.
Table 1
Respondent, R (n = l0 Non respondent, NR (n = l0)
Age median range (years) 35 (22-52) Age median range (years) 45 (28-56)
Males 4/10 Males 2/10
Females 6/10 Females 8/10
Localization: Ileum 1/10 Localization: Ileum 3/10
Colon 7/10 Colon 3/10
Ileocolon 2/10 Ileocolon 4/10
Perianal 5/10 Perianal 5/10
Fistulizing 4/10 Fistulizing 5/10
Non fistulizing 6/10 Non fistulizing 5/10
Disease duration, median range (years)
7 (1-23) Disease duration, median range (years) 11 (1-29)
CRP T0 median range* 15.1 (1-115) CRP T0 median range* 1.6 (1-6)
CRT T4-10 median range* 3.0 (1-25) CRT T4-10 median range* 2.2 (1.-4.2)
CDAI T0median range 304 (159-465) CDAI T0 median range 231 (165-526)
CDAI T4-10 median range 94 (58-188) CDAI T4-10 median range 219 (187-500)
IL-6 T0O median range (pg/mL) 12852 (1534-51990) IL-6 T0 median range (pg/mL) 2775 (1387-34977) IL-6 T4-10 median range (pg/mL) 24170 (1387-30668) IL-6 T4-10 median range (pg/mL) 4600 (1387-56956) sCD40L T0 median range (pg/mL) 5586 (767-259950) sCD40L T0 median range (pg/mL) 1607 (694-28478) sCD40L T4-10 median range
(pg/mL)
12267 (669-15334) SCD40LT4-10 median range (pg/mL) 683 (694-28478) Treatments: Immuno suppressor 5/10 Treatments: Immuno suppressor 5/10
Antibiotics 1/10 Antibiotics 3/10
Corticoids 3/10 Corticoids 7/10
Sulfasalazine 8/10 Sulfasalazine 1/10
Infliximab 10/10 Infliximab 10/10
Statistics
Biomarker Wizard software (BioRad, Inc, USA) was used for peak integration using a minimum signal to noise ratio of 2, as previously described [14]. First, we analyzed peak distribution by univariate method performing ANOVA test on spectra replicates managed by groups: Responder (R) versus Non Responder (NR), before treatment (T0). We performed a multivariate analysis based on supervised classification with multiple decision trees boosting method and used cross validation by leave-one-out, with the software PEPITo™, as previously described [13-15]. We obtained a classification model which can discriminate R from NR patients before treatment. We calculated by leave-one-out cross validation the sensitivity, specificity and accuracy of this classification model and evaluated single potential biomarker importance (imp%). This last factor weights every potential biomarker contribution in this model predicting treatment outcome and allowed selection of the best one.
Second, we performed a "patient by patient analysis" and used Mann-Whitney test in order to compare every patient, before (T0) and after infliximab therapy (T4-10), using the seven spectra replicates recorded per samples. By this approach we selected peaks showing a significant difference in intensity between T0 and T4-10 for a minimum of 4 patients out of 10 per category (NR and R).
P values were considered significant if inferior to 0.05. All correlations, calculated by Spearman test, Wilcoxon
paired tests, applied when required were considered significant if associated to a P value inferior to this limit. The same limit was used for Fisher exact test results, performed in contingency table.
Identification of biomarkers
The specific anti-PF4 antibody used for immunodepletion experiments was a polyclonal rabbit (Gentaure, Belgium). It was coupled with protein A+ agarose beads (Santa Cruz Biotechnology, USA) as recommended by the manufacturer. Polyclonal rabbit anti-FLAG antibody (Santa Cruz Biotechnology, USA) or Protein A+ agarose beads alone were used as non specific negative controls.
LC/MS-MS identification of the protein was also performed by mean of Ion-trap (Agilent Technologies, USA) as described previously [14], after SDS PAGE 1D isolation of specific proteins migrating at PF4 apparent MW, in reduced conditions [14,16].
Protein quantifications and ELISA
Total protein quantification was performed using BCA method (Pierce, USA). Quantification of sCD40L and IL-6 was realized by ELISA (sCD40L Quantikine Kit and human IL-IL-6 Quantikine Kit High Sensitivity; R&D system, MN, USA). Commercial PF4 ELISA kit was IMUCLONE® (American Diagnostica, Inc, USA). CRP was measured by routine procedure and expressed as relative value as previously described [5],
Results Serum profiles
We recorded serum spectra of samples taken from patients before (T0) and after treatment (T4-10). Serum profiles were acquired from m/z 0 to 30000 and data were analyzed from m/z 1000 to 25000 to avoid irrelevant saturating matrix signal. Fifty peaks were integrated on the H4 spectra and peak intensities were used in statistical analysis. The normalization step was performed on total ion current and replicate normalization factor satisfied the manufacturer's recommendation (ranging from 0.5 to 1.5). CV of peak intensity detected for replicates of the same sample was around the repeatability announced by the manufacturer.
Prediction of response to treatment
Spectra of the two patient groups (R versus NR) were compared before treatment (T0) using univariate (Anova test) and multivariate analysis of multiple decision trees designed by boosting. This second approach generated a model of classification able to predict a positive response to treatment. We determined sensitivity, specificity and accuracy of this predicting model using a cross validation by leave-one-out and we obtained 78.6% (55/70), 80.0% (56/70) and 79.3% (111/140) respectively. This method allowed calculation of biomarkers' importance
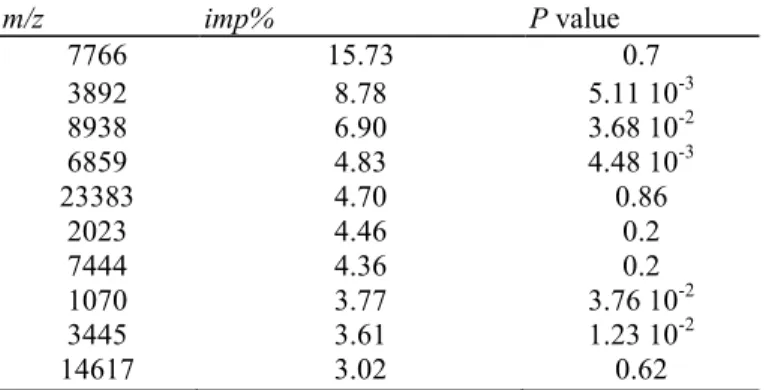
(imp%). Table 2 describes the first 10 biomarkers ranked according to their imp% and their associated P value.
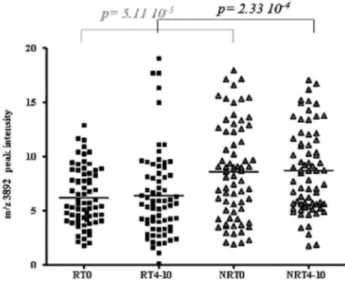
According to Biomarker Wizard, the first two peaks appearing at m/z 7766 and 3892 are most likely the singly (1H+) and the doubly (2H+) charged forms of the same peptide. The peak corresponding to the 2H+ form shows the second highest imp% and a significant P value in the comparison of patient groups before treatment. Thus, peak intensity distribution of the m/z 3892 biomarker, which was ranked in second position according to imp%, may help in discriminating R versus NR at T0 (Fig. 1). The intensity of this peak was not significantly correlated to trivial clinical and demographic characteristics including disease location, CRP level, steroid treatment or activity of the disease assessed by the CDAI score.
Table 2 Potential biomarkers ranked according to imp%, in multivariate model designed by boosting: R versus NR, at T0 m/z imp% P value 7766 15.73 0.7 3892 8.78 5.11 10-3 8938 6.90 3.68 10-2 6859 4.83 4.48 10-3 23383 4.70 0.86 2023 4.46 0.2 7444 4.36 0.2 1070 3.77 3.76 10-2 3445 3.61 1.23 10-2 14617 3.02 0.62
The m/z of potential biomarkers, imp% and associated P value are given for the first 10 biomarkers ranked by multiple decision trees boosting, for the comparison of R versus NR groups before infliximab treatment.
Fig. 1. Distribution of R and NR patients at T0 and T4-10, according to PF4 peak intensity, at m/z 3892 (2H+) on H4 profiles. Intensities of the discriminating peak detected at m/z 3892 on H4 chip array, are given for every spectra of R and NR patients, before (T0) and after infliximab therapy (T4-10). R patients are represented by black squares and NR patients by grey triangles.
Identification of potential SELDI biomarkers at m/z 3892 and 7766
We made the assumption that these two peaks, detected on H4 array could correspond to the same protein detected at m/z 7771, on CM10 chip array and identified by LC/MS-MS after SDS PAGE ID gel separation, as well as by specific immunodepletion techniques in our previous work [14]. Therefore, we performed
immunodepletion experiment on H4 chip array, with the same specific antibody targeting platelet aggregation factor 4 (PF4). We showed that the two peaks of interest were both depleted at the same time using this specific antibody. Fig. 2 shows typical spectra obtained with diluted sera on H4 chip and the co-depletion of peaks at m/z 3892 and 7766. This depletion was only visible with specific anti-PF4 antibody and not with the negative control conditions (aspecific anti-Flag antibody, no antibody), confirming that peaks at m/z 3892 and 7766 were the doubly (2H+) and singly (1H+) charged forms of PF4 respectively.
ELISA PF4, IL-6 and sCD40L for prediction of response to treatment
We quantified PF4, IL-6 and sCD40L using a commercial ELISA test before treatment (Fig. 3). There was no significant difference between R and NR for ELISA PF4 (Fig. 3 A), sCD40L, another marker ofplatelet activation (Fig. 3.B and Table l)or IL-6 (Fig. 3.C and Table 1).
Characterization of response to treatment analysis on SELDI spectra
We analyzed peak distribution changes characterizing R or NR groups independently, comparing protein profiles before and after treatment (T0versus T4-10). Table 3 summarizes peaks found significantly discriminating the R and NR groups with the "patient by patient" statistical analysis. As described in the methods, we selected through this approach, peaks showing a significant difference in intensity between T0 and T4-10, for a minimum of 4 patients out of 10. Peaks labelled with * appeared on spectra globally decreased after treatment, whereas those with ** were globally increased after infliximab therapy. The peaks showing significant change in intensity are different in the R and the NR groups. PF4 2H+ (m/z 3892) and 1H+ (m/z 7765) significantly decreased after treatment for only 3 patients out of 20.
ELISA tests in the characterization of response to treatment
We evaluated (with paired test) the changes in ELISA measurement levels characterizing CD R and NR patients, before and after treatment by infliximab. Figs. 3A, B, and C show ELISA PF4, sCD40L and IL-6 distributions respectively, for R and NR groups, at T0 and T4-10.
We calculated the relative value, as compared to baseline (expressed in percents). PF4 level changes were not significant after treatment: R median relative value as compared to base line: 95.2%, range 14.8-119.6%, p=1; the NR median relative value, as compared to base line: 95.2%, range: 42.0-181.9%, p = 1. The sCD40L change after infliximab was not significant in NR (NR median relative value as compared to base line: 129.4%, range: 78-221 %, with p= 0.2), and reached nearly significance in R (R median relative value as compared to base line: 132.7%, range: 5.6-685.7%, p= 0.065). IL-6 was neither significantly modified after treatment for R (R median relative value as compared to base line: 42.1%, range: 14.4-314.4%, p= 0.76) nor NR (NR median relative value compared to base line: 77.3%, range: 11-181.8%, p= 0.92).
Fig. 2. Identification of PF4 by specific serum immunodepletion of the two peaks at m/z 7766 and 3892, on H4 chip array. Specific PF4 immunodepletion of the two peaks detected at m/z 7766 and 3892, on H4 sera profiles is obtained with specific antibody targeting PF4 coupled to Protein A-agarose beads. The two control conditions used are Protein A-agarose alone or used in combination with anti-Flag antibody. Intensities of the two peaks detected at m/z 7766 and 3892 are simultaneously decreased when using anti-PF4
Fig. 3. Quantification of sCD40L, IL-6 and PF4 by ELISA. A. PF4 B. sCD40L C. IL-6. Black lines represent the mean of every group: R (black square), NR (grey triangle) before (T0) or after infliximab therapy (T4-10).
Table 3. Result of univariate analysis performed "patient by patient"
m/z R NR 10274* 5/10 NS 9219* 4/10 NS 7931* 5/10 NS 7766* 4/10 NS 7444* 5/10 NS 3162** NS 4/10 3051** NS 4/10 1070** NS 4/10 1021** NS 5/10
The peaks (labelled by their m/z value) and number of patients for whom a significant related P value was calculated between T0 and T4-10, using Mann-Whitney test, are given. Peaks found significant in R are not in NR and inversely *globally decreased after treatment, "globally increased after treatment. NS = not significant (P>0.05).
Correlation study between SELDIPF4 detection and other tests
We studied the correlation between ELISA PF4, ELISA sCD40L, ELISA IL-6 and the two related PF4 peaks on H4 spectra. ELISA PF4 was only significantly correlated to PF4 signals on spectra at m/z 3892 (2H+), in the NR group of patients before (r = 0.84 and p =3.7 10-3) and after treatment (r = 0.9 and p =5 10-4). No significant correlation could be observed for the R group. No significant correlation coefficient was found for any group between PF4 peak at m/z 7766 (1H+) and ELISA detection. No significant correlation could be established between PF4 peaks on SELDI and ELISA sCD40L or IL-6 levels. Moreover, none of the two PF4 peaks detected on SELDI profiles is significantly correlated to CDAI, CRP, steroid medication or disease location.
Discussion
Prediction of response to infliximab has focused great attention since the registration of this drug for CD therapy. In this context, the present pilot study is the first one to report the use of proteomic serum profiling on SELDI-TOF-MS. Despite the small number of individuals tested, we obtained results suggesting that proteomic markers may help to understand response to infliximab and possibly try to define new markers for response prediction. Although a confirmation study should now be done on a larger cohort of independent patients, one potential biomarker showing high importance in a multivariate classification model could already be selected. This marker was identified as Platelet aggregation Factor 4 (PF4). This chemokine is only produced by megakaryocytes and stocked in platelet α-granules after their maturation. It belongs to the CXCL family and is naturally released during clotting or when platelet activation occurs particularly at site of injury. PF4 cooperates with other
cytokines to induce tissue healing. PF4 is generally found angiostatic, prothrombotic, acts as inhibitor of immune cell migration elicited by other chemotactic cytokines and is able to induce leukocyte activation. It could be part of a complex mechanism of control of tissue healing and infiltration also involving Matrix Metallo-Proteinases (MMP-2 and 9), highlighted in a recent study addressing as well the characterization of infliximab's mode of action in CD [17]. PF4 is also considered as an acute phase reactant because its level increases with general inflammation, as already observed in plasma of CD patients [18-20]. In this study, PF4 level detected on SELDI spectra at m/z 3892 (2H+) was higher for non responders than for the patients responding to infliximab therapy (both before and after treatment). This variation in PF4 peaks detected with SELDI may reflect difference in platelet activation or metabolism rather than platelet count. Indeed platelet count was available in a subgroup of our patients at baseline and was not significantly correlated to PF4 peaks (data not shown). Previous works by Danese et al. reported that a proportion of IBD patients showed platelet dysfunction. Platelet activation was found higher for IBD patients than for healthy controls [21]. Such a difference in platelet metabolism may thus exist between R and NR to infliximab as illustrated by the significant difference on our H4 spectra. While the elevated CRP level can be used as a predictor of response [22], a high PF4 level determined on spectra could serve as a predictor of non response to infliximab. Although a clinical heterogeneity was visible at baseline between responders and non responders, including factors potentially involved in response to infliximab, such as disease location, CDAI, CRP and steroid use, none of these factors was significantly associated with the PF4 peaks detected by SELDI. This suggests that this SELDI PF4 might represent an original marker associated with clinical response to infliximab in CD. Along this track, we aimed at characterizing the serum levels of this platelet factor by ELISA together with another marker of platelet activation, sCD40L. However, the PF4 ELISA tested on our cohort of patients was not associated with response to infliximab and was not really well correlated to SELDI PF4 peaks. Thus, serum PF4 determined on SELDI spectra and by ELISA, does not seem to be equivalent for this question. The SELDI-TOF-MS proteomic technique detects protein variants at precise m/z and involves binding on chip, whereas ELISA test probably directly quantify a whole range of PF4 variants without any competition for binding sites. Moreover, polyclonal antibodies used in this ELISA test may also cross-react with other proteins of the same family (CXCL family) showing high sequence homology, rendering this test not as specific as the particular PF4 variant detected by SELDI-TOF-MS, in the present work. One proper characteristic of proteomic technique is that a single protein may generate many signals or peaks depending on the number of charges it can acquire under ion-isation and desorption process. PF4, for example was detected in our profiles as one time charged form (1H+; peak at m/z 7771) and two times charged from (2H+; peak at m/z 3892). This property of proteomic detection may also explain the poor correlation obtained between PF4 SELDI peaks and ELISA measurements as they do not evaluate the same thing. These results emphasize that, a biomarker detected by a proteomic strategy (for example PF4-2H+) is not directly equivalent to its measurement by ELISA method and that some relevant markers selected by proteomics may not always be validated and translated easily into any commercial ELISA tests. At this stage, our finding may have more theoretical than practical interest since the difference between R and NR in this pilot study does not seem striking enough for the marker to be used in clinical practice.
The sCD40L is another important platelet-derived factor that has been correlated with disease activity and extent in CD [23], as well as with tissue response to infliximab [24]. Similarly to PF4 determined by ELISA, sCD40L serum levels observed before treatment were not associated with response to infliximab, nor correlated to PF4 peaks on SELDI-MS. Thus, the
significant difference in the precise PF4 variant detectable only on SELDI spectra might be linked to platelet metabolism alteration, not directly correlated to activation, nor platelet count. Globally, no significant correlation was found between SELDI PF4 peaks and either platelet count, ELISA PF4, IL-6, CRP, sCD40L, CDAI, disease location or steroid medication indicating that the former one may be an original marker associated with response to infliximab in CD. However these are preliminary results that should be confirmed on a larger cohort.
As far as the characterization of the response to infliximab induction treatment, the "patient by patient" approach used to monitor changes in protein profiles, appeared to be an appropriate option. Indeed, the high heterogeneity observed in the protein profiles before and after therapy partly due to individual singularities renders a global analysis of peak evolution very difficult. This problem might be overcome by using this "case by case" statistical comparison. The results obtained show that some peaks, indicating potential protein biomarkers, harbour a similar and significant evolution in a certain proportion of patients (at least 4/10) within each subgroup (R or NR). Biomarkers showing a significant evolution in at least 4/10 patients in R were different from those in NR patients, highlighting different modifications in serum composition depending on the response to infliximab. The identification of these markers should provide new information about infliximab's mode of action and could be other components of the complex mechanism leading to infiltration, tissue remodelling and to healing, already known to involve specific MMPs [17]. The expressions of these proteins are, like PF4 and other "CXC" chemokines, also controlled by proinflammatory cytokines and are produced in their final mature and active form(s) by proteolytic processing. In addition, MMP-9 appears to be able to regulate the generation or activation of chemokines of the PF4 family. These might together participate to switch from healing induction to tissue damage increase characterizing CD patients in clinical remission or showing flares, respectively. However, PF4 SELDI peaks, neither ELISA PF4, nor IL-6 or sCD40L, were significantly modified after treatment for all patient subgroups.
In conclusion, this pilot study shows the feasibility to disclose and identify potential biomarkers associated with response to infliximab by an agnostic proteomic strategy. Particularly, one SELDI peak identified as PF4 (2H+) was associated with response to infliximab in the CD patients tested and presented higher intensity levels for non responders. This may suggest an association between platelet metabolism and response to infliximab. However, this association could not be confirmed by measurement of PF4 by ELISA neither by quantifying sCD40L, another platelet activation marker. The identification of other biomarkers selected by this proteomic study requires further inquiries and these preliminary results still need to be confirmed in a large independent cohort of patients, also allowing for multivariate analysis including other potential confounding factors, such as disease location or co-treatments.
Acknowledgments
This research was supported by "Region Wallonne", grant number 114876, the National Fund for Scientific Research (FRS- NRS, Belgium), the "Fonds d'lnvestissement pour la Recherche Scientifique" (FIRS), CHU, Liege, Belgium and the Fonds Leon Fredericq, University of Liege.
M..F. and P.G are Research Associates, M.-P. M. and E.L are Senior Research Associates at FNRS (National Fund for Scientific Research, Belgium).
We thank the GIGA Bioinformatics Platform, GIGA, ULg, Liege Belgium (http://www.giga.ulg.ac.be) for bioinformatics data analysis and development and the company PEPITe, Sciences Park, Sart Tilman, Liege, Belgium (http://www.pepite.be) for the software PEPITo™.
References
[1] Rutgeerts P, Van Assche G, Vermeire S. Optimizing anti-TNF treatment in inflammatory bowel disease. Gastroenterology 2004;126:1593-610.
[2] Rutgeerts P, Van Assche G, Vermeire S. Review article: infliximab therapy for inflammatory bowel disease—seven years on. Aliment Pharmacol Ther 2006;23:451-63.
[3] Rutgeerts P, Sandborn WJ, Feagan BG, et al. Infliximab for induction and maintenance therapy for ulcerative colitis. N Engl J Med 2005;353: 2462-76.
[4] Kupcova V, Turecky L, Detkova Z, Prikazska M, Keleova A. Changes in acute phase proteins after anti-tumor necrosis factor antibody (infliximab) treatment in patients with Crohn's disease. Physiol Res 2003;52:89-93.
[5] Dideberg V, Theatre E, Farnir F, et al. The TNF/ADAM 17 system: implication of an ADAM 17 haplotype in the clinical response to infliximab in Crohn's disease. Pharmacogenet Genomics 2006;16:727-34.
[6] Gustot T, Lemmers A, Louis E, et al. Profile of soluble cytokine receptors in Crohn's disease. Gut 2005;54:488-95.
[7] Mascheretti S, Schreiber S. The role of pharmacogenomics in the prediction of efficacy of anti-TNF therapy in patients with Crohn's disease. Pharmacogenomics 2004;5:479-86.
[8] Hlavaty T, Pierik M, Henckaerts L, et al. Polymorphisms in apoptosis genes predict response to infliximab therapy in luminal and fistulizing Crohn's disease. Aliment Pharmacol Ther 2005;22:613-26.
[9] Louis EJ, Watier HE, Schreiber S, et al. Polymorphism in IgG Fc receptor gene FCGR3A and response to infliximab in Crohn's disease: a subanalysis of the ACCENT I study. Pharmacogenet Genomics 2006;16:911-4.
[10] Mitoma H, Horiuchi T, Hatta N, et al. Infliximab induces potent antiinflammatory responses by outside-to-inside signals through transmembrane TNF-alpha. Gastroenterology 2005;128:376-92.
[11] Petricoin EF, Ornstein DK, Liotta LA. Clinical proteomics: applications for prostate cancer biomarker discovery and detection. Urol Oncol 2004;22: 322-8.
[12] Coombes KR, Morris JS, Hu J, Edmonson SR, Baggerly KA. Serum proteomics profiling—a young technology begins to mature. Nat Biotechnol 2005;23:291-2.
[13] de Seny D, Fillet M, Meuwis MA, et al. Discovery of new rheumatoid arthritis biomarkers using the surface-enhanced laser desorption/ionization time-of-flight mass spectrometry ProteinChip approach. Arthritis Rheum 2005;52:3801-12.
[14] Meuwis MA, Fillet M, Geurts P, et al. Biomarker discovery for inflammatory bowel disease, using proteomic serum profiling. Biochem Pharmacol 2007;73: 1422-33.
[15] Geurts P, Fillet M, de Seny D, et al. Proteomic mass spectra classification using decision tree based ensemble methods. Bioinformatics 2005;21:3138-45.
[16] Lam YW, Mobley JA, Evans JE, Carmody JF, Ho SM. Mass profiling-directed isolation and identification of a stage-specific serologic protein biomarker of advanced prostate cancer. Proteomics 2005;5:2927-38.
[17] Gao Q, Meijer MJ, Schluter UG, et al. Infliximab treatment influences the serological expression of matrix metalloproteinase (MMP)-2 and -9 in Crohn's disease. Inflamm Bowel Dis 2007;13:693-702.
[18] Simi M, Leardi S, Tebano MT, Castelli M, Costantini FM, Speranza V. Raised plasma concentrations of platelet factor 4 (PF4) in Crohn's disease. Gut 1987;28:336-8.
[19] Slungaard A. Platelet factor 4: a chemokine enigma. Int J Biochem Cell Biol 2005;37:1162-7. [20] Bikfalvi A. Platelet factor 4: an inhibitor of angiogenesis. Semin Thromb Hemost 2004;30:379-85.
[21] Danese S, Motte Cd Cde L, Fiocchi C. Platelets in inflammatory bowel disease: clinical, pathogenic, and therapeutic implications. Am J Gastroenterol 2004;99:938-45.
[22] Louis E, Vermeire S, Rutgeerts P, et al. A positive response to infliximab in Crohn disease: association with a higher systemic inflammation before treatment but not with -308 TNF gene polymorphism. Scand J Gastroenterol 2002;37:818-24.
[23] Danese S, de la Motte C, Sturm A, et al. Platelets trigger a CD40-dependent inflammatory response in the microvasculature of inflammatory bowel disease patients. Gastroenterology 2003;124:1249-64.
[24] Danese S, Sans M, Scaldaferri F, et al. TNF-alpha blockade down-regulates the CD40/CD40L pathway in the mucosal microcirculation: a novel anti-inflammatory mechanism of infliximab in Crohn's disease. J Immunol 2006;176:2617-24.