Consequences of Selection for Milk Quality and Robustness Traits
C. Bastin 1, D.P. Berry 2, M.P. Coffey 3, E. Strandberg 4, J.I. Urioste 4,5, R.F. Veerkamp 6,and N. Gengler 1,7
1 Animal Science Unit, Gembloux Agro-Bio Tech, University of Liège, B-5030 Gembloux, Belgium 2
Moorepark, Teagasc, Ireland
3 Sustainable Livestock Systems Group, Scottish Agricultural College, EH25 9RG United Kingdom 4Dept. Animal Breeding and Genetics, Swedish University of Agricultural Sciences, SE-750 07 Uppsala, Sweden
5Depto. Prod. Animal y Pasturas, Fac. de Agronomía, UDELAR, Garzón 780, 12900 Montevideo, Uruguay 6
Animal Breeding and Genomics Centre, Wageningen University, Wageningen, the Netherlands 7
National Fund for Scientific Research, B-1000 Brussels, Belgium
Introduction
A multitude of studies in dairy cattle (Pryce and Veerkamp, 2001) have shown that selection for higher milk yield alone is associated with reduced health and fertility. For this reason, most countries are now including an increasing number of non-productive and functional traits (e.g., conformation, longevity, udder health, calving performances, workability) in their national dairy breeding objectives. Breeding programs could also include other functional and robustness traits (e.g. feed efficiency or energy balance) but also other traits like animal welfare, human health, environmental impact of milk production, or product quality. Even if these new traits currently have no (or undefined) monetary value, it is suggested that better overall economic efficiency could be achieved if they are included in breeding goals. However, before doing this, the consequences of shifting emphasis from the current traits in the breeding objective to these new traits should be investigated particularly given that genomics is likely to lead to accelerated rates of gain.
The objective of this study was to estimate the consequences of selection for new robustness and milk quality traits on genetic gain in other economically important traits. The study was conducted in 3 steps. First the total merit indexes of five European countries/regions participating in the EU project ROBUSTMILK were compared and several scenarios of selection were defined. Second, genetic correlations among traits were estimated based on the estimated breeding values (EBV) of Walloon Holstein bulls. Finally consequences of selection under the different scenarios (e.g. inclusion of new robustness and milk quality traits) were studied using selection index theory. New traits considered were body
condition score (BCS) for robustness and dUNSAT and dMONO for milk quality. These two indices represent the relative part of milk fat that is unsaturated or mono-unsaturated.
Materials and Methods
National selection indices
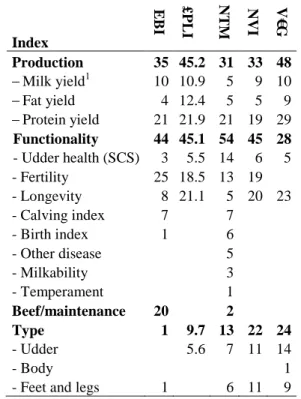
Table 1 shows the relative emphasis on traits in national breeding objectives for EBI (Ireland), £PLI (Great Britain), NTM (Denmark, Finland and Sweden; DFS), NVI (Flanders and the Netherlands), and V€G (Walloon Region of Belgium).
Table 1. Relative emphasis on traits in national
selection indices in June 2011.
Index EB I £ P LI N TM NVI V€ G Production 35 45.2 31 33 48 − Milk yield1 10 10.9 5 9 10 − Fat yield 4 12.4 5 5 9 − Protein yield 21 21.9 21 19 29 Functionality 44 45.1 54 45 28 - Udder health (SCS) 3 5.5 14 6 5 - Fertility 25 18.5 13 19 - Longevity 8 21.1 5 20 23 - Calving index 7 7 - Birth index 1 6 - Other disease 5 - Milkability 3 - Temperament 1 Beef/maintenance 20 2 Type 1 9.7 13 22 24 - Udder 5.6 7 11 14 - Body 1
- Feet and legs 1 6 11 9
Values from Table 1 were updated from the review of Miglior et al. (2005). Traits were grouped together under 4 components: production, functionality, beef/maintenance, and conformation. Relative emphasis was expressed as a percentage and was computed as the ratio of every economic weight multiplied by the corresponding breeding value standard deviation divided by the sum of the absolute values of these.
Approximate genetic correlations among traits Estimated breeding values of the August 2011 routine run for the Walloon region of Belgium were extracted for Holstein bulls with a reliability ≥ 0.85. Breeding values were available for the following traits:
− production: milk, fat, and protein yield (1274 bulls),
− udder health: somatic cell score (under the Walloon definition, lower values of SCS are desirable; 1192 bulls),
− longevity: survival over successive lactations (275 bulls),
− fertility: pregnancy rate (589 bulls), − udder: overall udder score (548 bulls), − feet and legs: overall feet and legs score
(371 bulls),
− BCS: EBVs are expressed as the minimum daily EBV for BCS before 200 DIM (Bastin et al., 2010) (higher values are desirable; 231 bulls),
− milk fatty acids: dUNSAT and dMONO (these two indices represent the relative part of milk fat that is unsaturated or mono-unsaturated, high values are desirable; 314 bulls).
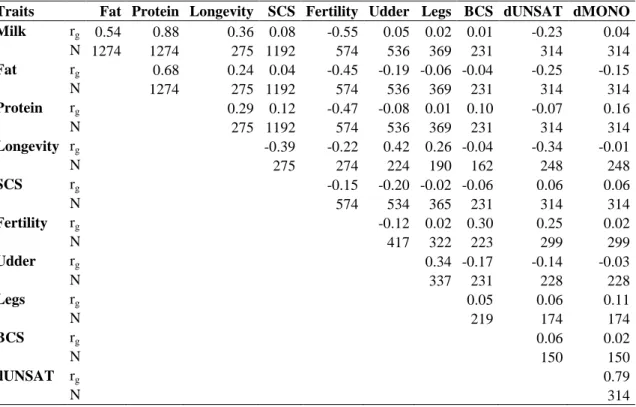
Genetic correlations among traits were approximated as correlations among EBVs. Table 2 shows the approximate genetic correlations obtained and the number of bulls used to estimate each correlation. Most of the bulls used to approximate genetic correlations originated from the United States, then the Netherlands, Canada, France and Germany.
Response to selection
Six alternative “European” total merit indexes were defined and included traits for which breeding values were available in the Walloon Region. Relative genetic changes for each trait from selection based on these alternative total merit indexes were estimated as 𝒓 = 𝒃′𝑮 where 𝒓 = vector of relative genetic gain on all traits; and 𝒃 = optimal index weights; 𝑮 = matrix of genetic covariances between index traits and goal traits. Optimal index weights b were calculated as 𝒃 = 𝑷−𝟏𝑮𝒗 where 𝑷 = matrix of genetic covariances among index traits, and 𝒗 = vector of relative economic values of goal traits. Selection intensity was set to 1 and for one generation. All scenarios are listed in Table 3.
Table 2. Genetic correlations (rg) approximated as correlations among EBVs and the number of bulls
used to estimate the correlations; all traits are defined above.
Traits Fat Protein Longevity SCS Fertility Udder Legs BCS dUNSAT dMONO
Milk rg 0.54 0.88 0.36 0.08 -0.55 0.05 0.02 0.01 -0.23 0.04 N 1274 1274 275 1192 574 536 369 231 314 314 Fat rg 0.68 0.24 0.04 -0.45 -0.19 -0.06 -0.04 -0.25 -0.15 N 1274 275 1192 574 536 369 231 314 314 Protein rg 0.29 0.12 -0.47 -0.08 0.01 0.10 -0.07 0.16 N 275 1192 574 536 369 231 314 314 Longevity rg -0.39 -0.22 0.42 0.26 -0.04 -0.34 -0.01 N 275 274 224 190 162 248 248 SCS rg -0.15 -0.20 -0.02 -0.06 0.06 0.06 N 574 534 365 231 314 314 Fertility rg -0.12 0.02 0.30 0.25 0.02 N 417 322 223 299 299 Udder rg 0.34 -0.17 -0.14 -0.03 N 337 231 228 228 Legs rg 0.05 0.06 0.11 N 219 174 174 BCS rg 0.06 0.02 N 150 150 dUNSAT rg 0.79 N 314
Scenario 2 was the reference point for scenarios 3 to 6: changes in relative emphasis for one or several trait(s) affected proportionally all other traits. Scenarios were:
1) selection for production traits only: included only milk, fat, and protein yield derived from the average values of Table 1;
2) “current” European selection: included traits that are currently in the national indices; relative emphasis were derived from the average values of Table 1;
3) more emphasis on the current functional traits: overall emphasis on functionality was 55% (as for DFS index) with greater emphasis on fertility (20%) and udder health (15%) but the same emphasis on longevity (20%) than in scenario 2;
4) selection pressure on the new robustness traits: included BCS (10% of emphasis) which is considered as an indicator of the extent of negative energy balance in dairy cows;
5) selection for the new milk quality traits: included dUNSAT and dMONO (10% of emphasis), these indices represent the relative part of milk fat that is unsaturated or mono-unsaturated; higher proportion of unsaturated FA in milk fat are considered as beneficial for human health;
6) selection for both milk quality traits and functionality/robustness traits: combination of scenarios 3 to 5 and placed 15% emphasis on udder health, 20% emphasis on fertility, 10% emphasis on BCS, and 10% on milk quality traits .
Table 3. Selection scenarios .
Scenario 1 2 3 4 5 6 Production 100 45 33.75 40.5 40.5 18.75 - Milk yield1 22 10 7.50 9 9 4.17 - Fat yield 18 8 6.00 7.2 7.2 3.33 - Protein yield 60 27 20.25 24.3 24.3 11.25 Functionality 40 55 36 36 55 - Longevity 20 20 18 18 20 - Udder health 5 15 4.5 4.5 15 - Fertility 15 20 13.5 13.5 20 Type 15 11.25 13.5 13.5 6.25 - Udder 7 5.25 6.3 6.3 2.92 - Feet and legs 8 6 7.2 7.2 3.33
New traits 10 10 20
- BCS 10 10
- dUNSAT 5 5
- dMONO 5 5
1
Results and Discussion
National selection indices
Table 1 indicates that countries/regions in this study place 31% to 48% emphasis on production traits while Miglior et al. (2005) reported in 2005 that most countries placed at least 50% emphasis on the production component. This observation confirms the increasing emphasis given to the non-production traits. Moreover, national indices differ in the number of functional traits included in the indices. DFS includes a total of 8 functional traits while the Walloon Region includes only longevity and udder health. Also, Ireland and DFS place some emphasis on beef /maintenance traits, 20% and 2% of relative emphasis, respectively. Finally, relative emphasis placed on type traits vary from 1% to 24% but is rather related to the “functional type traits” such as udder and feet and legs traits.
Expected genetic changes under several selection scenarios
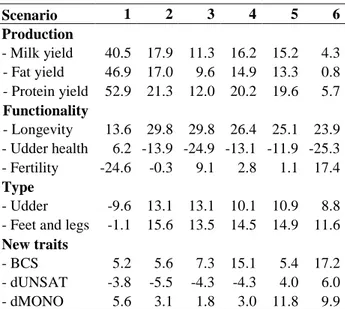
Relative genetic gains expected on all traits under the different scenarios are presented in Table 4.
It should be noted that results have to be interpreted carefully. First, because expected genetic gains under all selection scenarios are greatly influenced by the genetic correlations among traits (Table 2). These correlations were approximated as the correlations among EBVs. Although only EBVs with reliability greater than 0.85 were used, the number of bulls used to estimate correlations remains low: from 150 to 1274. Further studies should provide more reliable correlation estimates among traits, especially for the novel traits for which low number of bulls have breeding values estimated with high reliability. Second, the responses presented in Table 4 assume that all breeding values for all traits have equal reliability. That might not be the case at the moment of selection. It is therefore somewhat idealized scenarios for demonstration purposes. In practice accuracy will differ due to heritability and different recording (e.g. longevity and fertility).
Results in Table 4 indicated that selection for production traits only (scenario 1) lead to large
improvements in yield, especially protein yield (+53%). However, such selection resulted in higher SCS (+6%), and to poorer fertility performance (-25%). These results were as previously suggested by several authors who indicated that selection for milk yield alone is likely to reduce fertility (Pryce and Veerkamp, 2001). Also unfavorable correlated responses were also observed for overall udder score (-10%). Selection indexes with balanced emphasis on both production and non-production traits (scenarios 2 to 5; from 34 to 45% emphasis on production traits) resulted in improvements of milk, fat, and protein yield (genetic gain from +10% to +21%) but also favorable genetic gains in most of the other traits. Finally, selection with scenario 6 (only 19% emphasis on production) provided low genetic gain for milk, fat and protein yield (genetic gain between +1% and +6%) but great improvements of functional traits: +24% for longevity, -25% for SCS, and 17% for fertility.
The “current European” breeding goal (scenario 2) gave desirable genetic gain on all traits except for dUNSAT (-6%) and fertility (0%). Greater emphasis should therefore be placed on fertility to achieve genetic improvement in that trait. Emphasis of 20% on fertility combined with greater emphasis on udder health (scenario 3) lead to improved fertility (+9%) and reduced SCS (-25%). Inclusion of BCS into the total merit index (scenario 4) was associated with slightly improved fertility (+3%), while selection under scenario 6 (i.e. lower emphasis on production, 20% emphasis on fertility, and 10% emphasis on BCS) resulted in 17% improvements in fertility. These results reinforce that selection for higher BCS is related to improved fertility. The approximate genetic correlation between pregnancy rate and BCS was 0.30 (Table 2).
Under all scenarios, favorable genetic gain was expected for longevity: from +14% to +30%. These results could be explained by the positive genetic relationships between longevity and milk, fat, and protein yield, and SCS. Furthermore, current selection (scenario 2; 5% emphasis on udder health) lead to reduced SCS (-14%) but greater improvements (-25%) could be achieved with 15% emphasis on udder health under scenarios 3 and 4.
Slightly favorable genetic gain was expected on BCS (+5%) under scenario 1 while previous studies indicated that selection for higher milk yield is related to lower BCS. This was probably due to the low correlations between EBVs for BCS and milk, fat, and protein yield (Table 2). Higher emphasis on BCS (scenario 4) did not affect greatly traits other than fertility as genetic correlations were low (Table 2). However including BCS in a selection index should be considered as BCS is an indirect indicator of health and fertility rather than a trait of economic importance.
Changes in the balance between production and functional traits did not seem to affect genetic gain on milk quality traits: genetic gains were low under scenarios 1 to 4 and ranged between +2% and +6% for dMONO and -4% and -6% for dUNSAT. A relative emphasis of 2.5% on dUNSAT and dMONO would be required to have no genetic changes on dUNSAT; such economic index would lead to 7% of genetic gain for dMONO. Under scenarios 5 and 6, 5% emphasis on dUNSAT and dMONO provides favorable genetic gain: about 5% for dUNSAT and 10% for dMONO. However further studies should be conducted to determine what would be the optimal emphasis on both classical production traits and new milk quality traits to maximize incomes from milk with desirable fatty acids profile.
Table 5. Relative genetic gain expected on all
traits under each scenario.
Scenario 1 2 3 4 5 6 Production - Milk yield 40.5 17.9 11.3 16.2 15.2 4.3 - Fat yield 46.9 17.0 9.6 14.9 13.3 0.8 - Protein yield 52.9 21.3 12.0 20.2 19.6 5.7 Functionality - Longevity 13.6 29.8 29.8 26.4 25.1 23.9 - Udder health 6.2 -13.9 -24.9 -13.1 -11.9 -25.3 - Fertility -24.6 -0.3 9.1 2.8 1.1 17.4 Type - Udder -9.6 13.1 13.1 10.1 10.9 8.8 - Feet and legs -1.1 15.6 13.5 14.5 14.9 11.6
New traits
- BCS 5.2 5.6 7.3 15.1 5.4 17.2 - dUNSAT -3.8 -5.5 -4.3 -4.3 4.0 6.0 - dMONO 5.6 3.1 1.8 3.0 11.8 9.9
Conclusion
Current breeding goals put more balanced emphasis on both production and non-production traits which lead to total merit indexes including an increasing number of functional traits. Such indices lead to favorable genetic gains on production but also on most of the other traits. Also current selection indices do not affect greatly new traits: BCS and dMONO are slightly favorably affected and dUNSAT is slightly negatively affected.
Further studies will focus on two major points: 1) providing more reliable estimates of genetic correlations among traits as these estimates influence largely the results, and 2) including other new robustness and milk quality traits (energy balance indicators, new udder health traits, etc.) in the alternative indexes.
Acknowledgments
This research receives a financial support from the European Commission, Directorate-General for Agriculture and Rural Development, under Grand Agreement 211708 and form the Commission of the European Communities, FP7, KBBE-2007-1. This paper does not necessarily reflect the view of these institutions and in no way anticipates the Commission’s future policy in this area. Nicolas Gengler (Research Associate) acknowledges his support by the National Fund for Scientific Research (Brussels, Belgium)
References
Bastin, C., Gillon, A., Massart, X., Soyeurt, H., Vanderick, S., Bertozzi, C. & Gengler, N. 2010. Genetic evaluation for body condition score in the Walloon Region of Belgium. Interbull Bulletin 42, 85-90.
Miglior, F., Muir, B.L. & Van Doormaal, B.J. 2005. Selection indices in Holstein cattle of various countries. J. Dairy Sci. 88, 1255-1263. Pryce, J.E. & Veerkamp, R.F. 2001 The
incorporation of fertility indices in genetic improvement programs. BSAS Occasional Publication 26, 237–250.