ANNUAL CYCLE OF PELAGIC METABOLISM IN THE SCHELDT ESTUARY
F. Gazeau
1, 2
, A. V. Borges
1
, L. -S. Schiettecatte
1
, J. Middelburg
3
, M. Frankignoulle
1
& J. -P. Gattuso
2
INTRODUCTION
Estuaries are semi-enclosed zones where continental dissolved and particulate material transfer to the coastal zone. These systems are usually characterized by strong physico-chemical gradients and enhanced biological activity due to high inputs of organic matter and nutrients from rivers.
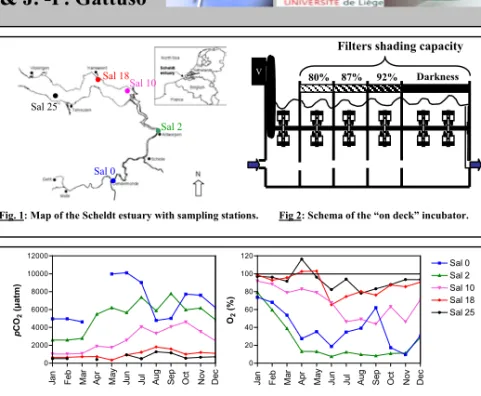
The Scheldt estuary is a turbid, eutrophic coastal plain estuary in the southwest of the Netherlands and northwest of Belgium (Fig. 1). It drains about 21,580 km2of land in one
of the most densely populated and highly industrialised regions of Europe. The residence time of water in the entire estuary is approximatively 75 days.
We present results of pelagic gross primary production (GPP), community respiration (CR) and nitrification (Nit), measured by the oxygen Winkler method, from an annual study in 2003. Five stations along the estuary were monthly investigated at fixed salinities (0, 2, 10, 18 and 25; see the average position of each station in Fig. 1).
MATERIAL & METHODS
Surface water was sampled with a Niskin bottle at sunrise and incubated on deck until sunset in 60ml glass bottles stored in a 5-compartment incubator kept at in situ temperature by flowing water (Fig. 2). Irradiance was controlled in each compartment by filters having a shading capacity ranging from 0 to 100%. In order to avoid sedimentation of particulate material in samples, bottles were fixed on rotative axes (1 tr/min).
Oxygen concentration was measured on board within 2 days by the Winkler method. The estimation of the oxygen consumption due to respiration and nitrification processes was assessed by incubating samples, in the dark compartment, with and without addition of nitrification inhibitors (N-serve and Chlorate). Moreover, surface partial pressure
of CO2 (pCO2) was also measured at the beginning of the incubations.
V 80% 87% 92% Darkness
Filters shading capacity
Fig 2: Schema of the “on deck” incubator.
RESULTS
9 pCO
2and O
2concentrations
9 Integrated metabolic results
Very low O2concentrations and high pCO2were found in the inner part of the estuary (sal 0 and 2), with the lowest O2concentration found at salinity 2 (7.4%) and the highest
pCO2 measured at salinity 0 (10110 µatm) in June (Fig. 3). In the freshwater part (sal 0), a decrease of pCO2and an increase of O2concentrations were observed in summer well related to high GPP and positive NCP values measured in this section of the estuary during this period (see next section). In the lower part of the estuary (sal 18 and 25),
O2oversaturation (highest in April; 116% at salinity 25) was found in spring; pCO2values measured during this period correspond to the lowest ones observed in the estuary in
2003 (lowest value in April at sal 25: 400 µatm).
Fig. 3: Surface pCO2 and O2 (%) at each incubated station over an annual cycle.
0 2000 4000 6000 8000 10000 12000 Ja n Oc t Ap r Au g Se p Ju n Ma y Ju l Ma r Fe b No v De c p CO 2 (µ at m) 0 20 40 60 80 100 120 Sal 0 Sal 2 Sal 10 Sal 18 Sal 25 Ja n Oc t Ap r Au g Se p Ju n Ma y Ju l Ma r Fe b Nov Dec O2 (%)
Fig. 4: Integrated gross primary production (GPP), nitrification (Nit), community respiration (CR) and net community production (NCP) values.
0 50 100 150 200 250 Ja n Oc t Ap r Au g Se p Ju n Ma y Ju l Ma r Feb Nov Dec G PP ( m m ol C m -2 d -1) 0 2 4 6 8 10 12 14 16 18 20 22 Ja n Oc t Ap r Au g Se p Ju n Ma y Ju l Ma r Feb Nov Dec N it (m mo l C m -2 d -1) -350 -300 -250 -200 -150 -100 -50 0 Ja n Oc t Ap r Aug Sep Ju n Ma y Ju l Ma r Fe b No v De c CR (m m ol C m -2 d -1) -350 -250 -150 -50 50 150 Ja n Oc t Ap r Aug Sep Ju n Ma y Ju l Ma r Fe b No v De c Sal 0 Sal 2 Sal 10 Sal 18 Sal 25 NC P ( m m ol C m -2 d -1)
Oxygen-based rates were converted into carbon assuming a photosynthetic quotient of 1.3 based on simultaneous O2and DIC incubations (data not shown), a molar 02/C of 14
for Nit based on simultaneous O2and 14C incubations (data not shown) and a respiration quotient of 1. NCP is the difference between organic matter production (GPP + Nit)
and mineralization (CR). Highest GPP values (Fig. 4) were found in the freshwater part of the estuary in summer, reaching a maximal rate in August (230 mmol C m-2d-1). At
salinity 2, two peaks were observed (June and August). Lowest GPP values were found at salinity 10. Nitrification rates were highest at salinity 2 reaching a maximal rate in
May (20 mmol C m-2d-1; 50% of total primary production). CR values were highest in the inner part and presented 2 major peaks (May and October). Most of the time, the
system was heterotrophic (NCP<0) excepted in April in the lower part and in summer in the freshwater and lower parts.
DISCUSSION & CONCLUSION
Acknowledgments
This study showed the strong heterotrophic status of the turbid Scheldt estuary over an annual cycle. Annual averaged NCP values along the salinity gradient are presented in Fig. 5 and compared with a previous model-based estimate. Higher NCP values were observed but showing the same trend along the salinity gradient. Net Community
Production rates measured during these campaigns are among the lowest reported in the literature, leading to elevated pCO2and low O2concentrations in surface waters,
especially in the inner part of the estuary.
The nitrification process accounted for a significative part of the oxygen consumption (and organic matter production) especially at salinity 2 where the annual average nitrification rate represented almost 30% of total organic matter production.
We would like to thank the crew of the Luctor and RV Belgica for their participation and help during these cruises, Jan Sinke for nutrient and pigments analysis, Natacha Brion for 14C-nitrification measurements, Maria Andersson for 15N-nitrification measurements and Jan Peene for surface light data. This research was supported by the European Union in the framework of the EUROTROPH project (contract # EVK3-CT-2000-00040), and through a CNRS/CGRI/FNRS cooperative agreement.
0 5 10 15 20 25 30 -1000 -750 -500 -250 0 Our Results Soetaert & Herman Model
Salinity NCP ( g C m -2 yr -1) Hydrobiologia 311: 247-266, 1995
1
Université de Liège, Belgium (f.gazeau@ulg.ac.be)
2
Observatoire Océanologique de Villefranche-sur-mer, France
3
Netherlands Institute of Ecology, The Netherlands
Fig. 5: Annual averaged NCP rates, comparisonwith Soetaert & Herman (1995) model results.
Fig. 1: Map of the Scheldt estuary with sampling stations.
EUROTROPH project: http://www.ulg.ac.be/oceanbio/eurotroph/
Sal 25
Sal 18 Sal 10
Sal 2