Effect of groundnut cake substitution by glandless cottonseed kernels on broilers production: 1
animal performance, nutrient digestibility, carcass characteristics and fatty acid composition 2
of muscle and fat. 3
4
Mamadou Tandiang Diaw1, Abdoulaye Dieng1, Guy Mergeai2, Ibrahima Youssouf3, Jean-5
Luc. Hornick4 6
1
University of Thiès, UFR SADR, Department of Animal Production, Senegal 7
2
Gembloux Agricultural University, Department of Tropical Crop Husbandry and 8
Horticulture, Belgium 9
3
Abéché University of Sciences and Technics, Tchad 10
4
University of Liege, Faculty of Veterinary Medicine, Department of Animal Production, 11
Belgium. 12
13
Address for communication: J.-L. Hornick, University of Liege, Faculty of Veterinary 14
Medicine, Department of Animal Production, Boulevard de Colonster B43, 4000 Liège, 15
Belgium, Fax: +3243664122, Tel: +3243664131, Email: jlhornick@ulg.ac.be 16
Abstract 1
A study has been conducted with broilers to assess, during the rainy season, the effects of 2
groundnut cake substitution by glandless cottonseed kernel (CSK), at levels of 0, 25, 50 and 3
75%. The substitution improved linearly feed intake and animal growth, as well as carcass 4
component weights and allometric parameters. The CSK increased the C18:2 n-6 to C18:1 n-9 5
ratio, as well in diet as in meat and subcutaneous fat. In order to explain the observed 6
performances, the possibility is considered that broilers used preferentially C18:2 n-6 fatty 7
acids for their metabolism. Complete glandless cottonseed kernels are probably highly 8
valuable for broilers production in warm and wet conditions. 9
10
Key words: Groundnut cake; cottonseed kernels; glandless; broilers 11
12
Short title: Glandless cottonseed kernels in broilers 13
Introduction 1
2
Cotton is the second best protein-producing plant in the world after soybean and the seeds are 3
potentially a valuable feed for poultry. The presence of the terpenoid aldehyde gossypol, 4
particularly noxious for monogastrics (Lusas and Jinidin, 1987; Alford et al., 1996; Morgan et 5
al., 1988; Willard et al., 1995), prevents however the extensive use of cotonseed by-products 6
in this species (Azman and Yilmaz, 2005), inasmuch as they are often high in cellulose 7
(Gamboa et al., 2001; Ojewola et al., 2006). 8
Some decades ago, a cotton mutant totally devoid of gossypol has been discovered but despite 9
the high nutritive value of the seeds, efforts ended up in commercial failure because of the 10
plant’s susceptibility to insects (Altman et al., 1990). 11
Breeding efforts are now being made in different parts of the world to develop cotton varieties 12
presenting gossypol glands in their aerial organs but not in the seeds (Vroh bi et al, 1999; 13
Sunilkumar et al., 2006). The progresses made in this field could lead to the production of 14
cotton seeds available for monogastric. 15
Litterature reporting the use of cotton cake in poultry exists (Ojewola et al., 2006; 16
Nagalakshmi et al., 2007). That concerning the effects of glandless varieties is, as for it, 17
scarce (Yo, 1991). Like cottonseed meal, cotton seed kernels (CSK) are high in protein, but 18
they are also naturally high in lipids, low in fibre, and they do not require high technicality to 19
be obtained. Moreover, lipids are intracellular and are thus presumably better protected 20
against oxidation than oils offered as energy source in poultry. 21
The aim of this experiment was thus to study, in broilers, the effects of groundnut cake 22
substitution by increasing levels of CSK deprived of gossypol glands on animal performance, 23
nutrient digestibility, carcass characteristics and fatty acid composition of broilers’muscle and 24
subcutaneous fat. 25
Materials and Methods 1
2
The trial was approved by the Ethical Committee of the Faculty of Veterinary Medicine of the 3
University of Liège (Belgium). The experiment was planned at the end of the rainy season 4
2006, at the Experimental Station of the Formation and Research Unity of Agronomic Science 5
and Rural Development of the University of Thiès (Senegal). 6
During the experiment, temperature and moisture were daily recorded at 07.00 a.m., 01.00 7
p.m. and 06.00 p.m. The mean temperature was 31.0°C, with minima and maxima of 26.8 ± 8
2.2°C and 34.1 ± 2.0°C measured respectively at 07.00 a.m. and 01.00 p.m., and mean 9
moisture was 60.2%, comprised between 48.0 ± 9.7% and 71.5 ± 10.7%. 10
Four hundred 1-d-old unsexed and unidentified Cobb 500 broilers were used in this 11
experiment. They were randomly assigned to four groups: a control group (CG) that received 12
a diet containing groundnut cake as main protein source, and 3 other groups that received 13
diets in which groundnut cake was substituted with increasing levels of shelled gossypol-free 14
cotton seed kernels produced from Gossypium hirsutum cultivar GL7 (25, 50 and 75% 15
substitution for G25, G50 and G75 groups, respectively). Each group was divided in two 16
homogenous blocks. 17
A starting diet was used until 21 days old and a growing diet was offered afterwards until 18
slaughter at d45. The different diets were formulated to present theoretical proteic and iso-19
energetic characteristics. Iso-EE diets levels were ensured by the use of groundnut oil 20
addition, with respect to the levels of substitution. Consequently, levels of nutrients were that 21
recommended by the National Research Council (NRC, 1994), but ME that was expected to 22
be slightly higher than classical recommendations. Feed and water were provided on a 23
marginal ad libitum basis for the duration of the experiment. 24
Individual body weights (BW) were obtained on d1 and once a week thereafter. Birds were 1
observed twice daily to assess healthiness and death occurrence. Feed intake (FI) was 2
recorded weekly. 3
At the end of the experiment, 5 animals par group were randomly chosen and killed by 4
cervical rupture. They were eviscerated for carcass characteristics determination. Individual 5
weights of carcass, breast, legs and wings were measured. Samples of breast muscle and 6
subcutaneous adipose tissue were obtained on each carcass and frozen for further chemical 7
analyze. 8
Nutrient digestibility was evaluated with five additional 6-w-old Cob 500 broilers, mean BW 9
of 1300 g, for each of the 4 diets and two periods. They were penned in individual 10
metabolism cages and, after an adaptation period, feed intakes, refusals and faeces were 11
obtained once a day over a period of 7 d. Nutrient digestibility was calculated as the ratio 12
(nutrient intake – faecal nutrient) / nutrient intake. 13
The prophylactic program was the one used in poultry production in Senegal and during the 14
experimental period no sanitary trouble was identified. 15
The amino acid composition of the cotton seeds was obtained by liquid chromatography and 16
compared to that of the groundnut as reported by the literature (Henry et al., 2001), allowing 17
thus subsequent formulation. Aflatoxins levels (B1 , B2, G1 and G2) were determined in 18
groundnut cake and in the control diets by liquid chromatography according to the 92/95 and 19
94/14 directives of the European Commission. Total and free gossypols in diets were 20
determined according to the 72/199/CEE directive of the European Commission. 21
Dry matter (DM), ash, crude fiber (CF) and ether extract (EE) were analysed according to 22
AOAC (1990) procedures. Crude protein was determined by the Kjedahl method, as nitrogen 23
(N) x 6.25. Calcium (Ca), magnesium (Mg), iron (Fe), zinc (Zn) and copper (Cu) were 24
determined by atomic absorption and potassium (K) and sodium (Na) by flame emission. 25
Total phosphorus (P) was determined by spectophotometry. Sample solutions were prepared 1
using wet digestion procedure. 2
Metabolizable Energy (ME) was calculated by an indirect method, using the INRA equation 3
(1984) where True ME (Mj/kg DM) = (3951 + 54.4 EE − 88.7 CF − 40.8 ash)*0.004184, 4
where nutrient contents are expressed in % DM. 5
The determination of the fatty acid profile of diets, meat and fat was performed using gas 6
chromatography (GC) after extraction and trans-esterification of fatty acids according to the 7
method of Sukhija and Palmquist (1988). A combined one-step extraction and esterification 8
method was carried out using a mixture of solvents containing methanol, benzene and acetyl 9
chloride, to produce the different fatty acid methyl esters. The internal standard was 10
nonadecylic acid (C19:0). A 1 µl aliquot was injected into a Chrompack CP 9001 11
chromatograph (Middelburg, The Netherlands) fitted with a CP-9010 automatic liquid 12
sampler, a split-splitless injector and a 901A flame ionization detector (Chrompack, 13
Middelburg, The Netherlands). The GC system was fitted with an Omegawax 320 fused silica 14
capillary column (30 m x 32 mm i.d.) with a stationary polyethylene glycol phase (Supelco, 15
Bellefonte, United States of America) coated with a 0.25 µm film thickness. Hydrogen was 16
used as carrier gas at a pressure on the top of the column of 50 kPa. The column temperature 17
was programmed from 120 to 240 °C at a rate of 5 °C/min. The temperatures of the injection 18
port and detector were 250 °C and 260 °C respectively. The injection was performed in the 19
split mode with a split ratio of 1:25. The software Alltech Allchrome Plus Chromatography 20
Data System Version 1.4.2.1, Alltech Associates Inc., Lokeren, Belgium) was used for data 21
processing. Fatty acids were identified by comparison of their retention times with that of the 22
corresponding standard mix (Supelco 37 Component FAME Mix, Sigma-Aldrich, Bornem, 23
Belgium). 24
The data were analysed according to General Linear Models (SAS Institute, 1999). The level 1
of CSK incorporation was the main effect considered. When possible, the block and the 2
interaction level of incorporation x block effects were estimated and considered as random. 3
Owing to the variability in muscle ether extract, muscle fatty acids concentrations were 4
analysed using muscle ether extract as covariable. The fatty acids proportions in subcutaneous 5
and muscle fats (% fat) were analysed using the level of CSK incorporation, the fat 6
localisation (muscle or subcutaneous fat) and their interaction as factors of variation. 7
Means were compared according to Student’s t-test. 8
Results 1
2
The only significant B1 aflatoxin level in groundnut cake was found to be low, at 0.13 mg/kg 3
feed, allowing levels as low as 0.037 mg/kg in control diet. The amino acid profile of the 4
glandless cottonseed kernels used in this experiment was similar to that classically reported 5
for cotton cake (Table 1). Methionine and Lysine levels were close to that reported by Amipig 6
(2000) for the groundnut cake (respectively 5.2 and 16.8 vs 4.7 and 12.4 g/kg feed). 7
As expected, the high fat levels in diets, close to 100g/kg, increased ME levels above values 8
currently reported in poultry production (Table 2). Total gossypol remained largely lower 9
than the critical levels reported for poultry in the literature (Lordelo et al. 2005). Free 10
gossypol, as for it, was not detected. 11
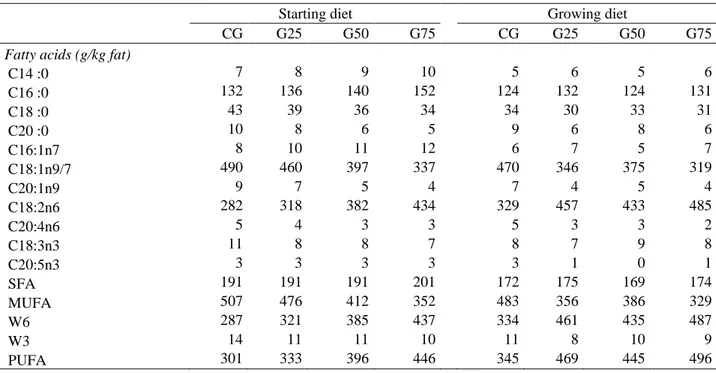
In decreasing importance, C18:1 n-9, C18:2 n-6 and C16:0 accounted for about 90% of the 12
total fatty acids of the diets (Table 3). The main characteristic of the fat diets was an inversion 13
of the ratio C18:1/C18:2 between the extreme regimens (about 1.6 for CG to about 0.7 for 14
G75). The saturated fatty acids (SFA) levels remained close to 20%. Consequently, a shift 15
from a dominant monounsaturated (MUFA) to a dominant polyunsaturated (PUFA) profile 16
was observed when turning from control to G75 diet. 17
The BW at the end of the starting and of the growing period was significantly (P < 0.001) 18
affected by the level of substitution (P < 0.001; Table 4). Control group reached weight close 19
to 1100 kg at the end of the experiment vs 1900g in G75. The linear correlation between final 20
live weight and level of substitution allowed to estimate final BW for total groundnut 21
substitution at 2211 g. 22
ADG and FI were sharply affected by the level of substitution. ADG increased quasi-linearly 23
with the level of glandless seeds, as well as during the starting than during the finishing 24
period. FI almost doubled when turning from CG to G75 groups, whatever the considered 25
period. Intra-period FCR were similar between groups, although they decreased with the level 1
of CSK substitution during the growing period (2.39 in G75 vs 2.72 in CG). 2
Nutrient digestibility ranged between 65 to 74%, according to the nutrient, and was not 3
affected by the treatments (Table 5). 4
Owing to the effect of CSK on final weight, the weight of carcass and of carcass components 5
increased significantly with CSK incorporation (Table 6). However, the weights of liver, heart 6
and gizzard did not change. As a consequence, the dressing proportion increased, as well as 7
the ratio of the breast to carcass (P <0.05). Other ratio did not differ between treatments. 8
Ether extract in meat DM ranged from 63 to 77 g/kg in CG and G75, respectively, and was 9
similar between groups (Table 7). The SFA almost doubled from CG to G75 (P < 0.002) 10
while MUFA showed opposite evolution. The PUFA increased with CSK incorporation but to 11
a lesser extent (13.7 vs 18.4 g/kg DM in CG and G75 respectively, P < 0.015). As a 12
consequence, the ratios having SFA as denominator decreased significantly with CSK 13
incorporation, excepted for PUFA/SFA (NS), while PUFA/MUFA increased (more than 14
doubled), as did the ratio n-6 to n-3 fatty acids. 15
Considered individually, SFA increased with CSK incorporation but C16:0, followed with 16
C18:0, represented far the highest fraction of this family. Individual MUFA behaved as total 17
MUFA but C18:1 represented far the largest fraction of this family. Among PUFA, C18:2 n-6 18
accounted for about 75% of total PUFA. Only C18:2 n-6, C18:3 n-6 and 18:3 n-3 increased 19
significantly with CSK incorporation. However, although total n-6 fatty acids increased with 20
treatment, total n-3 fatty acids remained as low as about 9.5 g/kg muscle DM (NS). 21
The fatty acids proportions in subcutaneous and muscle fat are given in Table 8. The main 22
fatty acids found in animal fats were, by decreasing importance, C18:1, C16:0, C18:2n6 and 23
C18:0. Together, they represented 90% of the total fatty acids identified. The CSK 24
incorporation increased the proportions of SFA in subcutaneous and, especially, in meat fat (P 25
< 0.05 for the interaction effect). The mean values changed from about 30% of fat in CG to 1
42% in G75. By contrast, MUFA proportion decreased in opposite sense, ranging from about 2
45 to 50% in CG to 42% in G75, the location effect being not significant. The PUFA 3
proportions were influenced only by the level of substitution: the levels increased from about 4
21% in CG to about 25% in G75. The sum of n-6 fatty acids behaved closely to PUFA and the 5
sum of n-3 fatty acids were not influenced by treatment. Its levels were however trebled when 6
turning from subcutaneous fat to meat fat. As a consequence, the ratios containing SFA as 7
denominator decreased with CSK incorporation, especially MUFA/SFA, and were higher in 8
meat fat. By contrast, PUFA/MUFA increased with CSK incorporation while its values 9
remained higher in meat. The ratio n-6 to n-3 fatty acids increased with CSK incorporation 10
and to a largely higher extent in subcutaneous fat. 11
Taken individually, the fatty acids were essentially represented, in both fat and in decreasing 12
order, by C18:1, C16:0 or C18:2 n-6, C18:0 and C16:1. The C14:0, C16:0 and C18:0 fatty 13
acids behaved as SFA - increasing with CSK incorporation - the extent of changes being the 14
most marked for C18:0 in subcutaneous fat and similar between fatty acids in meat fat. 15
Among MUFA, C18:1 represented the very larger proportion and thus showed, with CSK 16
incorporation, a decrease similar to total MUFA. This decrease was higher in meat fat. 17
Among PUFA, C18:2 n-6 represented the very larger proportion. It showed noticeable 18
changes, increasing with CSK incorporation, but the increase was not significant in 19
subcutaneous fat and marked in meat fat. The C18:3 n-3 proportion, although weak in both 20
fats, decreased significantly with CSK incorporation in subcutaneous fat and increased in 21
meat fat. 22
Discussion 1
2
There are few recommendations concerning fat levels in poultry feeding but chicken are able 3
to tolerate very high proportions of neutral fat in the diet (Brambila and Hill, 1966). In the 4
present experiment, the levels of 10 to 12 % EE in diet were thus compatible with fattening. 5
Fat sources are either useful for poultry feeding under warm climates because they allow 6
compensating the drop in voluntary feed intake observed when temperature is high (Nahashon 7
et al., 2006). 8
The lack of significant gossypol levels in the diets, especially free gossypol, indicates that the 9
CSK used in this experiment was safety for poultry and was a good source of energy, owing 10
to their high levels of fat, at about 37 % of the DM. 11
The final BW of the control groups was weak when considering the standard values reported 12
for Cobb (2004). Aflatoxins incidence could be neglected since their levels were largely lower 13
than the levels of 1 mg/kg causing a 5% reduction in growth rate in poultry, as reported by 14
Dersjant-Li et al. (2003). The low growth of the CG was probably due to the fact that the 15
experiment was carried out at the end of the rainy season under hot and wet climate, i.e., 16
suboptimal conditions for broiler production. Indeed, over 30°C, FI decreases drastically in 17
order to limit endogenous heat production, reducing growth performances and thus final BW 18
(Dale and Fuller, 1979). Cooper and Washburn (1998) yet shown that broilers exposed to 19
32°C expressed almost half the growth performed at 21°C. Considering the iso-nutrient 20
conditions scheduled in this experiment, the effects of CSK substitution on animal growth and 21
on carcass characteristics, with emphasis the higher development of breast, are thus 22
surprising. The higher performances were clearly associated with higher FI, but not with 23
better FCR. This firstly indicates the high palatability of glandless CSK for poultry. The 24
amino acid profile was assumed similar between groundnut and CSK proteins. The most 25
significant difference between diets was the ratio of CSK to both groundnut cake and 1
groundnut oil. Consequently, the effects of the treatments could be ascribed to differences in 2
fatty acid profile. Grains are generally rich in linoleic acid (Watkins, 1991), and poultry are 3
adapted to grain intake. The shift in fatty acid profile from C18:1n-9 to C18:2 n-6 might thus 4
explain the increased diet palatability. 5
Possibly, it also modified fatty acid metabolism. Some fatty acids have specific effect on 6
metabolic pathways. These aspects are poorly known in poultry and are largely based on 7
mammalian models. Brievly, the n-6 family promote the pro-inflammatory arachidonate way 8
while n-3 family promote the pro anti-inflammatory eicosapentanoate one. These ways have 9
specific effects on animal growth (Watkins 1991). 10
Theoretically, in this experiment the C18:1 n-9/C18:2 n-6 shift promoted the arachidonate 11
way and thus the fatty acids from n-6 family. However, excepted for C18:3 n-6 concentration 12
in muscle DM, no detectable effect of the treatment could be observed on fatty acids levels 13
from n-6 family. The differences in animal weight and carcass characteristics could be thus 14
hardly ascribed to differences in n-6 vs n-3 metabolic pathways. 15
According to a feed conversion ratio close to 2, to the approximatively 110g fat /kg diet 16
offered to birds in this experiment, and to a fat digestibility of about 70% (see tables), the 17
animals ate about 154 g digestible fat par kg live weight. Considering 15 g fat/kg muscle (i.e., 18
about 60 g fat/kg muscle DM, table 7), body muscle proportion of about 750 g/kg, and 100 g 19
adipose tissue/kg body, or about 80-120g total fat/kg body weight (Mitchell et al., 1997), 20
animals fixed less fat than amounts digested, in as much as endogenous fat synthesis was not 21
taken into account in this calculation. In these conditions, fatty acid catabolism should have 22
occurred in animals. But also, the C16:0 and C18:0 levels - or proportions - in meat and fat of 23
the animals that received CSK increased sharply, indicating a higher lipogenic activity. It is 24
questionable whether poultry degrades preferentially fatty acids belonging to certain families. 25
It is not excluded that the ability of poultry to metabolise n-6 fatty acids is higher than that to 1
metabolise fatty acids from n-9 serie, with emphasis the oleic acid. The hypothesis for 2
efficient n-6 catabolism in poultry is supported by the fact that there is generally a weak 3
relationship between n-6 diet incorporation and levels of n-6 in animal tissues (Lopez-Ferrer 4
et al. 1991; Bavelaar and Beynen 2003). 5
This experiment suggests thus that poultry used unsaturated fatty acids for their energy 6
metabolism and thus spared others nutrients of the diets, such as starch, for lipid synthesis. In 7
such conditions, the resistance of poultry to warm conditions may have been improved with 8
CSK. If this hypothesis was confirmed, the use of CSK could be promoted in poultry feeding 9
under warm conditions. 10
Concerning the chemical fatty acid profiles of adipose and muscle tissue, MUFA and SFA 11
were the main fractions. These results are in agreement with those of Sheu and Chen (2002), 12
De Marchi et al. (2005) and Jahan and Paterson (2007) that observed that C18: 1 n-9, C18: 0 13
and C18: 2 n-6 were, by decreasing order, the most abundant fatty acids in the abdominal 14
muscles of the chickens. In our experiment, the main fatty acids were respectively C18:1 n-9, 15
C16:0, C18:2 n-6 and C18:0, with more than 90% fatty acids. 16
As previously seen, this profile doesn't match that, more unsaturated, that characterizes the fat 17
of groundnut or cotton, or the fat of the diets formulated in this experiment. However, the 18
experimental changes in fatty acids levels or proportions observed in meat and fat are in 19
agreement with those observed in the diets offered, i.e., a decrease in C18:1 n-9 and an 20
increase in C18:2 n-6 with CSK incorporation. 21
Meat fatty acid profile from birds could be easily modified by nutritional manipulations 22
(Chanmugam et al., 1992; Schiavone et al., 2004). O’Keefe et al. (1995) and Jahan et al. 23
(2004) reported that the n-3 fatty acid levels in the pectoral muscles depended of the feed fatty 24
acid profile. Meta-analysis performed by Bavelaar and Beynen (2003) highlighted the 25
relationships between dietary n-3 and n-6 fatty acids and corresponding levels in meat and fat. 1
Crespo and Esteve-Garcia (2001), as for them, observed that the extents of PUFA changes 2
were more pronounced in meat fat than in abdominal fat. Similar observations were made in 3
this experiment between breast fat and subcutaneous fat, the response of fat tissue in terms of 4
PUFA being not significant. 5
In conclusion, the substitution of groundnut cake by CSK in iso-nutrient broiler diets had a 6
positive linear effect on diet palatability, animal growth and carcass yield. Changes in dietary 7
fatty acid profiles were observed in subcutaneous fat and in meat fat. These changes suggest a 8
preferential catabolism of a certain type of unsaturated fatty acids for energy production. It 9
appears also that fatty acid changes differed according to the type of body fat. Finally, 10
glandless cotton seeds could be probably considered as a high-quality feed in broiler 11
production, especially when temperature and moisture are high. 12
13
AKNOWLEDGEMENTS 14
The authors would like to acknowledge the University Commission for Development (CUD) 15
of Belgium for providing financial support to this study. 16
References 1
2
Alford, B.B., G.U. Liepa and A.D. Vanberber, 1996. Cottonseed protein: What does the 3
future hold? Plant Food Hum. Nutr., 49: 1-11. 4
Altman, D.W., R.D. Stipanovic and Bell, A.A., 1990. Terpenoids in foliar pigment glands of 5
A, D, and AD genome cottons: Introgression potential for pest resistance. J. Hered., 81: 447-6
454. 7
Amipig, 2000. Digestibilité idéales standardisée des acides aminés des matières premières 8
chez le porc. http://www.feedbase.com/downloads/amipfra.pdf (accessed 11th April 2007). 9
AOAC, 1990. Official methods of Analysis, 15th edition, Association of Official Analytical 10
Chemists, Washington DC. 11
Azman, M.A. and M. Yilmaz, 2005. The growth performance of broiler chicks fed with diets 12
containing CSM supplemented with Lysine. Rev. Med. Vet., 156 (Suppl. 2) : 104-106. 13
Bavelaar, F.J. and A.C. Beynen, 2003. Relationships between dietary fatty acid composition 14
and either melting point or fatty acid profile of adipose tissue in broilers. Meat Sci., 64: 133-15
140. 16
Brambila, S. and F.W. Hill, 1966. Comparison of neutral fat and free fatty acids in high lipid-17
low carbohydrate dieats for the growing chicken. J. Nutr., 88: 84-92. 18
Chanmugam, P., M. Boudreau, T. Boutte, R.S. Park, J. Hebert, L. Berrio and D.H. Hwang, 19
1992. Incorporation of different types of n-3 fatty acids into tissue lipids of poultry. Poult. 20
Sci., 71: 516-521. 21
Cobb, 2004. Cobb broiler management guide. http://www.cobb-22
vantress.com/Publications/documents/focus_cobb_1-05.pdf (Accessed 23th february 2007). 23
Cooper, M.A. and K.W. Washburn, 1998. The relationships of body temperature to weight 1
gain, feed consumption and feed utilization in broilers under heat stress. Poult. Sci., 77: 237-2
242 3
Crespo, N. and E. Esteve-Garcia, 2001. Dietary fatty acid profile modifies abdominal 4
deposition in Broiler chickens. Poult. Sci., 80: 71-78. 5
Dale, N.M. and H.L. Fuller, 1979. Effects of diet composition on feed intake and growth of 6
chicks under heat stress. I. Dietary fat levels. Poult. Sci., 58:1529–1534. 7
De Marchi, M., M. Cassandro, E. Lunardi, G. Baldan and P.B. Siegel, 2005. Carcass 8
characteristics and qualitative meat traits of the Padovana breed of chicken. Int. J. Poult. Sci., 9
4: 233-238. 10
Dersjant-Li, Y., M.W. Verstegen and W.J. Gerrits, 2003. The impact of low concentrations of 11
aflatoxin, deoxynivalenol or fumonisin in diets on growing pigs and poultry. Nutr. Res. Rev., 12
16: 223-39. 13
Gamboa, D.A., M.C. Calhoun, S.W. Kuhlmann, A.U. Haq and C.A. Bailey, 2001. Use of 14
expander cottonseed meal in broiler diets formulated on a digestible Amino acid Basis. Poult. 15
Sci., 80: 789-794. 16
Henry, M.H., G.M. Pesti, R. Bakalli, J. Lee, R.T. Toledo, R.R. Eitenmiller and R.D. Phillips, 17
2001. The performance of Broiler chicks fed diets containing extruded cottonseed meal with 18
Lysine. Poult. Sci., 80: 762 – 768. 19
INRA, 1984. L’alimentation des animaux monogastriques : porcs, lapin, volailles. INRA, 20
Paris. 21
Jahan, K. and A. Paterson, 2007. Lipid composition of retailed organic, free-range and 22
conventional chicken breasts. Int. J. Food Sci. Technol., 42: 251-262. 23
Jahan, K, A. Paterson and C. M. Spickett, 2004. Fatty acid composition, antioxidants and lipid 1
oxidation in chicken breasts from different production regimes. Int. J. Food Sci. Technol., 39: 2
443-453. 3
Lopez-Ferrer, S., M.D. Baucells, A.C. Barroeta and M.A. Grashorn, 2001. n-3 enrichment of 4
chicken meat. 1. Use of very long-chain fatty acids in chicken diets and their influence on 5
meat quality: fish oil. Poult. Sci., 80: 741-752. 6
Lordelo, M.M., A.J. Davis, M.C. Calhoun, M.K. Dowd and N.M. Dale, 2005. Relative 7
toxicity of gossypol enantiomers in broilers. Poult. Sci., 84: 1376-1382. 8
Lusas, E.W. and G.M. Jinidin, 1987. Glandless cottonseed: A review of the first 25 years of 9
processing and utilisation research. J. Am. Oil Chem. Soc., 64: 839-854. 10
Mitchell, A.D., R.W. Rosebrough and J.M. Conway, 1997. Body composition analysis of 11
chickens by dual energy x-ray absorptiometry. Poult. Sci., 76: 1746-1752. 12
Morgan, S.E., E.L. Stair, T.M. Martin, W.C. Edwards and L. Morgan, 1988. Clinical, 13
clinicopathologic, pathologic, and alterations associated with gossypol toxicosis in feeder 14
lambs. Am. J. Vet. Res., 49: 493-499. 15
Nagalakshmi, D., V. Savaram and R. Rama., 2007. Cottonseed meal in poultry diets: A 16
review. Poult. Sci., 44: 119-134. 17
Nahashon, S.N., N. Adefope, A. Amenyenu and D. Wright, 2006. Effect of Varying 18
Metabolizable Energy and Crude Protein Concentrations in Diets of Pearl Gray Guinea Fowl 19
Pullets 1. Growth Performance. Poult. Sci., 85: 1847-1854. 20
NRC, 1994. Nutrient Requirements of Poultry, 9th Rev ed.., Washington, DC, National 21
Academy Press. 22
O’Keefe, S.F., F.G. Proudfoot and R.G. Ackman, 1995. Lipid oxidation in meats of omega-3 23
fatty acid enriched broiler chickens. Food Res. Int., 28: 417-424. 24
Ojewola, G.S., S.N. Ukachuckwu and E.I. Okulonye, 2006. Cottonseed meal as substitute for 1
soybean meal in broiler ration. Int. J. Poult. Sci., 5: 360-364. 2
SAS Institute, 1999. Statistics Users Guide, Statistical Analysis System, 5th edition, 8.2 3
version, Carry, NC, SAS Institute Inc. 4
Schiavone, A., I. Romboli, R. Chiarini and M. Marzoni, 2004. Influence of dietary lipid 5
source and strain on fatty acid composition of Muscovy duck meat. J. Anim. Physiol. Anim. 6
Nutr., 88: 88-93. 7
Sheu, K.S. and T.C. Chen, 2002. Yield and quality characteristics of edible broiler skin fat 8
obtained from five rendering methods. J. Food Engin., 55: 263-269. 9
Sukhija, P.S. and D.L. Palmquist, 1988. Rapid method for determination of total fatty acid 10
content and composition of feedstuffs and feces. J. Agric. Food Chem., 36, 1202–1206. 11
Sunilkumar, G., L.M. Campbell, L. Puckhaber, R.D. Stipanovic and K.S. Rathore, 2006. 12
Engineering cottonseed for use in human nutrition by tissue-specific reduction of toxic 13
gossypol. Proc. Nat. Acad. Sci. USA, 103:18054-18059. 14
Vroh-Bi, I., J.P. Baudoin, B. Hau and G. Mergeai, 1999. Development of high-gossypol 15
cotton plants with low-gossypol seeds using tri-species bridge crosses and in vitro culture of 16
seed embryos. Euphytica, 106: 243-251. 17
Watkins, B.A., 1991. Importance of essential fatty acids and their derivatives in poultry. J. 18
Nutr., 121: 1475-1485. 19
Willard, S.T., D.A. Neuendorf, A.W. Lewis and R.D. Randel, 1995. Effect of free gossypol in 20
the diet of pregnant and postpartum brahman cows on calf development and cow 21
performance. J. Anim. Sci., 73: 496 – 507. 22
Yo, T., 1991. Utilisation directe des graines de coton décortiquées de variétés sans gossypol 23
dans l’alimentation des poulets de chair en Côte-d’Ivoire. Rev. Elev. Méd. Vét. Pays Trop., 24
44: 355-360. 25
Table 1. Chemical composition and amino acid profile of the cottonseed kernels used in the experiment 1 Levels (g/kg) Dry matter 944.5 Ash 117.8 Crude protein 358.9 Ether extract 368.2 Crude fiber 84.0 Asp 32.3 Ala 13.2 Arg 39.8 Cys-Cys 5.7 Glu 64.6 Gly 14.5 His 10.9 Ile 11.5 Leu 21.3 Lys 16.8 Met 5.2 Phe 19.2 Pro 12.9 Ser 15.8 Thr 11.0 Tyr 10.2 Val 16.4 2
Table 2. Composition of the diets offered to control groups (CG) and of the experimental diets in which 1
groundnut cake was substituted by cottonseed kernels at levels of 25 (G25), 50 (G50) or 75 (G75)%. 2
3
CG G25 G50 G75 CG G25 G50 G75
Starting period Growing period
Ingredients (g/kg)
Corn 200.0 250.0 230.0 200.0 420.0 420.0 300.0 270.0
Millet 365.0 325.0 350.0 385.0 210.0 215.0 355.0 390.0
Groundnut cake 250.0 187.5 125.0 62.5 250.0 187.5 125.0 62.5
Cottonseed kernel 0.0 62.5 125.0 187.5 0.0 62.5 125.0 187.5
Fish by-product meal 90.0 100.0 105.0 110.0 27.5 32.5 32.5 37.5
Tricalcium phosphate 12.4 3.0 0.0 0.0 15.0 15.0 5.0 0.0 Groundnut oil 50.0 40.0 30.0 20.0 50.0 40.0 30.0 20.0 L-Lysine HCl 1.6 1.5 2.0 2.0 1.5 1.5 1.5 1.5 DL-Methionine 1.0 0.5 1.0 1.0 1.0 1.0 1.0 1.0 Vitamin-mineral premix1 30.0 30.0 32.0 32.0 25.0 25.0 25.0 30.0 Chemical composition (g/kg) Dry matter 933.0 934.0 938.0 938.0 937.0 929.0 933.0 932.0 Crude protein 205.0 216.0 222.0 210.0 195.0 197.0 184.0 182.0 Ether extract 121.7 113.9 118.3 123.7 99.8 100.0 112.7 113.9 Crude fiber 25.0 22.0 27.0 28.0 27.0 30.0 31.0 27.0 Ash 63.0 84.0 81.0 81.0 76.0 66.0 67.0 68.0 Ca 11.0 13.0 12.0 12.0 10.0 8.0 9.0 12.0 Total P 9.0 9.0 9.0 10.0 8.0 7.0 8.0 8.0 K 6.0 6.0 6.0 5.0 6.0 6.0 6.0 6.0 Na 1.0 2.0 2.0 1.0 1.0 1.0 1.0 1.0 Mg 2.0 2.0 2.0 2.0 2.0 2.0 2.0 2.0 Others ME, Kcal/kg 3598 3518 3540 3559 3463 3418 3496 3521 Total gossypol, mg/kg 0.0 29.1 49.5 85.4 0.0 23.4 46.4 67.1 Free gossypol, mg/kg 0.0 0.0 0.0 0.0 0.0 0.0 0.0 0.0
1Macro-vetamix 5% (Vetagropharma technology) which provided (per kg of premix): Ca, 280 g; P, 37g; NaCl, 33g; Mn, 1.4 mg; Zn, 1.2 4
mg; Fe, 1.4 mg; Cu 0.2 mg; I, 8 mg; Co, 2 mg; Se, 2.8 mg; vitamin A, 250,000 IU; vitamin D3, 50,000 IU; vitamin E, 290 mg; vitamin B1, 5
55 mg; vitamin B2, 100 mg; vitamin B3, 480 mg; vitamin B5, 195 mg; vitamin B6, 55 mg; vitamin B12, 600 µg; vitamin K3, 50 mg; folic 6
acid vitamin, 27 mg; vitamin C, 175 mg; H biotin vitamin, 600 µg; Lysine HCl, 5%; Methionine, 3% 7
Table 3. Fatty acid profile of feeds offered to broilers that received either a control diet (CG) or diets in which 1
groundnut cake was substituted by cottonseed kernels at levels of 25 (G25), 50 (G50) or 75 (G75)% 2
Starting diet Growing diet
CG G25 G50 G75 CG G25 G50 G75
Fatty acids (g/kg fat)
C14 :0 7 8 9 10 5 6 5 6 C16 :0 132 136 140 152 124 132 124 131 C18 :0 43 39 36 34 34 30 33 31 C20 :0 10 8 6 5 9 6 8 6 C16:1n7 8 10 11 12 6 7 5 7 C18:1n9/7 490 460 397 337 470 346 375 319 C20:1n9 9 7 5 4 7 4 5 4 C18:2n6 282 318 382 434 329 457 433 485 C20:4n6 5 4 3 3 5 3 3 2 C18:3n3 11 8 8 7 8 7 9 8 C20:5n3 3 3 3 3 3 1 0 1 SFA 191 191 191 201 172 175 169 174 MUFA 507 476 412 352 483 356 386 329 W6 287 321 385 437 334 461 435 487 W3 14 11 11 10 11 8 10 9 PUFA 301 333 396 446 345 469 445 496 3
Table 4. Animal performance of Cobb 500 broilers that received either a control diet (CG) or diets in which 1
groundnut cake was substituted by cottonseed kernels at levels of 25 (G25), 50 (G50) or 75 (G75)% 2
CG G25 G50 G75 SEM P>F
Initial weight, g 43 43 41 42 0.43 0.426
Weight at d22, g 353a 415b 550c 593d 10.4 0.001
Final weight, g 1063a 1262b 1635c 1847d 42.3 0.001
ADG starting period, g/d 14.8 17.7 24.2 26.2 - -
ADG growing period, g/d 33.8 40.3 51.7 59.7 - -
Feed intake starting period, g 24.9 28.9 41.1 42.4 - -
Feed intake growing period, g 88.7 95.9 125.0 129.8 - -
Feed conversion ratio starting period 1.54 1.39 1.64 1.53 - -
Feed conversion ratio growing period 2.72 2.60 2.67 2.39 - -
Values on the same line with no common letter are significantly different at P < 0.05. 3
Table 5. Nutrients digestibility (%) of Cobb 500 broilers that received either a control diet (CG) or diets in 1
which groundnut cake was substituted by cottonseed kernels at levels of 25 (G25), 50 (G50) or 75 (G75)% 2 Items CG G25 G50 G75 SEM P>F Starting diets Dry matter 65.14 64.27 65.45 65.59 1.9 0.96 Organic matter 72.47 71.54 73.03 73.48 1.6 0.84 Fat matter 67.37 66.98 68.80 69.43 1.7 0.73 Growing diets Dry matter 66.12 66.33 67.75 68.80 2.0 0.78 Organic matter 72.58 72.74 74.04 74.21 1.8 0.88 Fat matter 70.68 70.51 69.07 71.40 1.8 0.82
The values on the same line with no common letter are significantly different at P < 0.05 3
Table 6. Animal performance and carcass characteristics of broilers that received either a control diet (CG) or 1
diets in which groundnut cake was substituted by cottonseed kernels at levels of 25 (G25), 50 (G50) or 75 2
(G75)% 3
CG G25 G50 G75 SEM P>F
Weights, g
Live weight 1040a 1435b 1672c 1930d 139.4 0.062
Carcass weight 717a 1006b 1229c 1379d 113.4 0.041
Breast 245a 363b 450c 560d 28.8 0.001 Thigh 337a 435b 495b 573c 42.0 0.424 Wing 113a 157bc 172c 208d 11.6 0.059 Liver 53 52 54 52 4.6 0.988 Heart 12 12 12 13 1.7 0.948 Gizzard 41 49 41 47 5.8 0.690 Proportions (%) Dressing 68.90a 70.10bc 73.50c 71.45b 0.9 0.012
Breast/carcass 34.17a 36.08a 36.61ab 40.61b 1.1 0.016
Thigh/carcass 47.00 43.24 40.28 41.55 1.6 0.560
Wing/carcass 15.76 15.61 13.99 15.08 0.5 0.762
On a line, means with no common letter are significantly different at P > 0.05 4
Table 7. Ether extract and fatty acids levels (mg/kg DM) in muscle of broilers that received either a 1
control diet (CG) or diets in which groundnut cake was substituted by cottonseed kernels at levels of 25 2 (G25), 50 (G50) or 75 (G75)% 3 CG G25 G50 G75 P>F SEM Ether extract (g/kg DM) 62.7 72.4 66.9 77.2 0.963 21.0 Fatty acids (mg/100g DM) C14 :0 29.7a 26.3a 47.7b 49.0b 0.005 4.5 C16 :0 1234.6a 1190.1a 1715.0b 1827.6b 0.001 105.7 C18 :0 626.0a 652.5a 911.0b 963.9b 0.007 69.3 C16:1 n-9 136.8 87.8 88.4 81.1 0.499 27.9 C18:1 n-9 3223.3a 3251.1a 2065.3b 1847.8b 0.002 247.8 C18:2 n-6 1043.2a 1083.7a 1452.0b 1524.3b 0.015 108.4
C18:3 n-6 5.3a 5.1a 7.0ab 7.9a 0.048 0.7
C20:3 n-6 27.1 28.0 29.6 26.1 0.624 1.8 C20:4 n-6 151.0 149.8 135.3 141.7 0.726 10.5 C22:4 n-6 32.6 31.3 31.9 28.4 0.661 2.5 C18:3 n-3 18.7a 19.3a 24.2b 23.4b 0.004 1.0 C20:5 n-3 7.2 5.4 7.0 5.8 0.469 0.9 C22:5 n-3 31.7 31.2 34.3 28.2 0.510 2.6 C22:6 n-3 27.7 31.2 28.1 30.1 0.892 3.6
Other SFA 8.8a 10.3a 11.9ab 14.3b 0.079 1.4
Other MUFA 25.7a 24.6a 28.7b 25.1a 0.019 0.8
Other PUFA 26.1 27.4 33.9 27.5 0.193 2.4
SFA 1910.5a 1890.9a 2701.2b 2869.5b 0.002 177.8
MUFA 3385.8a 3363.5a 2182.5b 1954.0b 0.003 267.6
Total n-6 1278.0a 1319.1a 1683.5b 1751.8b 0.016 108.1
Total n-3 92.5 93.3 99.6 91.5 0.875 7.0
PUFA 1370.6a 1412.4a 1783.1b 1843.3b 0.015 107.7
MUFA/SFA 1.8a 1.6a 0.8b 0.7b <.0001 0.10
PUFA/SFA 0.8 0.8 0.7 0.7 0.360 0.04
PUFA/MUFA 0.4a 0.5a 0.9b 1.0b <.0001 0.05
UFA/SFA 2.6a 2.4a 1.5b 1.3b <.0001 0.11
n-6/n-3 13.3a 14.2a 16.1a 17.6b 0.119 1.2
On a line, means with no common letter are significantly different at P > 0.05 4
Table 8 Fatty acids proportions in the subcutaneous fat and muscles fat of broilers that received either a control diet (CG) or diets in which groundnut cake was substituted
1
by cottonseed kernels at levels of 25 (G25), 50 (G50) or 75 (G75)% 2
Sub-cutaneous fat Meat fat P>F
Fatty acid (% fat)
CG G25 G50 G75 CG G25 G50 G75 Loc. Group Inter. SEM
C14:0 0.65ao 0.66ab 0.77bo 0.8bo 0.39ao 0.40ao 0.66bo 0.67bo 0.001 0.001 0.164 0.041
C16:0 22.91ao 23.94ao 26.73bo 27.32bo 17.65ao 18.34ao 25.30bo 26.86bo 0.001 0.001 0.002 0.721
C18:0 8.85ao 10.47ao 12.5bo 13.43bo 9.79ao 10.45ao 14.07bo 14.49bo 0.057 0.001 0.643 0.624
C16:1 n-9 2.94oo 2.01oo 1.67oo 1.42oo 1.54oo 1.12oo 1.13oo 1.15oo 0.017 0.143 0.600 0.426
C18:1 n-9 40.89ao 37.57ab 33.06ab 30.66bo 47.94ao 46.47ao 29.06bo 28.1bo 0.070 0.001 0.001 1.740
C18:2 n-6 21.7oo 23.26oo 23.39oo 24.49oo 15.98ao 16.85ao 22.43bo 22.08bo <0.001 0.002 0.073 1.148
C18:3 n-6 0.13oo 0.13oo 0.13oo 0.14oo 0.07ao 0.08ab 0.11bo 0.10ab <0.001 0.150 0.546 0.011
C20:3 n-6 0.07oo 0.08oo 0.07oo 0.08oo 0.50oo 0.47oo 0.60oo 0.50oo <0.001 0.861 0.820 0.076
C20:4 n-6 0.08oo 0.09oo 0.07oo 0.09oo 2.83oo 2.69oo 2.81oo 2.70oo <0.001 0.997 0.996 0.399
C22 :4 n-6 0.02oo 0.03oo 0.02oo 0.02oo 0.61oo 0.56oo 0.63oo 0.55oo <0.001 0.951 0.925 0.080
C18:3 n-3 0.56ao 0.53ao 0.51ab 0.47bo 0.26ao 0.27ao 0.35bo 0.32ab <0.001 0.379 0.002 0.021
C20:5 n-3 0.02oo 0.02oo 0.02oo 0.01oo 0.13oo 0.09oo 0.15oo 0.12oo <0.001 0.524 0.646 0.024
C22:5 n-3 0.02oo 0.02oo 0.02oo 0.02oo 0.60oo 0.54oo 0.69oo 0.53oo <0.001 0.804 0.809 0.091
C22:6 n-3 0.01oo 0.01oo 0.02oo 0.01oo 0.54oo 0.52oo 0.6oo 0.57oo <0.001 0.967 0.971 0.085
Other SFA 0.43oo 0.49oo 0.41oo 0.47oo 0.32ao 0.33ab 0.41bo 0.42bo <0.001 0.148 0.065 0.030
Other mufa 0.59ao 0.55ao 0.46bo 0.42bo 0.37oo 0.36oo 0.40oo 0.36oo <0.001 0.015 0.003 0.024
Other pufa 0.12oo 0.14oo 0.15oo 0.16oo 0.48oo 0.47oo 0.60oo 0.50oo <0.001 0.640 0.730 0.059
SFA 32.84ao 35.56ao 40.41bo 42.02bo 28.14ao 29.52ao 40.43bo 42.44bo <0.001 0.005 0.021 1.179
MUFA 44.41ao 40.13ab 35.2bo 32.5bo 49.85ao 47.95ao 30.59bo 29.62bo 0.338 <0.001 0.012 2.064
Total n-6 22.12oo 23.73oo 23.82oo 24.97oo 20.37ao 21.01ao 27.08bo 26.35bo 0.971 <0.007 0.146 1.404
Total n-3 0.62oo 0.58oo 0.57oo 0.51oo 1.65oo 1.53oo 1.89oo 1.6oo <0.001 0.782 0.785 0.194
PUFA 22.75oo 24.31oo 24.39oo 25.48oo 22.01ao 22.54ao 28.97bo 27.95bo 0.306 0.013 0.161 1.520
MUFA/SFA 1.37ao 1.15ao 0.89bo 0.78bo 1.79ao 1.65ao 0.76bo 0.72bo <0.023 <0.001 0.008 0.025
PUFA/SFA 0.69oo 0.69oo 0.61oo 0.61oo 0.78oo 0.76oo 0.72oo 0.66oo 0.016 0.102 0.936 0.045
PUFA/MUFA 0.53ao 0.62ab 0.70ab 0.79bo 0.45ao 0.48ao 0.96bo 0.96bo 0.289 <0.001 0.017 0.011
UFA/SFA 2.06ao 1.83ao 1.49bo 1.38bo 2.57ao 2.42ao 1.48bo 1.36bo 0.002 <0.001 <0.001 0.025
n-6/n-3 35.46ao 40.52ab 41.82ab 49.01bo 12.68oo 14.44oo 15.95oo 18.72oo <0.001 <0.001 0.347 1.975
On a line and in a location, means with no common letter are significantly different at P > 0.05