THE DISSOCIATIVE IONIZATION OF NITROUS OXIDE. AN
ELECTROIONIZATION STUDY
1J.L. OLIVIER, R. LOCHT and J. MOMIGNY
Département de Chimie Générale et de Chimie - Physique, Université de Liège, Institut de Chimie, Sart-Tilman par B-4000 Liège 1 (Belgium)
ABSTRACT
The dissociative electroionization of nitrous oxide into its four dissociation channels has been studied by a method using ion kinetic energy and mass analysis. The formation of N2
+
, NO+, O+ and N+ are discussed essentially in terms of predissociation of the ground and excited N2O+ states between 15 and 40 eV. In most
cases the predissociating states are also identified. The present results are compared with those in the literature.
INTRODUCTION
From the beginning, the development of the mass spectrometric technique has involved a lot of effort in the search to understand the decomposition mechanisms of molecular cations. Many technical refinements have increased the energy resolving power of the instruments, such as the use of monochromatized electrons or photons as projectiles and the cooling of the target molecules to a few degrees Kelvin in supersonic molecular beams.
In an early stage of the molecular dissociative ionization studies, a few research groups were concerned with the translational energy analysis of the fragment ions. Various techniques have been developed for ion kinetic energy analysis such as the use of electric and/or magnetic field and ion time-of-flight measurements. The most successful application of these techniques is the metastable ion decomposition study which gave rise to a broad array of instruments characterized by high ion energy resolution.
Later, a few groups performed angular dependent ion energy analysis, the anisotropy (or isotropy) of the distributions being related to the symmetry of the decomposing ionic states.
Apart from the metastable decomposition studies, which became a powerful analysing technique, dissociative ionization studies with ion kinetic energy analysis remain scarce. Furthermore, a disadvantage of the former method is the uncertainty in the nature of the final ionic states which decompose.
A means of overcoming this difficulty is the photoion/photoelectron coincidence technique which has been developed by several groups during the last decade.
However, this method is restricted to direct ionization phenomena which generally represent only a small part of the total ionization cross-section. Autoionization and dissociative autoionization are virtually excluded. The threshold photoelectron/photoion coincidence technique fills this gap.
When using electroionization, the only way to study dissociative ionization phenomena is by the kinetic energy distribution analysis of the mass analysed fragment ions.
This method has been applied in our laboratory during the last decade to diatomic and polyatomic molecular cations. To illustrate the kind of information gained by this technique we will discuss the four dissociation channels of nitrous oxide under the impact of 12-40 eV electrons.
1
EXPERIMENTAL
The experimental set-up used in this experiment is shown in Fig. 1. The ions generated in a Nier-type ion source by the impact of energy-controlled electrons, are focussed on the exit hole Al, energy-analysed by a
retarding lens R, and mass-selected in a quadrupole mass filter Q. The ion current, collected on a Cu-Be electron multiplier, is continuously measured as a function of either the electron energy at fixed retarding potential or the retarding potential at fixed electron energy. Both signals are electronically differentiated, averaged in a multichannel analyser which is interfaced with a mini-computer. The data are stored on floppy disk for further handling and recording.
The recording of the electroionization efficiency curves of a fragment ion as a function of the retarding potential settings allows one to build up a "kinetic energy vs. appearance energy" plot corresponding to the considered fragment ion. From this diagram information can be inferred concerning the dissociation mechanism and its energetics.
Considering the dissociation of a molecular cation AB+, the translational energy, t(A+), carried by the ionized fragment is related to the total kinetic energy, T, involved in the dissociation process by
(1)
and to the appearance energy AP(A+) of the fragment ion through
(2)
where D(A-B) and I(A) have the usual meaning and Eint is the internal energy of the ionized and neutral
fragments. AP0 is defined by
(3)
One obtains
(4)
i.e. a linear relationship between the translational energy and the excess energy of the molecular ion.
A first information gained in the t(A+) vs. AP(A+) plot is the extrapolated energy to t(A+) = 0 eV, i.e. AP0(A+) corresponding to the energy level of the dissociation limit of the considered process.
Secondly, in the case of a polyatomic system, the fragments A+ and/or B could be diatomic or polyatomic species. The excess energy [AP(A+)-AP0(A
+
)] can partially or completely be converted into internal energy of the fragments. When the energy partitioning into translational and internal energy is constant, it can be shown that Eq. (4) becomes
(4’)
when k < 1 the excess energy is converted into internal energy. From the slope of a straight line, the amount of the internal energy and consequently the vibronic state of the fragments can be inferred.
Fig. 1. Experimental set-up. C, Ion source region cathode; G, gas inlet; T, electron trap; E, extraction lens; L, focussing lens; R, retarding lens; A1, A2, ion accelerating lens; Q, mass filter. The lower diagram gives the
potential distribution along the ion beam path.
DISCUSSION
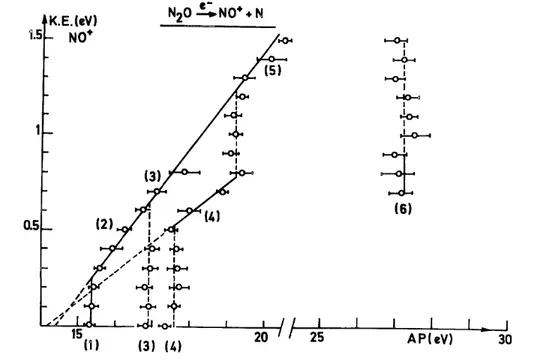
The aim of the experiment is to establish the kinetic energy vs. appearance energy plot of the considered fragment ion. Figures 2-5 show the diagram obtained for the four fragment ions obtained by dissociative electroioniza-tion of nitrous oxide, i.e. NO+, N2
+
, O+ and N+, respectively. The diagrams pertaining to the formation of NO+ and N2+ ions have been discussed in detail in an earlier paper [1]. The plots corresponding to
O+ and N+ are discussed in a paper submitted for publication. The aim of this paper is to analyse the most salient features of these diagrams to gain a synoptical view of the N2O
+
dissociation. For that purpose we will examine the decomposition pathways of the N2O
+
states.
Fig. 3. Kinetic energy vs. appearance energy plot for N2+/N2O
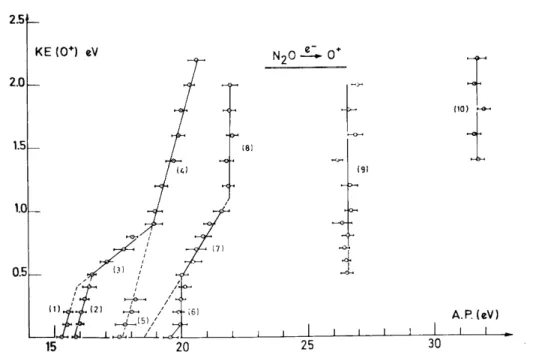
Fig. 4. Kinetic energy vs. appearance energy plot for O+/N2O
The N2O +
( X~2Π) state
The first adiabatic ionisation energy of the N2O (X ~l
Σ+) molecule is 12.886 eV [2] and the N2O +
(X~2Π) state is correlated to two dissociation limits [3], i.e. NO+ (X~lΣ+) + N(2D) and N2 +
(X~2Σg +
) + O (3P), at 16.58 and 17.24 eV, respectively [3].
By photoelectron spectroscopy, the N2O +
(X~2Π) state is known to be populated only in its first vibrational levels [4] by direct Franck-Condon transitions. Photoelectron/photoion coincidence studies [5] do not
reveal fragment ions in the energy range of the N2O +
(X~2Π) state, whereas by threshold photoelectron/photoion coincidence experiments [6], dissociation is shown to occur through autoionization, which is abundantly present in the photoionization efficiency curves of N2O+ and the fragment ions [2]. Autoionization phenomena have been
shown to be able to populate the upper vibrational levels of the N2O+ (X~2Π) state [6].
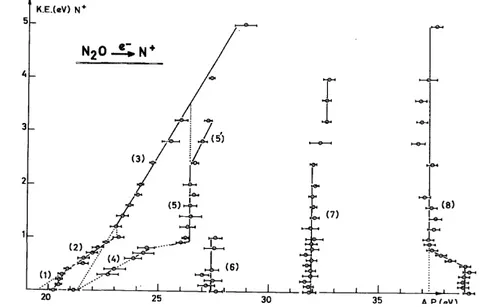
Fig. 5. Kinetic energy vs. appearance energy plot for N+/N2O.
By electroionization, two fragment ions appear in the energy range of the N2O+ (X~2Π) state, i.e. NO+
and O+. The NO+ ion has its first onset at 15.29 eV, and for the O+ ions two appearance energies are observed below 16 eV, i.e. 15.27 and 15.83 eV, respectively. These values are compared with the photoionization thresholds of 14.97 and 15.25 eV, respectively, for NO+ and O+ [2]. Both ions are clearly produced by the decomposition of the ground N2O
+
(X~2Π) state. Furthermore, both ions have to be formed by predissociation of the upper vibrational levels of this state through the mechanisms
Figures 2 and 4 allow one to identify the dissociation limits and the products. In both channels, 1Σ+ and
4
S species are produced and these terms are correlated with only one molecular N2O+ (4Σ-) state. This state has
been shown to be repulsive [3] and predissociating the N2O+ (X
~2Π) state. These figures also allow one to infer
the vibrational energy content of the diatomic species NO+ and N2 by the energy balance with the kinetic energy
carried away by the fragments and their appearance energy. Both quantities are measured.
One should note that the predissociation of the X~2Π state predominantly causes the excess energy to be totally converted into translational energy, the diatomic fragments remaining in the same vibronic state. Only the NO+ (X1Σ+) ions are formed at the onset in vibrationally excited υ = 1, 2 and 3 levels.
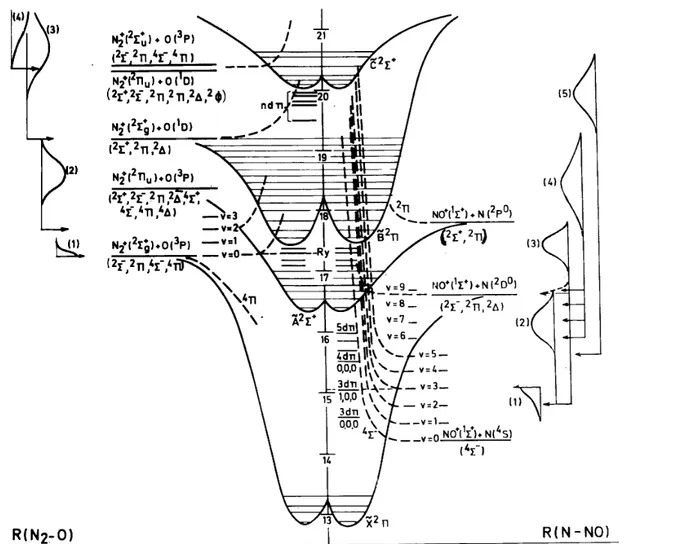
The processes described above are shown in terms of two-dimensional potential energy diagrams in Figs. 6 and 7. The numbers labelling the ion energy distributions inserted in these diagrams refer to the corresponding portions in the kinetic energy vs. appearance energy plots.
The photoelectron spectrum of the N2O +
(Ã2Σ+) state shows this state to be populated between 16.39 eV [4], i.e. the adiabatic ionization energy, and ~ 17 eV. The N2O
+
(B~2Π) state has its adiabatic ionization energy at 17.45 eV [4] and a vibrational progression extends up to 19.2 eV. The maximum of this band (or vertical ionization energy) lies at 18.2 eV. Recent theoretical calculations showed this band to be manifold [7].
At infinite internuclear distances, the N2O+ (Ã2Σ+) state is correlated with NO+ (X1Σ+) + N(2P) and with
N2 +
(A2Πu) + O ( 3
P) dissociation limits lying respectively at 17.77 and 18.35 eV [3]. On the other hand, the N2O +
(B~2Π) state converges to the limits NO (X2Π) + N+ (1D) and N2 +
(X2Σg +
) + O(lD) at 21.37 and 19.20 eV [3] (see Figs. 6 and 8).
For both ionic states, the photoelectron/photoion coincidence studies [5] as well as the threshold photoelectron/photoion coincidence experiments [6] evidenced molecular ion fragmentation in three dissociation channels leading to NO+, N2
+
and O+ ions. The former experiments together with fluorescence measurements [8] showed the N2O
+
(Ã2Σ+, υ = 0, 0, 0) state not to be predissociated in any of the three channels mentioned above. The photoionization efficiency curves of N2O+ and NO+, N2+ and O+ display a very similar and extended
autoionization structure [2]. The photoionization threshold for N2+ is measured at 17.34 eV [2].
Fig. 6. Potential energy diagram of N2O along the two coordinates N2–O and N–NO. Kinetic energy
distributions and dissociation limits observed below 21.21 eV for NO+ and N2 +
are inserted.
The N2O +
(Ã2Σ+) and (B~2Π) states
In agreement with the results mentioned above, the present electroioniza-tion experiment shows three fragment ions to be produced in the energy range of the N2O
+
(Ã2Σ+–B~2Π) states, i.e. NO+, N2 +
and O+. In the kinetic energy vs. appearance energy plots (see Figs. 2-4) critical energies are observed at 16.9-17.8 and 17.6-19.2 eV for NO+, at 17.32 and 17.7-20.3 eV for N2+, and, finally, 16.48-19.2 and 17.6-18.2 eV for 0+. The first
electroionization onset of N2 +
Fig. 7. Potential energy diagram of N2O along the N2–O coordinate. Kinetic energy distributions and
dissociation limits observed below 21.21 eV for O+ are inserted.
It should be pointed out that these energies cover the limits of the Â2∑ + (16.54-17.0 eV) and the B~2Π (17.45-19.2 eV) states. In agreement with photoionization, the electroionization efficiency curves exhibit autoionization structure. Both N2O
+
(Ã2Σ+–B~2Π) states decompose by the mechanism
where the 4Σ- state is the predissociating state in the NO+ and O+ producing channels. For N
2+ production, the
predissociating state could be 2Σ- or 4Σ-. None of these states has been calculated [3]. Besides direct ionization and predissociation, autoionizing predissociation has to play a role, e.g.
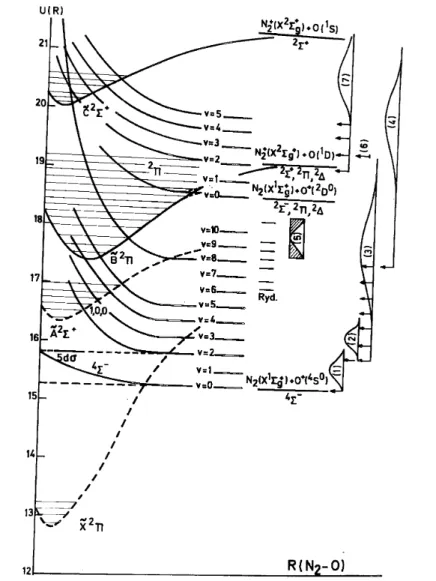
Fig. 8. Potential energy diagram of N2O along the two coordinates N–NO and N2–O from 17 to 28 eV. Besides
the kinetic energy distributions and dissociation limits for N +, decomposition processes producing N2 +
, NO+ and O+ are inserted. The dipole (e, 2e) spectrum (MET) between 17 and 28 eV is inserted [11].
for segment (5) in Fig. 4.
From Figs. 2-4, not only are the dissociation limits unambiguously identified, but also the energy content of the diatomic products NO+ and N2. In contrast with the decomposition of the N2O
+
(X~2Π) state, most of the dissociations involving the N2O
+
(Ã2Σ+ and B~2Π) states lead in all three channels to an important conversion of the excess energy into vibrational energy of the diatomic fragments.
These decomposition mechanisms have been inserted in the potential energy diagrams shown in Figs. 6 and 7.
The N2O +
( C~2Σ+) state
From the convergence limit of the Rydberg states, the adiabatic ionization energy of the N2O +
( C~2Σ+) state is found to be 20.105 eV [2]. In the photoelectron spectrum of N2O, the C
~2
Σ+ state is populated from 20.105-20.30 eV by direct Franck-Condon transitions [4], Correlation diagrams show this state to converge to the limits N+ (1D) + NO (X2Π) at 21.37 eV and N2+ (X2Σg+) + O(lS) at 21.43 eV [3].
Between the B~2Π– C~2Σ + states, autoionization occurs [2] and the He(II) photoelectron spectrum of N2O indicated the existence of a "multiple electron transitions" state at 19.5 eV [9].
N2 +
, O+ and N+ are formed by predissociation of the N2O +
( C~2Σ+) state. Furthermore, the present electroionization study leads to the conclusion that the four N2O
+
dissociation channels are open in the energy range of the N2O+ ( C
~2
Σ+) state. In Figs. 2-5, critical energies are found at 19.25-20.5 eV for NO+, 20.3-25.5 and 20.25-23 eV for N2
+
, 19.0-20.6 and 19.5-21.9 eV for O+, and, finally, 20.1-20.8 eV for N+. The detailed discussion of these experimental results leads to the following decomposition mechanisms of the C~2Σ+ state
which have been inserted in the potential energy diagrams of Figs. 6-8.
Besides the 4Σ- predissociating state which is responsible for the formation of NO+ and O+, 2Π states, shown to be repulsive by quantum mechanical calculations [3], are the predissociating states which produce O+ and N+. As has been pointed out for the dissociation of the N20
+
(X~2Π) state, the decomposition of the C~2Σ+ state essentially produces fragments with total conversion of the excess energy into kinetic energy.
The "multiple electron transition" states (MET)
Above the He continuum and the He(I) resonance line, data on the N2O+ molecular ion states are scarce.
Only one He(II) photoelectron spectrum has been published [9]. The ESCA spectrum [10] and the dipole (e, 2e) spectrum [11] are known. Part of this last spectrum is reproduced in Fig. 8. The maxima of the bands have been measured at 23.5, 24.5, 28.5, 33.0 and 38.0 eV [11].
No information on the decomposition of these states is available.
The present work has been extended up to 40 eV, the energy range of the multiple electron transition states (or doubly excited or doubly orthogonal states). All the dissociation channels of N2O
+
are open, as shown in Figs. 2-5. The kinetic energy vs. appearance energy diagrams display the same features in the energy range of the MET states, i.e. vertical lines implying a predissociation, mostly without an inclined tail, which are probably indicative of a large amount of kinetic energy. This is observed for NO+, O+ and N+. However, for N2+ and N+, an
inclined tail is observed and the dissociation limit and products could be identified. All these dissociation phenomena are inserted in Fig. 8 for energies up to 28 eV. Most of the MET states have more than one decomposition pathway.
CONCLUSIONS
The electroionization study of N2O +
into its four dissociation channels described in this work, i.e. the production of NO+, N2
+
, O+ and N+, gives one a deeper understanding of the dissociation mechanisms. The precursor molecular ion states as well as the dissociation products are unambiguously identified. The kinetic energy and appearance energy measurements allowed a detailed energy balance to be made and determination of the energy content of the polyatomic fragments.
Specific behaviour with respect to dissociation has been evidenced for several ionic states. This study has also been extended to the dissociation of the multiple electron transition states.
ACKNOWLEDGEMENTS
This work has been performed under the auspices of the ARC (Action de Recherche Concertée) contract and one of us (J.L.O.) is indebted to the ARC for a research grant.
REFERENCES
1 J.L. Olivier, R. Locht and J. Momigny, Chem. Phys., 68 (1982) 201.
2 J. Berkowitz and J.H.D. Eland, J. Chem. Phys., 67 (1977) 2740.
3 J.C. Lorquet and C. Cadet, Int. J. Mass Spectrom. Ion Phys., 7 (1971) 245.
4 P.M. Dehmer, J.L. Dehmer and W.A. Chupka, J. Chem. Phys., 73 (1980) 126.
5 J.H.D. Eland, Int. J. Mass Spectrom. Ion Phys., 12 (1973) 389. B. Brehm, R. Frey. A. Kustler and J.H.D. Eland, Int. J. Mass Spectrom. Ion Phys., 13 (1974) 257.
6 T. Baer, P.M. Guyon, I. Nenner, A. Tabche-Fouaille, R. Botter, L.F.A. Ferreira and T.R. Govers, J. Chem. Phys., 70 (1979) 1585. I. Nenner, P.M. Guyon, T. Baer and T.R. Govers, J. Chem. Phys., 72 (1980) 6587.
7 H. Köppel, L.S. Cederbaum and W. Domcke, Chem. Phys., 69 (1982) 175.
8 R. Frey, B. Gotchev, W.B. Peatman, H. Pollak and E.W. Schlag, Chem. Phys. Lett., 54 (1978) 411.
9 A.W. Potts and T.A. Williams, J. Electron Spectrosc. Relat. Phenom., 3 (1979) 3.
10 U. Gelius, J. Electron Spectrosc. Relat. Phenom., 5 (1974) 985.