HAL Id: tel-01388427
https://hal.archives-ouvertes.fr/tel-01388427v2
Submitted on 24 Mar 2017
HAL is a multi-disciplinary open access archive for the deposit and dissemination of sci-entific research documents, whether they are pub-lished or not. The documents may come from teaching and research institutions in France or abroad, or from public or private research centers.
L’archive ouverte pluridisciplinaire HAL, est destinée au dépôt et à la diffusion de documents scientifiques de niveau recherche, publiés ou non, émanant des établissements d’enseignement et de recherche français ou étrangers, des laboratoires publics ou privés.
Marie-Cecilia Duvernoy
To cite this version:
Marie-Cecilia Duvernoy. Growth mechanics of a bacterial microcolony. Bacteriology. Université Grenoble Alpes, 2015. English. �NNT : 2015GREAY074�. �tel-01388427v2�
THÈSE
Pour obtenir le grade de
DOCTEUR DE L’UNIVERSITÉ DE GRENOBLE
Spécialité :Physique pour les sciences du vivant
Arrêté ministériel : 7 Août 2006
Présentée par
Marie-Cécilia Duvernoy
Thèse dirigée parCatherine Quilliet
et codirigée parNicolas Desprat et Sigolène Lecuyer
préparée au sein du Laboratoire Interdisciplinaire de Physique (UJF), du Laboratoire de Physique Statistique (ENS)
et deEcole Doctorale de Physique
Mécanique de croissance d’une
micro-colonnie bactérienne
Growth mechanics of a bacterial microcolony
Thèse soutenue publiquement le4 Novembre 2015,devant le jury composé de : Hans Geiselmann
Professeur, Université Joseph Fourier, Président
Nelly Henry
Directrice de recherche, CNRS, Rapporteur
Axel Buguin
Professeur, Université Pierre et Marie Curie, Examinateur
Zemer Gitai
Professor, Princeton University, Examinateur
Jean-Paul Rieu
Professeur, Université Claude Bernard, Examinateur
Nicolas Desprat
Maître de conférence, Université Paris Diderot, Co-Directeur de thèse
Sigolène Lecuyer
Chargée de recherche, CNRS, Co-Directeur de thèse
Catherine Quilliet
Maître de conférence, Université Joseph Fourier, Directeur de thèse
Gurol Suel (Rapporteur extérieur au jury)
À mon grand-père, Jean Duvernoy, docteur de l’Université de Grenoble,
Acknowledgements
Tout d’abord, je souhaite remercier mes encadrants pour leur confiance, leur considération, leur soutien et leur temps qu’ils n’ont pas compté pendant ces 3 années. Ces remerciements sur papier feront immanquablement pâle fi-gure face à la reconnaissance qui m’anime réellement. Devant un énième problème technique, je choisis cette fois-ci de me limiter en longueur, mais sachez que j’aurais pu m’épancher sur plusieurs paragraphes. Merci Nico-las pour ton engagement (du sens sportif au sens presque militant), pour ta franchise et pour ta passion contagieuse de l’exploration expérimentale et du "geste de l’artisan". Merci Sigolène pour ta bonne humeur, ta sagesse et ton bon sens aussi bien scientifique qu’humain. Merci Catherine pour ton regard critique de physicienne et pour l’ambiance joyeuse que tu sais instaurer dans un univers de travail. Vous m’avez permis de trouver un équilibre pour mener ce projet et j’ai bien conscience que je vous dois énormément. Je pense même que vous allez me manquer par la suite ! Merci à Martial de m’avoir épaulé pour les mesures de force avec optimisme et exigence. Dans cette tache, merci aussi à Irène et Richard pour leur disponibilité et leur aide. Merci à Delphine de m’avoir permis de faire des expériences de RICM. Et merci à Thierry Mora de nous avoir construit des simulations dernièrement. Merci enfin à nos col-laborateurs biologistes de l’Institut Pasteur, Christophe Beloin et Jean-Marc Ghigo ; les discussions entre nos communautés ne sont pas toujours simples, merci d’avoir pris le temps nécessaire à ce que nos interactions soient béné-fiques. Enfin, merci aux membres du jury et aux rapporteurs pour le temps que vous avez consacré à évaluer mon travail.
Au cours de cette thèse j’ai partagé mon temps entre deux laboratoires, mes remerciements sont donc, eux-aussi, en deux temps.
Coté LPS, merci à toute l’équipe du ABCD lab, ainsi qu’aux membres de PicoSeq. J’ai adoré l’ambiance de ce labo. Quelques mercis tout parti-culiers : merci à Vincent de m’avoir donné une perspective sur le monde de la recherche, et même parfois sur le monde en général, toujours avec une grande simplicité ; merci à Bertrand pour ses conseils de biologiste, distillés avec bonne humeur, qui ont souvent été salvateurs et merci à David pour ses discussions florissantes d’idées grâce auxquelles il partage facilement sa vaste culture scientifique. Merci aussi aux plus jeunes qui sont arrivés au fur et à mesure et ont contribué à la bonne ambiance du groupe, en particulier François-Xavier, Tal, Maxime, Saurabh, Fatima et Samar. Merci à Jean-François pour ses conseils autant physiques que gastronomiques, à Gordon pour les barres chocolatées dans le tiroir et les discussions du goûter et merci à Claire pour les pauses remotivantes. Enfin, merci à ces gens dont beaucoup de choses dépendent : Annie qui fait pâlir les clichés sur l’administration française, Marie, Nora, Zaire, Benoît et les membres de l’atelier de mécanique. Pour finir, et bien qu’il ne soit pas du LPS, c’est ici que je remercierai Simon pour nos repas du midi au Petit Chinois qui ont été une occasion de plus d’échanger sur nos vies de thésards.
Coté LIPhy, merci à tous les doctorants et tout particulièrement à mes co-bureaux, Vassanti et Matthieu, et anciennement Vincent et Xavier, pour toutes ces discussions et ces rigolades. Mercis particuliers aussi à Ianis, Yara, Flore, Richard et Joe dont l’anglais a été mis à contribution pour des re-lectures de dernière minute. Merci aussi à la grande équipe DyFCoM, et en particulier Delphine, Lionel, Salima, ainsi qu’à Olivier Rivoire qui a été mon tuteur. Merci enfin à Jessie, Chantal et Nadine pour le volet administratif.
Sur le plan matériel, un bon nombre d’amis, de Paris et de Grenoble, m’ont facilité la vie en m’hébergeant dans l’une ou l’autre de ces deux villes. Par ordre chronologique, merci pour votre accueil à Lucas et aux Giérois, merci à Yacine, merci à Geneviève de m’avoir hébergée à Grenoble puis à Paris avec Clément, merci aux colocs de Bourg-La-Reine, merci à Sophie, merci à Clément et ses colocs, merci à Robin et Julien, merci à Mélanie et V-swag, merci à François-Xavier sur ce tableau-là aussi. Merci enfin à Anna qui m’a accueillie à Londres pour que j’aille donner un séminaire à Cam-bridge. Au-delà de ces considérations matérielles, je vous remercie pour les bons moments passés au cours de ces trois années que vous soyez dans cette liste ou non.
iii Enfin, merci à Yoann, mon coéquipier dans la vie, qui m’a aussi bien aidé sur le plan du logement en supportant une copine à moitié absente pendant 3 ans ; merci aussi de m’avoir écouté raconter les hauts et les bas de cette thèse au jour le jour et merci pour ton soutien pendant la rédaction malgré les circonstances. Merci aussi à Cécile et Jeanine pour leur aide pendant les transitions entre Grenoble et Paris. Pour finir, je remercie ma famille qui m’a amenée jusqu’à cette thèse à force de soutien et d’amour du savoir. Je dédie ce manuscrit à mon grand-père, docteur de l’Université de Grenoble : j’aurais aimé que tu puisses mettre ce manuscrit dans ta bibliothèque et te sentir fier le jour de ma soutenance. Merci aussi à ma grand-mère, à ma maman pour son soutien inconditionnel, à mon papa qui a éveillé ma curiosité scientifique dès le plus jeune âge et à sa compagne, Marie-Isabelle, qui m’a initiée à diverses activités pratiques.
Abstract
In this work, we propose a framework to understand the morphogene-sis of two-dimensional microcolonies. In particular, we have explored how growth and adhesion of individual cells compete during microcolony exten-sion. We have shown (i) that isolated cells display an asymmetry in their adhesion, which is higher at the old pole, (ii) that bacterial elongation can result in pushing forces inside the colony. Since the combination of these two effects is expected to produce mechanical stress at the scale of the mi-crocolony, we have developed a method to measure the resulting adhesion forces using deformable substrates. We have demonstrated that focal adhe-sions are dynamically established and ruptured, with a bias towards the old poles. We have also probed the role of adhesion in the shape of the colony. We have shown that polar adhesion drives the transition from a linear to a two-dimensional growth after the first division. At larger colony sizes, the level of adhesion continues to correlate with the global shape of the colony. Finally, adhesion is involved in the transition from a two-dimensional to a three-dimensional colony. Taken together, our results suggest that the ex-pression of adhesins and their location at the surface of the cells could be levers by which bacteria actively modulate the shape of the group in which they reside.
Contents
Acknowledgements i
Abstract v
Foreword xi
1 Introduction 1
1.1 The biofilm, a sessile bacterial colony . . . 1
1.1.1 Context . . . 1
1.1.2 Biofilm physiology . . . 2
1.1.3 Biofilm formation . . . 6
1.2 The bacterial cell cycle . . . 7
1.2.1 Elongation . . . 9
1.2.2 Septation . . . 10
1.3 Bacterial adhesion . . . 11
1.3.1 Usual adhesion assays . . . 11
1.3.2 Surface proteins implied in adhesion . . . 14
1.4 Growth mechanics of a bacterial colony . . . 20
1.4.1 Evidences of mechanical stress generation . . . 20
1.4.2 Our approach . . . 21
2 Materials and methods 23 2.1 Microscopy . . . 23
2.2 Image analysis . . . 26
2.2.1 Colony segmentation . . . 26
2.2.2 Single-cell segmentation . . . 27
2.2.3 Tracking . . . 29
2.2.4 Precise length measurement and fine detection of the division . . . 32
2.2.5 Morphological parameters . . . 33
2.3 Growth assays between glass and agarose . . . 36 vii
2.3.1 Asymmetric adhesion assays . . . 36
2.3.2 Reorganization following the first division assays . . . . 36
2.3.3 Microcolony growth assays . . . 37
2.4 Laser ablation . . . 38
2.4.1 Set-up . . . 38
2.4.2 Ablation at the 2-cells stage . . . 40
2.4.3 Ablation at the 3-cells stage . . . 41
2.5 Traction force microscopy . . . 43
2.5.1 Adaptation of the technique to prokaryotic cells study . 43 2.5.2 Experimental procedure . . . 45
2.5.3 Tracking of beads and calculation of forces . . . 46
2.5.4 Calibration of the gel stability . . . 49
3 Results and interpretation 53 3.1 One and two cells stage . . . 53
3.1.1 Asymmetric adhesion . . . 53
3.1.2 Adhesion dynamics of pre-existing poles . . . 59
3.1.3 Buckling following the first division . . . 62
3.2 Single-cell dynamics and colony organization . . . 68
3.2.1 Centrifugal displacements driven by uniform growth within the colony . . . 68
3.2.2 Organization of bacteria inside a microcolony . . . 72
3.3 Cell-substrate adhesion . . . 76
3.3.1 Spatio-temporal dynamics . . . 76
3.3.2 Rupture of adhesive bonds . . . 78
3.3.3 Evidence for polar adhesion asymmetry in growing colonies 83 3.3.4 Strength of adhesins . . . 85
3.4 Adhesion contribution in the morphogenesis . . . 88
3.4.1 Influence on morphology . . . 88
3.4.2 Role of adhesion in the transition from planar to a terraced colony . . . 92
3.4.3 Adaptation to the environmental challenge . . . 95
Conclusion and perspectives 99 A Bacterial strains used in this project 101 B Experimental protocols 103 B.1 Agarose/glass sample preparation protocol . . . 103
CONTENTS ix
C Growth rate and bacterial size quantification 107
C.1 Colonies growing between agarose and glass . . . 107
C.2 Colonies growing between agarose and polyacrylamide . . . 111
D Preliminary experiments 113 D.1 Cell length measurements during septation . . . 113
D.2 Reflection Interference Contrast Microscopy . . . 115
E French summary / Résumé en français 117 E.1 Résumé global . . . 117
E.2 Avant-propos . . . 118
E.3 Chapitre 1 : Introduction . . . 119
E.4 Chapitre 2 : Matériels et méthodes . . . 120
E.5 Chapitre 3 : Résultats et interprétations . . . 121
Foreword
A lot of living species tend to organize in communities. From wildebeest herds to bird flocks or wolf packs, from human cities to insect nests, congre-gating requires a certain level of organization, especially regarding the access to external resources. Indeed, living in a group, individuals can benefit from interactions with the other members. On the other hand, having many in-dividuals in the same place, or even in proximity, changes the way a given individual interacts with the environment. From this perspective, the geom-etry of the group seems to be determining for the survival of its individuals. Bacteria are no exception to this trend and develop macroscopic sessile colonies called biofilms. These communities can display different shapes de-pending on various environmental and internal factors. Some morphological characteristics are associated with a particular function in term of accessi-bility to the external resources. A question one can then ask is how these particular shapes are being generated. Although biologists have tackled this question from a biochemical perspective, there is still no clear mechanical framework to understand the formation and development of such colonies.
In the present work, we focus on the formation of monoclonal micro-colonies growing from a single rod-shaped bacterium, confined in two dimen-sions. Although it is mechanically simplified, non trivial phenomena seemed to happen in this configuration. In particular, the final shape of the colony does not reflect the symmetry of its elementary components. This project emerged from discussions about the origin of the transition from a linearly growing bacterium to a compact two-dimensional microcolony. Three years of work have turned these discussions into this manuscript. The first chapter describes the biofilm way of life and details bacterial features that are likely to influence the colony morphology. The second chapter presents the experi-mental techniques that we developed to probe the mechanical interactions at play in the colony morphogenesis. The third chapter gathers our measure-ments and our current understanding of the growth mechanics of bacterial
microcolonies. Finally, appendices provide the description of the strains we used, detailed experimental protocols, growth characteristics measured in our conditions and preliminary experiments that still nourish our discussions.
Chapter 1
Introduction
Bacteria are one of the three first branches of the phylogenetic tree to-gether with archaea and eukaryotes. They are unicellular microorganisms which size is generally on the order of a few micrometers. Unlike eukaryotes, they have no nucleus and their genome is usually displayed as a circular chro-mosome. The genome size is generally smaller than 10 millions base-pairs [1]. Bacteria proliferate by division with very short generation times (typically less than an hour in rich environments). Well adapted over a wide range of environmental conditions [2], they are considered to be the most abundant form of life on Earth [3].
For a long time, bacteria have only been considered as deleterious or-ganisms [4], certainly because of the large number of deaths they have been causing in pandemic infections such as plague (200 millions deaths through time [5]), cholera (hundreds of thousands [6, 7]), tuberculosis [8]... However, this perspective has recently been changing. Studies about obesity [9],
im-munity [10] or anxiety [11] have shown that a proper microbiota1 is required
for good health. Moreover, bacteria start to be seen as promising actors in a variety of industrial processes such as power [12] and biochemicals [13, 14, 15] production, agriculture [16, 17]...
1.1
The biofilm, a sessile bacterial colony
1.1.1
Context
Most bacteria are able to swim individually. Sampling their surroundings, they maximize their interactions with the environment. Alternatively, they
1. The microbiota is the ensemble of microorganisms that live in the human body.
can form sessile colonies, biofilms, at interfaces: liquid/solid, liquid/air or solid/air [18]. Biofilms can reach millimetric sizes and high cell densities within hours. In such configurations, bacteria maximize their interactions with their neighbors, either from similar or other species.
The formation of such structures is a common feature to most bacterial species and some archaea [19]. Some fossile biofilms have been identified in 3.2 billions-year-old formations in South Africa [20] and Australia [21]. In the early 1940’s, it has been quantified that aquatic bacteria are more nu-merous on solid surfaces than as single suspended cells [22]. Since then, it has been commonly admitted than most of the bacterial biomass should be found in biofilm structures. Their predominance is ubiquitous since bacterial biofilms are found in various contexts going from hydrothermal hot springs [19] to glacier streams [23], from soil and plants [24], gums and teeth of many animals [25] to inorganic surfaces.
Since bacteria can colonize biotic and abiotic surfaces to form biofilms, they represent a real medical challenge. Serious and potentially lethal infec-tions, like cystic fibrosis pneumonia [26] or infectious endocarditis [27], are caused by biofilm development in respectively the lungs or the heart of a human host. The ability of bacteria to colonize catheters and medical im-plants make them a major cause of nosocomial infections [28]. From this perspective, understanding the bacterial behaviors inside a biofilm and the characteristics of a biofilm as a whole become crucial scientific issues.
Bacterial biofilms also have an influence in the industrial world. Their presence can be detrimental when they colonize heating or cooling systems, any kind of pipeline networks and even boat hulls increasing significantly the drag force and thus limiting the speed of ships [29]. On the other hand, some industrial processes take advantage of these hardly avoidable colonizations. Biofilm are for instance used as corrosion inhibitors or biocontrol agents [30].
1.1.2
Biofilm physiology
Rheological studies on a variety of biofilms have shown a viscoelastic response –elastic at short times and viscous at long times– with similar timescales of few tens of minutes for a large variety of biofilms [31]. Biofilms are mechanically cohesive due to a secreted extracellular matrix that glues bacteria together. This matrix is composed of entangled polymers such as polysaccharides, DNA, proteins and sometimes lipids. Compared to plank-tonic life, the biofilm offers a protective shell against environmental stresses [32]. For instance, biofilms have been reported to be up to 1000-fold more tolerant to specific antibiotics than their planktonic counterpart [33, 34, 35].
1.1. THE BIOFILM, A SESSILE BACTERIAL COLONY 3 They are also less vulnerable to the immune response of an infected host [36, 37]. More generally, biofilms increase bacterial resistance to UV damage [38, 39], desiccation [40], acidification [41], heavy-metal exposure [42, 43] and even predation [44].
The morphology of the biofilm
The morphology of biofilms has been reported to strongly depend on environmental factors. In fast-moving water, biofilms tend to form filamen-tous structures like streamers whereas in quiescent water, it is more likely to observe mushroom or mound-like structures [19]. More generally the
sym-metry of the biofilm reflects the geosym-metry of the environment. Nutrient
composition also influences the morphology [45]. For instance, Pseudomonas aeruginosa forms flat biofilms in citrate minimal medium whereas it gives rise to mushroom-like structures in glucose minimal medium [46]. Similarly, iron availability was shown to influence the morphology of biofilms [47]. The geometry of a biofilm governs its surface of interaction with the environment. Biofilm geometries have been adapted to maximize bacterial growth. For in-stance, at a solid/air interface, P. aeruginosa forms wrinkly structures that enhance its access to oxygen [48].
The level of matrix production can vary depending on the environment, and especially with the growth medium [49]. Part of the relation between shape and environment may be due to the modulation in matrix production. Phenotypic and genetic variability inside the biofilm
Zooming in a biofilm reveals heterogeneities at different levels.
First, chemical concentrations are not homogeneous. Oxygen-profiles
have been measured with microelectrodes [50, 51, 52, 53] inside macrocolonies. In most cases, the concentration appeared to decrease when progressing deeper inside the biofilm far from the oxygen source, to end up with to-tally anaerobic regions. Such gradients have also been reported for nutrient distribution and pH [54] caused by acid wastes due to fermentation regimes. These gradients have been well described by reaction-diffusion models that take into account both the diffusion of chemicals through the matrix en-vironment and the local consumption or production by bacteria [55]. The location of external sources is another determining factor in the gradient es-tablishment. These locations are determined by the biofilm geometry itself. Depending on the situation, some nutrients are coming from the top or the
bottom [18].
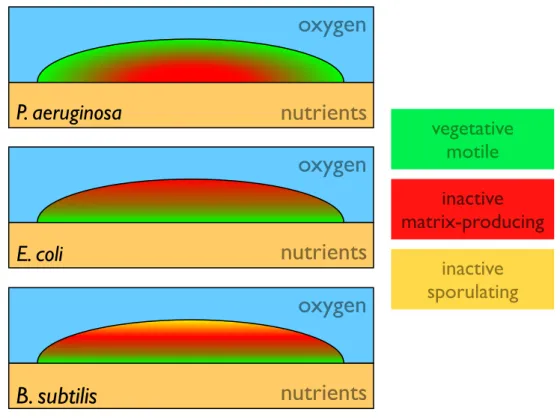
Second, these chemical gradients lead to phenotypic heterogeneities in-side biofilms. For instance, cells could either be in a vegetative state in which the population grew, or in a stationary phase in which cells only maintained essential processes [56]. For most of the studied species, two spatially dis-tinct regions seemed to emerge, delimited by intermediate zones where both states were represented [18]. The location of each phenotypic state depended on the nature of the limiting nutrient and on the geometry of the experi-ment. For instance, macrocolonies growing on agar plates have been studied for P. aeruginosa and E. coli. This configuration implied that oxygen was brought from the top and nutrients from the bottom. For P. aeruginosa, oxy-gen was the limiting chemical since it is essential to keep the cell metabolism active. In this case, a top layer (with a maximal thickness of about 60 µm) of cells exhibiting active protein synthesis was depleting the oxygen in the lower parts of the biofilm where, as a consequence, cells were metabolically inactive [57, 58]. Being inactive, the lower layers allowed nutrients to diffuse to the top layer. On the other hand, E. coli can obtain energy in anaerobic environ-ments through fermentation. Therefore, in the case of E. coli macrocolonies, the diffusion of nutrients from the bottom layer was the limiting factor for growth. Vegetative cells were found in a bottom layer whereas upper parts of the biofilm were composed of inactive cells [59]. More complex cases have also been studied. In hostile conditions, Bacillus subtilis can enter a sporulation state that was found in biofilms together with vegetative swimming bacteria and matrix-producing cells. The location of these three different states was correlated with the nutrients concentration. In nutrient-rich zones (bottom and edges), flagellated cells were dominant. Matrix-producers and sporu-lating cells were respectively found inside the biofilm and in the top part, where nutrient concentration was limited [60]. If these three locations seem reasonable in terms of strategies for expansion, cohesion and dispersal, the mechanism responsible for this spatial differentiation was not initially clear, especially for explaining the location of matrix-producers and spores. Indeed, nutrient-depleted conditions inside the biofilm were expected to trigger the sporulation process. Cannibal behaviors through toxin secretion have been reported [61] for matrix-producers. Nutrient supply from surrounded canni-balized cells has been proposed as a mechanism postponing the sporulation process in the inner part of the biofilm. A schematic view of these three examples is displayed in figure 1.1.
The previous observations rely on the ability to identify different phys-iological states. A parallel has been made between scanning electron
mi-1.1. THE BIOFILM, A SESSILE BACTERIAL COLONY 5
oxygen
nutrients
P. aeruginosa
oxygen
nutrients
E. coli
oxygen
nutrients
B. subtilis
vegetative
motile
inactive
matrix-producing
inactive
sporulating
Figure 1.1 – Spatial distribution of different metabolic states and phenotypes for different strains biofilms grown on nutritive agar plates.
croscopy of biofilm slices and light microscopy of nutrient-limited planktonic
cultures2 [66] since late phases of planktonic cultures resemble the biofilm
situation. In addition, phenotyping could be achieved by looking at the set of σ factors expressed in the biofilm that have their counterpart in
differ-ent stages of the planktonic culture. For E. coli, the couple σ70 and σF liA
is responsible for the flagellar expression whereas the general stress response
factor σS triggers, for instance, polymer secretion [67]. Homologous σ factors
have been reported in other strains [68]. Based on these statements, an ap-proach using engineered strains with fluorescent fusion reporters on the genes 2. A bacterial population grows exponentially as long as nutrients are not limited; when nutrients become limited, bacteria divide less frequently and become highly flagellated to be able to sample more space in order to search for nutrients [62, 63, 64]; when forag-ing become inefficient, they finally enter into a stationary phase where bacteria become smaller, ovoid rather than rod-shaped [65], unflagellated and, in some case, spend their last resources in producing extracellular matrix-component.
of interest, or under the same promoters, enables to quantify the expression of these genes and to assess their spatial distribution inside the biofilm.
Beside this phenotypic variability, genetic diversity has also been reported in biofilms [24]. Mutations are expected to occur due to the large number of bacteria present in biofilm structures. Yet, the number of genetically dif-ferent cells is too high (10% or more of the overall population within a few days [69, 70]) to be explained by random mutations only. With such envi-ronmental heterogeneities in the biofilm, it has been considered that random mutations could be enriched by selection processes due to heterogeneities. Indeed, a fitter mutant could appear in a particular zone of the biofilm and colonize this particular microniche [71]. Horizontal gene transfer has also been reported in both mono-species and multi-species biofilms [72, 73, 74]. This phenomenon probably accounts for a part of the genetic diversity in biofilms grown from clonal individuals.
Biofilms are complex bacterial assemblies that are spatially structured. The biofilm organization is beneficial to the group. Biofilm morphogenesis dynamically adapts in order to regulate the position of the cells with respect to nutrient sources, which in turn modifies the chemical gradients established in the biofilm.
1.1.3
Biofilm formation
Microscopic and macroscopic observations support the idea that the tran-sition from a free-swimming state to a sessile state proceeds in successive, distinct steps (see figure 1.2) [19, 75, 76, 77, 78]. First, a planktonic bac-terium attaches to a surface in a reversible manner. This weak attachment can be unbound, by shear forces for instance, or mature into an irreversible attachment. From there, the bacterium divides to give rise to a small cluster of bacteria called microcolony. This stage can also be achieved by recruitment of other attached bacteria moving on the surface or in the flow. Later on, the microcolony grows into a complex 3D structure, as described in paragraphs 1.1.1 and 1.1.2. From these mature biofilms, some cells can escape. This dispersion process can take various forms. Some isolated cells can detach and recover a planktonic lifestyle. Some aggregates can be torn apart. For biofilms developing at the interface with air, spores (in the case of B. subtilis) can be dispersed in the environment before switching back to a vegetative life when conditions become favorable again.
1.2. THE BACTERIAL CELL CYCLE 7
Figure 1.2 – The different steps of biofilm formation. This figure was initially displayed in [78].
1.2
The bacterial cell cycle
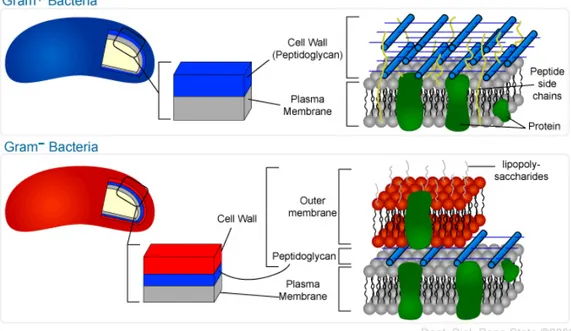
Bacteria can be classified into two categories depending on the nature of their envelop (see figure 1.3a). Gram-positive bacteria have their cytoplasmic membrane covered with a thick layer of entangled peptidoglycan polymers. Gram-negative bacteria have a thinner layer of peptidoglycans that are them-selves enclosed in a second membrane. The space between the inner and the outer membrane is defined as the periplasm. In this thesis, I will focus on the study of the rod-shaped Gram-negative bacteria E. coli and P. aeruginosa.
The cell cycle unfolds in two steps: (i) first, the cell elongates longitu-dinally, (ii) then a septum constricts the bacteria in its middle in order to complete cell division. During the elongation phase, new peptidoglycan in-sertion is homogeneously distributed as patches along the cylindric part of the E. coli rod [80, 81]. Poles are excluded from this process and considered as inert parts, since the two caps remain constituted of the same peptido-glycan molecules [82]. However, for certain bacteria like Corynebacterium glutamicum, the trend is reversed and new peptidoglycans are inserted at
the poles [83, 84, 85]. These two alternative growth patterns have been
associated with the presence in the genome of the actin-like cytoskeletal pro-tein MreB since all the observed polar growing bacilli are lacking this propro-tein. Both the peptidoglycan and the MreB protein are known to play a role in the maintenance of a rod shape. Indeed, the deletion of one or more pep-tidoglycan insertion catalyzers in E. coli leads to bacteria showing abnormal
(a) Envelop structure for Gram-positive and Gram-negative bacteria.
(b) Peptidoglycan structure.
Figure 1.3 – Location and structure of the bacterial peptidoglycan.
The structure of the blue peptidoglycan bars shown in scheme (a) is explained in (b). Red arrows indicate insertion reactions (a: transglycosylation and b: transpeptidation) and yellow arrowheads indicate cleavage activities. (a) and (b) were respectively adapted from the Penn State University’s education website and from [79].
1.2. THE BACTERIAL CELL CYCLE 9 irregular morphologies [86]. Similarly, MreB deletion mutant strains dis-play a spherical regular shape [87, 88, 89]. Moreover, an antibiotic induced depolymerization of the MreB filaments resulted in a decrease in bending stiffness of the bacterium [90]. If it is easily understandable that maintain-ing the cell integrity is crucial for the cell survival, particular shapes also involve specific functions and advantages [91]. For instance, a rod-shaped bacterium will expose more surface to its environment than a coccus of the same volume, which may help to get a larger access to diffusive nutrients for equivalent metabolic needs. In the case of adhesion, an elongated bacterium has a larger part of its envelop in contact with the surface, which promotes adhesion processes.
1.2.1
Elongation
The peptidoglycan layer confers the cell its mechanical integrity. Its elas-tic and robust structure resists the high internal turgor pressure [92]. Its importance is emphasized by the high efficiency of antibiotics targeting its synthesis: for instance, most of β-lactams antibiotics bind to a class of pro-teins, the penicillin-binding proteins (PBPs), that catalyze the cell wall inser-tion process [93]. For most bacteria, the peptidoglycan is composed of long glycan chains that are crosslinked by flexible peptide bonds (see figure 1.3b). The thickness difference observed between Gram-positive and Gram-negative cell walls is due to the number of peptidoglycan layers. E. coli peptidoglycan is composed of a single layer on 80% of the surface but can count up to three layers [94]. Since this number is quite low, the insertion of new material is a delicate process that has to be made without damaging the mechanical integrity of the whole structure.
For the Gram-negative bacteria E. coli and Caulobacter crescentus, the peptidoglycan strands have been observed to be mainly circumferential and oriented perpendicular to the long axis of the cell [95]. The two main precur-sors molecules that will compose the peptidoglycan chain, are synthesized inside the cytoplasm. They assemble into two successive lipid complexes. The second one binds a lipophilic membrane acceptor, called bactoprenol, that enables the lipid translocation through the inner membrane. Before any insertion of new material inside the peptidoglycan mesh occurs, some cova-lent bonds have to be broken (see yellow arrowheads in figure 1.3b). This role is fulfilled by periplasmic peptidoglycan hydrolases, called autolysins. Next, two reactions are necessary to insert the new peptidoglycan strand: (a) during the transglycosylation, it is inserted in the circumferential gly-can chain, then (b) during the transpeptidation, neighboring glygly-can chains
are cross-linked via peptide-peptide bridging (see red arrows in figure 1.3b). These reactions are catalyzed by the PBPs and the lytic transglycosylases [96, 97, 98].
Although crucial to avoid cell autolysis, the way glycan chain cleavage and new material insertion are coordinated remains unclear. Yet models have been proposed [97]. A three-for-one model suggests that three new glycan strands could be inserted in the inner part of the mesh to eventually replace a now obsolete single strand. Such a model is consistent with the observation that a large part of the total peptidoglycan material is removed from the cell wall –40 to 50% per generation [98]– and recycled for new glycan synthesis [99].
MreB polymerizes in short filaments oriented perpendicular to the cell
axis3. These filaments colocalize with enzymes and molecules involved in the
peptidoglycan synthesis [103], for instance MurG that catalyses the transg-lycosylation [104]. Moreover, the movement of these filaments is strongly linked to the cell wall insertion machinery since they stop when the cell is exposed to antibiotics targeting cell wall assembly [105, 106]. Thus, MreB is suspected to play a role in the peptidoglycan recruitment [107].
1.2.2
Septation
During the septation phase, cell wall is preferentially added in the sep-tum region [81] and colocalizes with both MreB and FtsZ. FtsZ is another cytoskeletal protein which is a tubulin-homologue [108]. Like tubulin, it can assemble in protofilaments [109]. During septation, it forms a dynamic poly-mer structure [110], the Z-ring, that is tethered to the cytoplasmic membrane by the FtsA [111] and ZipA [112] membrane proteins. The location of the Z-ring is ensured by the ensemble of MinC-D-E proteins. Their pole-to-pole oscillation creates gradients of division inhibitor with a minimal concentra-tion at mid-cell. Thus, septum formaconcentra-tion is prevented anywhere but in this particular position [113, 114]. In timelapse fluorescence light microscopy, this structure looked like a shrinking ring. However, more resolved electron cryotomographic reconstructions of Caulobacter crescentus septum suggested that the "ring" may instead be composed of multiple short filaments of var-ious lengths (around 100 nm) and curvatures [115]. Change in curvature has been proposed as a way for FtsZ to transmit a mechanical work to the membrane. A GTP-bound polymer is straight while a GDP-bound polymer 3. MreB was first thought to form an helical cable, but these observations are now known to be the result of an artifact due to the protein fluorescent tag [100, 101, 102].
1.3. BACTERIAL ADHESION 11 is curved [116]. Thus, the transition from one conformation to the other may result in a transmitted bending force as suggested by in vitro experiments [117]. Beside constriction, FtsZ is responsible for the recruitment of other proteins: after the Z-ring is formed, it serves a scaffold for proteins implied in the division process [118]; before the septum appears, it enhances the synthe-sis of peptidoglycans at mid-cell by interacting with the cell wall precursor molecule, MurG [119].
1.3
Bacterial adhesion
The bacterial cell wall is covered by a large variety of macromolecules. Some of them –adhesins– are involved in adhesion processes, either on abi-otic surfaces, or on biological surfaces, including the cell wall of other bac-teria. Adhesion is a crucial step in biofilm formation (see paragraph 1.1.3). Thus, the propensity of a strain to form biofilm gives an insight on the adhesive feature of this particular strain. Moreover, morphological observa-tions of mature colonies can sometimes be linked to bacteria-surface and/or bacteria-bacteria interactions [120]. Genetic screenings can be conducted using evolved or engineered strains. Adhesion features of mutants of partic-ular surface molecules (variant, deletion, under-expressing or over-expressing mutant) are compared with the features of a reference strain [121, 122, 123]. When the adhesion phenotype is modified, the surface molecule is considered to be implied in the adhesion process.
1.3.1
Usual adhesion assays
Experimental assays
The propensity of bacteria to adhere to a particular surface can be probed by incubating a bacterial suspension in contact with a surface, removing the liquid phase after a given time and, finally, estimating the number of adhered bacteria. An estimation of the number of bacteria which remained attached to the surface can be achieved in various ways: by staining of culture tubes residue with crystal violet [124], by re-suspending adhered bacteria in order to measure the optical density (OD) of this solution [125], by measuring the radioactive signal of labelled bacteria with a scintillator [126], or by directly counting the number of adhered bacteria using videomicrocopy [127, 128, 129, 130]. An alternative to rinsing is obtained by flipping the surface upside down to allow unbound cells to sediment to the bottom of the sample [131].
Since surface colonization has been shown to proceed in two distinct steps –a transient reversible attachment followed by a permanent attachment–, adapting the time during which bacteria are allowed to adhere, rinsing or in-verting the samples can be strategies to probe preferentially one phase or the other. Microfluidic assays offer a way to look into the dynamics of adhesion by measuring time-dependent surface coverages as well as residency times [132, 133], allowing a direct distinction between transient and permanent adhesion. Moreover, microfluidic assays provide an opportunity to estimate the strength of adhesion by imposing a known shear stress (typically on the order of 1-10 Pa). Indeed, the flow rate can be converted into a drag force applied to an adhered bacterium given its exposed surface, the channel ge-ometry and the fluid viscosity [134, 135, 136, 133] . Although this method does not measure directly the strength of adhesion, it gives a lower bound of the force necessary to detach bacteria (typically, F>10pN).
During the 80’s, more direct measurements of adhesive forces were ob-tained by measuring the contact angle of a bacterial suspension spread over a surface of known interfacial energy [128, 129, 137]. From these measurements, we estimated the adhesive force per bacteria to be on the order of 600 pN. During the 90’s, atomic force microscopy (AFM) has been developed and used to probe bacterial adhesion. Bacteria were coated on a surface, either a substrate [130, 138] or the AFM tip [139, 140], and presented to the surface on which adhesion was probed. Measured forces corresponded to the detach-ment of a group of adhered bacteria from the latter surface. Forces were on the order of several nN. Similar order of magnitudes were measured while removing a cluster of adhered bacteria by centrifugation [141].
AFM was then used to probe the interaction between a single bacterium and a surface. In this configuration, the AFM tip served to detach later-ally a cell, either by pressuring the bacteria between the cantilever tip and the surface [138, 142, 141], or by vertically pulling on it [143]. Measured forces were on the order of several hundreds of pN. Similarly, detachment assays were performed using optical tweezers [144] which yielded lower val-ues (10-100 pN). Alternatively, flow experiments were conducted to measure the forces necessary to detach adherent bacteria in a micro-channel [135] (150 pN).
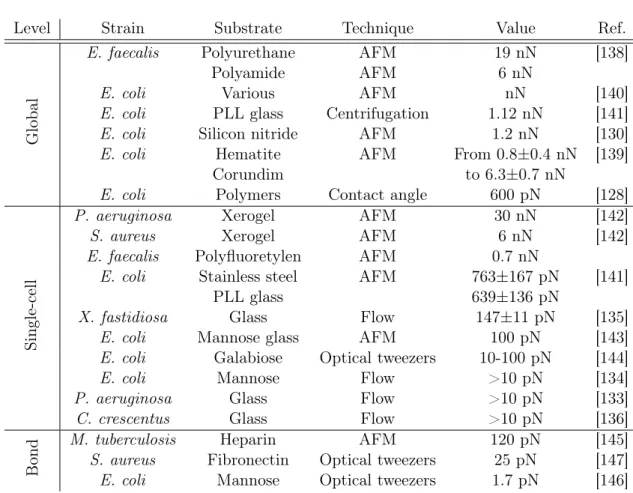
Finally, forces required to break single bonds were measured either by AFM [145] or by optical tweezers [146, 147]. The two techniques yielded distinct results. AFM measurements were on the order of 100 pN, while optical tweezers measurement were on the order of 20 pN.
1.3. BACTERIAL ADHESION 13
Level Strain Substrate Technique Value Ref.
Global
E. faecalis Polyurethane AFM 19 nN [138]
Polyamide AFM 6 nN
E. coli Various AFM nN [140]
E. coli PLL glass Centrifugation 1.12 nN [141]
E. coli Silicon nitride AFM 1.2 nN [130]
E. coli Hematite AFM From 0.8±0.4 nN [139]
Corundim to 6.3±0.7 nN
E. coli Polymers Contact angle 600 pN [128]
Single-cell
P. aeruginosa Xerogel AFM 30 nN [142]
S. aureus Xerogel AFM 6 nN [142]
E. faecalis Polyfluoretylen AFM 0.7 nN
E. coli Stainless steel AFM 763±167 pN [141]
PLL glass 639±136 pN
X. fastidiosa Glass Flow 147±11 pN [135]
E. coli Mannose glass AFM 100 pN [143]
E. coli Galabiose Optical tweezers 10-100 pN [144]
E. coli Mannose Flow >10 pN [134]
P. aeruginosa Glass Flow >10 pN [133]
C. crescentus Glass Flow >10 pN [136]
Bond
M. tuberculosis Heparin AFM 120 pN [145]
S. aureus Fibronectin Optical tweezers 25 pN [147]
E. coli Mannose Optical tweezers 1.7 pN [146]
Table 1.1 – Summary of the measured adhesion forces with different tech-niques.
Adhesion specificity
As emphasized by the previous results, bacteria do not adhere with equal strength on every surface. The techniques mentioned above have been used and adapted to probe the interactions with different surfaces. First, differ-ent bare materials were tested: glass [127, 131, 135], polystyrene [125, 129], mineral crystal [139], polydimethylsiloxane (PDMS) [133]... To test the influ-ence of physico-chemical parameters (hydrophobicity or charge for instance) on adhesion, more controlled experiments have been carried out to com-pare adhesion on surfaces differing only by given physico-chemical properties [126, 148].
In order to probe biochemical specificity, adhesion assays have also been performed with substrates coated with biological molecules, like Bovin Serum Albumin (BSA) [137], polylisine [141], mannose [132, 146], galabiose [144]... It turned out that some adhesins are able to specifically recognize some of
these molecules, mannose and galabiose for instance. Structural analyses emphasized the specificity of some proteins with environmental molecules [149, 150].
Recent studies focused on the influence of the substrate stiffness on adhe-sion, revealing a mechano-sensitive effect. A weaker adhesion with increasing stiffness was observed on PDMS surfaces of rigidities ranging from 0.1 to 2.6 MPa [151]. On the contrary, adhesion was enhanced for increased stiffnesses on surfaces made of polyelectrolyte multilayer (PEM) thin films rigidities ranging from roughly 1 to 100 MPa [152].
1.3.2
Surface proteins implied in adhesion
In Gram-negative bacteria, secretion of surface proteins is challenging be-cause of the two membranes. Thus, secretion is achieved by different path-ways.
Type I fimbriae secretion via a chaperone usher pathway
Bacte-rial fimbriae are µm long pili. They are secreted at the surface of the cells (see figure 1.5). They are composed of subunits, called pilins, and termi-nated by an adhesive protein, the adhesin tip, that can bind specifically to certain types of surfaces. Subunits are transfered to the perisplasm via the
Sec secretion pathway4 where they bind to a chaperone protein that assists
the protein folding [155] and prevents the polymerization. The pilin is then translocated through the outer membrane pore formed by the usher protein [156]. The usher protein also serves as an anchorage for the pilus (see fig-ure 1.5). The tip protein is the first one to go out and the pilus grows by addition of new subunits at the usher location [157, 158, 159, 160]. E. coli displays many fimbrial structures secreted this way [153]. One of the most commonly studied is the type I pilus, encoded in the fim operon. They are not always expressed (phase-variation), bacteria can randomly switch from a state in which they produce type I pili to a state in which they do not.
Switching rates are on the order of 10−3 per cell per generation [161]. FimC
is the chaperone protein, fimD, the usher. Thousands of copies of fimA, the pilin subunit, polymerize into an helical rod structure terminated by a single copy of successively fimF, fimG and fimH, the tip adhesine [162]. Type I pili are involved in the adhesion process and are required for biofilm formation, 4. The Sec secretion pathway is a type II secretion system. It enables the transport of proteins in an unfolded form through the inner membrane [154].
1.3. BACTERIAL ADHESION 15
in particular for the initial attachment [121, 163]. FimH can bind specifi-cally to mannose [164]. In flow conditions, the adhesion strength has been observed to increase with shear [165, 132]. A structural mechanism based on allostery has been proposed for this catch-bond [166, 149]. As many other Gram-negative bacteria [167], P. aeruginosa also expresses chaperone-usher secreted fimbriae, encoded in the 5 gene clusters, cupA to cupE [168]. Simi-larly to E. coli, their role is important for biofilm initiation [122].
Autotransporters secretion via the type V secretion sytem The
type V secretion system enables proteins to cross the outer membrane. They are usually transported to the periplasm by the Sec secretion system [169]. Once in the periplasm, a part of the protein nucleates a transmembrane β-barrel pore, allowing the other part of the protein to be translocated and anchored to the membrane (see figure 1.5) [170]. Autotransporters are ex-amples of type V secreted proteins [169, 171, 172]. Antigen 43 (Ag43) is an autotransporter adhesin. It is involved in auto-aggregation [123, 173, 174]. There is a phase variation in its expression with switching rates of the order
of 10−3 per cell per generation [175, 176]. Other autotransporter adhesins
have been discovered lately. Their expression is cryptic but when expressed, they are promoting adhesion to abiotic surfaces like PVC [177].
Curli amyloid fibers secretion via the extracellular
nucleation/pre-cipitation pathway Curli are highly stable 6-12 nm wide and 0.5 to 1 µm
long, non-branching fibers [179] that form extracellular polymer clusters (see figure 1.5). Specific curli genes are located on two divergent operons: csgBAC and csgDEFG. The major curli subunit, csgA, is secreted under a soluble form in the extracellular environment through a 2 nm wide pore composed of csgD subunits. Inside the periplasm, csgE prevents the polymerization of csgA [182]. On the other hand, in the extracellular environment, csgA poly-merization is nucleated by the csgB minor subunit [183], which is anchored to the outer membrane by csgF (see figure 1.5). For wild-type E. coli strains, curli expression is significant in stationary phase (under regulation of the
master stationary phase regulator σS), at low temperature (below 30˚C),
in high osmolarity and low oxygen conditions [184, 185]. The expression of curli is positively regulated by the transcription factor OmpR [186]. A mutant on this protein lead to a strain (OmpR234) displaying increased sur-face colonization, biofilm and aggregation phenotypes [184, 125, 187, 188]. It thus emphasized the role of curli in adhesion to abiotic surfaces like glass,
1.3. BACTERIAL ADHESION 17
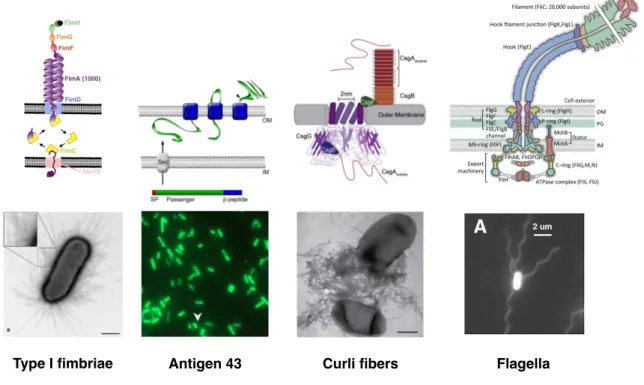
Type I fimbriae Antigen 43 Curli fibers Flagella
Figure 1.5 – Adhesins secretion and visualization in E. coli.
From left to right are displayed type I fimbriae (chaperone-usher secretion system and TEM images, scale bar is 700 nm), antigen 43 (autotransporter type V secretion system and immunofluorescence of Ag43 for a set of E. coli cells), curli amyloid fibers (nucleation/precipitation pathway and TEM im-ages, scale bar is 500 nm) and flagella (structure scheme and images of fluorescent-labelled flagella, scale bar is 2 µm). Schemes and images were extracted from [159, 162, 178, 176, 179, 180, 181].
polystyrene or sand, as well as to biotic surfaces, like other bacterial cell walls, or eukaryotic tissues, through a fibronectin specific interaction.
Flagellum secretion Flagella are long –up to 15 µm– filaments rotating
at the surface of cells (see figure 1.5). A flagellum is composed of 3 struc-tures that are assembled chronologically: the basal body, the hook and the helical filament. The basal body acts as the engine of the flagellum. The
stator part is composed of MotA and MotB proteins. They form
trans-membrane channels through which ions (H+ or Na+) can flow, providing power. The stator interacts with the rotor via the C ring, a cytoplasmic complex compose of FliG, FliM, and FliN. The rotor part also includes a membrane-supramembrane (MS) ring (FliF), a P ring (FlgI) and a L ring (FlgH), respectively going through the inner membrane, the pepdidoglycan layer and the lipopolysaccharides. These rings serve as a scaffold for the insertion of a rod (FliE, FlgB, FlgC, FlgF, and FlgG) that is linked to the other structures of the flagellum. A flexible highly curved nanometer-long hook (around 120 copies of FlgE) connects the rod to the filament, a tube constituted of up to 20 000 copies of flagellin subunits, FliC and a cap protein FliD. A type III dedicated secretion machinery is housed inside the C and MS rings and initiates the successive transport of constitutives subunits of the rod, the hook and the filament from the cytoplasm through the entire structure (see figure 1.5) [189, 190, 180, 191].
E. coli displays on average 4 flagella on its surface. They are located all over the cell envelop; yet more flagella are found close to the pole that was
preexisting before the last cell division5, probably inherited from the former
cell cycle [193]. If their rotation is synchronized, they can form a bundle to propel the cell in a liquid environment. Alternating synchronized and unsyn-chronized regimes result in a brownian-like bacterial swimming motion [181]. Despite the fact that flagellar expression seems to be shut down during the sessile growth mode [194], flagella are required to initiate biofilm formation [121]. Moreover, the fact that the flagellar rotation is inhibited by this ad-hesion is seen as a probable way of sensing surfaces, and in consequence, to switch to a biofilm mode [191, 195].
A large quantity of other adhesins (see figure 1.4) can be displayed at the 5. A each division, two new poles are formed, one on each sister cells. The two former poles of the mother cell (preexisting poles) are thus one generation older than the newly formed poles (see figure 2.4). Moreover, through the preexisting pole conservation, proteins can be inherited from one generation to another [192].
1.3. BACTERIAL ADHESION 19 surface of a cell, depending on environmental conditions, with specificity to various surfaces [153]. They can promote either cell/abiotic surface adhesion, cell/biotic surface adhesion –ranging from adhesion to neighboring bacterial cells to adhesion to eukaryotic cells which marks host invasion– and even sur-face motility. For instance, twitching motility is powered by the extension, tethering and retraction of type IV pili in enteropathogenic E. coli, P. aerug-inosa, Myxococcus xanthus, Neisseria gonorrhoeae and elongata [196, 197]... However, the E. coli K-12 strain has not been observed to produce these pili under standard laboratory conditions [198]. Non-proteinaceous macro-molecules are also secreted at the cell surface. Polysaccharides are examples of such molecules involved in the biofilm formation phenotype, and, thus, in adhesion [131].
1.4
Growth mechanics of a bacterial colony
Bacterial elongation (see paragraph 1.2) and adhesion (see paragraph 1.3) of individual cells can generate mechanical stress. When considered at the scale of a microcolony, the combination of these stresses may result in par-ticular arrangements.1.4.1
Evidences of mechanical stress generation
At the individual cell level, bacterial elongation can generate forces on
the surrounding environment. Indeed, E. coli cells embedded in agarose
were still able to elongate and deformed the agarose gel up to 1MPa [192], corresponding to forces on the order of 10 nN. Besides, adhesion forces de-veloped by single bacteria on a surface have been measured to be on the order of 100 pN (see paragraph 1.3.1, table 1.1). This implies that bacte-rial elongation could generate large enough forces to disturb the adhesion of neighboring cells. Finally, bacteria-bacteria interactions –evidenced through bacterial aggregation– also seem to be an important ingredient of the me-chanical description of microcolonies. This interaction has a tendency to align neighboring cells [199]. Although no direct measurement has yielded value for this interaction, optical tweezers have enabled to measure a repul-sive force on the order of 10 pN between two B. subtilis cells [200].
Up to date, little work has focused on how these elements balance at the scale of a microcolony. Monolayers of E. coli cells have been studied in 1 µm high channels of finite width (between 30 and 90 µm). Local bacterial elongations, coupled together by lateral contacts, resulted in a long-range orientational ordering of the bacteria inside the colony, with a characteristic correlation length of the order of a dozen of cells [201, 202]. However, buckling instabilities in high pressure zones triggered rearrangements and prevented the perfect nematic order from being achieved [203]. Another study looked at the transition from 2D to 3D growth. Microcolonies were confined between a soft hydrogel and glass. In such a configuration, the colony initially develops in 2D. When the number of bacteria in the monolayer becomes large, a sec-ond layer appears on top of the first one. Both the lateral confinement from the gel and the interactions between the bacteria and the confining surfaces –modeled by friction– have been shown to play a role in this transition from 2D to 3D growth [204].
1.4. GROWTH MECHANICS OF A BACTERIAL COLONY 21 In mature 3D biofilms, buckling has also been reported and was shown to result in the wrinkles observed at the surface of B. subtilis biofilms [205]. Yet, in this case, the mechanical configuration is more complex due to het-erogeneities (see paragraph 1.1.2) in stiffness (linked to matrix production) [206] and in growth rate (different growth regimes and cell death) [205].
1.4.2
Our approach
Taken together, these studies suggest that the balance between mechan-ical stresses generated by different processes can control the morphology of bacterial colonies (ordering and rearrangement, 2D or 3D growth, wrin-kling...). However, the role of adhesion and its influence in this balance has been poorly studied. In particular, we wondered how colonies manage to grow while maintaining their adhesion to the substrate.
In this work, we have probed mechanical interactions between E. coli or P. aeruginosa cells and their substrate. Bacteria were observed either iso-lated or inside growing microcolonies, in order to study respectively adhesion without or with mechanical interactions with neighboring cells.
We restricted our study to two-dimensional growing microcolonies for the following reasons. First, from a mechanical prospective, the geometry is simpler, compared to a 3D structure. Second, biological heterogeneities are less important than in a mature biofilm where differentiation occurs. Finally, two-dimensional studies allow to image microcolonies with single-cell resolution, yielding information at the individual level. To achieve these conditions, we imposed a two-dimensional confinement. Yet, as in the 2D to 3D transition study [204], bacteria eventually overcame their 2D confinement and started growing in 3D. We also provide an analysis of this transition.
Chapter 2
Materials and methods
Most of the experiments described in this chapter use time-lapse mi-croscopy to image clonal microcolonies growing as monolayers. They were confined in two dimensions in order to ease their segmentation by image analysis so as to keep single-cell resolution for a significant time.
2.1
Microscopy
Video microscopy was performed on three different inverted motorized microscopes which allowed multi-positioning.
Leica SP8 Experiments presented in section 2.3.3 for morphological
anal-ysis were performed with a Leica SP8 confocal microscope equipped with a 40x/NA 1.30 phase oil-immersion objective (Apo-Ph3, Leica). Images of bacteria were acquired in a non-confocal mode using phase contrast. Trans-mitted light was detected on a photomultiplier tube (PMT) detector.
Set-tings were adjusted to have a 140 nm pixel size on 1024×1024 images and
pinhole size was 1 airy unit. Multi-positioning was allowed by an XY motor-ized stage (DMI6000). Objective position was locked on the focal plane by a Leica Adaptive Focus Control (AFC). These elements were controlled by the Leica commercial software (Leica Application Suite X). An environmental chamber (Digital Pixel, UK) fitted on the microscope enabled the regulation of the sample temperature.
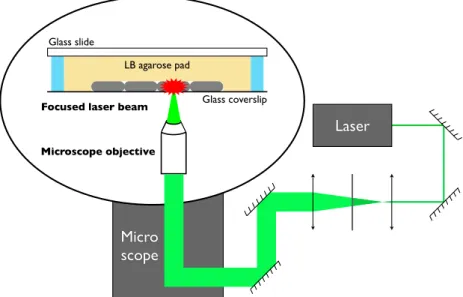
Olympus IX81 Laser ablation (see section 2.4) and traction force
mi-croscopy (see section 2.5) experiments were performed using an Olympus IX81 inverted microscope. Bacteria were imaged through a 100x/NA 1.35
phase oil-immersion objective (Apo-ph1, Olympus) with a Orca-R2 CCD
camera (Hamamatsu, physical pixel size 6.45 µm). The effective pixel size
was 63.9 nm on 1024×1024 pixels images. Multi-positioning was achieved
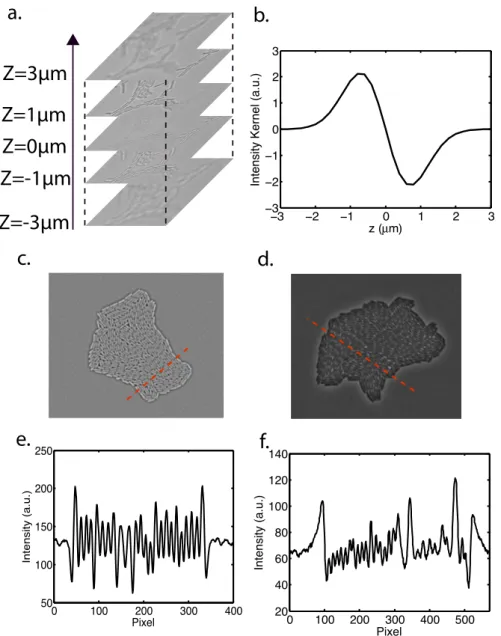
by the use of a Thorlabs XY motorized stage (MLS203-1). Epifluorescence excitation was performed using a mercury vapor light source (EXFO X-Cite 120Q) coupled with different filter sets to select the desired wavelengths. To reduce phototoxicity, GFP was imaged with a YFP 542(24)/500(27) nm filter set using a dichroic beam-splitter at 520 nm (Semrock). RFP was im-aged with a 624(40)/562(40) nm filter set using a dichroic beam-splitter at 593 nm (Semrock). The different parts were controlled by a custom Lab-View (National Instruments) program. Two subroutines were dedicated to the 3D tracking of a region of interest. Lateral drifts were compensated by correlating two successive images. Focusing was achieved by analyzing the contrast variation in a z-stack of images. For phase contrast images, the focus z-position corresponds to a global maximum of contrast, whereas for bright-field images it corresponds to a local minimum. The focal z-position was detected according to the image type and the objective was displaced to record the final image. We used bright field images to reconstruct correlation images (see figure 3.20b). This imaging technique, described in [207], was used to enhance the contrast on the edges of the cells to ease segmentation. It is based on the acquisition of a z-stack of bright field images centered on the focal position –typically an image every 200 nm over a 6 µm range. A z-profile is extracted for each pixel and correlated with a reference
pro-file1. The final intensity value of the pixel was calculated as the correlation
between the pixel profile and the reference profile (see figure 3.20b). Tem-perature of the objective and the stage was regulated by a custom controller with a 10 mK accuracy.
Custom microscope Asymmetric adhesion assays (see section 2.3.1),
re-organization following the first division assays (see section 2.3.2) and mi-crocolony growth acquisitions (see section 2.3.3) were performed with a cus-tom inverted microscope. Bacteria were imaged through a 100x/NA 1.40 phase oil immersion microscope (Apo-ph3, Olympus) with a ORCA-Flash4.0 V2 CMOS camera (Hamamatsu). The effective pixel size was 63.9 nm on
2048×2048 pixels images. A Thorlabs XY motorized stage (MLS203-1) was
used for multi-positioning. Microscope control was performed by an adapted version of the previously described Labview program (see Olympus IX81 microscope description). The temperature control was adapted from a Pi-coTwist solution for a mK accuracy.
1. The reference profile Ker(z) corresponds to the derivative of a gaussian function
2.1. MICROSCOPY 25 0 100 200 300 400 500 20 40 60 80 100 120 140 Pixel Intensity (a.u.) 0 100 200 300 400 50 100 150 200 250 Pixel Intensity (a.u.) −3 −2 −1 0 1 2 3 −3 −2 −1 0 1 2 3 z (Mm)
Intensity Kernel (a.u.)
Z=0µm
Z=-1µm
Z=1µm
Z=3µm
Z=-3µm
a.
b.
c.
d.
e.
f.
Figure 2.1 – The bright field z-stack profile (a) of each pixel is correlated with a theoretical profile (b) that is characteristic of the interior of a bacteria. By looking at the intensity profile of a correlation image (c) and a phase image (d), it appears that cells are easier to distinguish in the correlation profile (e) than in the phase profile (f) for similar colonies. This figure was extracted from [207].
2.2
Image analysis
2.2.1
Colony segmentation
Morphology and growth dynamics can be computed from the mask of the colony. Masks were obtained by binarization of either pretreated gray level images (morphological gradient) or raw gray level images (direct threshold-ing).
Automatic morphological gradient For phase and correlation images
of bacteria growing between agarose and glass, we computed the difference between a dilated and a eroded version of the gray level image to emphasize the contour of the colony. The contour was identified by thresholding using
Otsu’s method2 and filled to obtain the mask of the colony.
Semi-automatic thresholding in presence of tracers During force
measurement experiments, bacteria were imaged at the same time as flu-orescent beads. On phase images, these beads of diameter 200 nm have an intensity similar to the one of bacteria. To obtain the mask of the bacterial colony alone, we used a method based on direct thresholding. For each image, the threshold was calculated on a region of interest (ROI) closely enclosing the colony. Working with a ROI sized to the colony provides a distribution of pixel intensities in which a significant proportion of pixels corresponds to the colony. ROI dimensions were determined for the first image of the time stack and increased exponentially to enclose properly the colony at all times. The
threshold was chosen in a range of ±5% around Otsu’s threshold. Its
deter-mination was kept constant for the whole time stack but was tuned for each experiment to offer the best discrimination between colonies and beads. The whole image was binarised with this threshold but only the larger detected particle was kept as the colony mask. At an advanced stage of growth, the gray levels in the center of the colony approximated those of the background. Thus, masks were filled to ensure to cover the whole colony surface. When the segregation remained imperfect –bead partially under the colony and/or with exactly the same intensity– masks were corrected manually.
2. Otsu’s method for the reduction of a gray level image to a binary image gives the intensity threshold that will separate pixels in two classes with the smallest intra-class variance [208].
2.2. IMAGE ANALYSIS 27
2.2.2
Single-cell segmentation
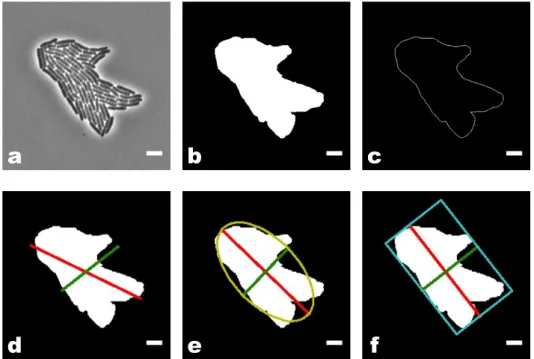
Single-cell resolution was achieved by segmentation of phase or correla-tion images to get the mask of individual bacteria (see figure 2.3a). For this purpose we developed or adapted routines that were used according to the experiment specificities.
Live segmentation for colonies of a few cells
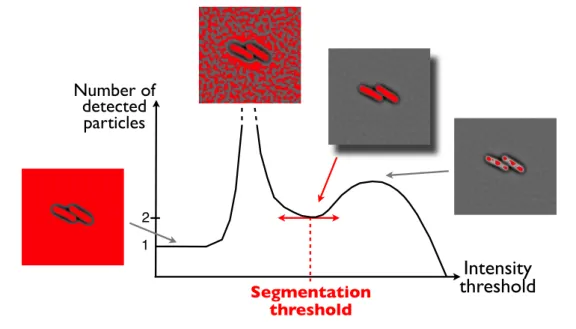
During laser ablation experiments, we had to precisely detect the number of bacteria in the field of view after the acquisition of each frame. In order to keep a single dividing cell in the field of view, an ablation was automati-cally triggered as soon as two cells were detected (see paragraph 2.4.2). To monitor the number of cells, we developed a robust segmentation algorithm for the detection of a low number of cells. It was used on correlation images. The image was binarized with a variable threshold. For each value of the threshold, the number of particles was measured. For correlation images, the threshold corresponding to a local minimum in particle number gave a cor-rect segmentation at a few cells stage (see figure 2.2). This segmentation was automatically performed during the ablation at the 2-cells stage experiments. Post-treatment segmentation
As a first step toward the lineage obtention (see paragraph 2.2.3), a post-treatment segmentation had to be performed on raw images. Routines were developed, or adapted from preexisting codes, to process different types of images.
• Correlation images were binarized with Otsu’s method to retrieve the contour of the cells.
• Phase images were treated with a routine adapted from Philippe Nghe [209]. An approach based on watershedding was used. For force measurement images, tracers were present in the image with an inten-sity similar to bacteria’s. Given the mask of the colony, the use of the routine was restricted to the colony area.
These routines were included in the Schnitzcells suite developed by Michael Elowitz’s group at the California Institute of Technology (CalTech) for seg-mentation and tracking of bacteria [210]. The Schnitzcells suite allows a manual verification step to correct potential mistakes made by the previous algorithms since the lineage reconstruction requires a quasi-perfect segmen-tation of the images.
Intensity
threshold
Number of detected particles Segmentation threshold 1 2Figure 2.2 – Segmentation on correlation images.
The number of detected particles is computed for a range of binarization thresholds. When threshold is 0, the whole image is detected as 1 particle; when threshold is superior to the maximal pixel intensity, no particles are detected. The best segmentation is achieved for the local minimum in particle number.
2.2. IMAGE ANALYSIS 29
2.2.3
Tracking
From the time evolution of a clonal microcolony, one can extract the whole lineage to retrieve individual parameters. To obtain this information, we used a Matlab suite called Schnitzcells that has first been developed by Michael Elowitz’s group [210]. The computation of the lineage required an error-free segmentation of the timelapse images. In a second time, a tracking algorithm associated a bacterium in the image n with itself in the image n+1. This algorithm with size and position based arguments was able to detect division and death events (see figure 2.3b). The output of the routine was a structure for each cell containing the cell parameters (listed on the following page) and the identitfication of the two daughter bacteria. As for segmentation, a manual verification routine enabled the user to check and correct for potential mistakes.
(a) Example of segmentation on an E. coli phase image.
(b) Example of tracking on the same experiment. Figure 2.3 – The two steps of the Schnitzcells analysis.
(a) Segmentation. (b) Tracking: the cell of interest is displayed in yellow. The mothercell is represented in white on the first image and the two daugh-ters are in white and blue on the last image.
For each bacterium at each time point, we could extract: 1. parameters from the fitted ellipse:
— the position of the center of mass of the cell, — the position of the two poles of the cell,
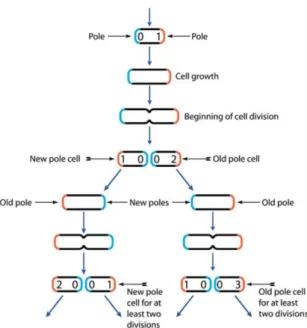
— the length of the cell, corresponding to the major axis length, — the angular orientation of the cell with respect to the image axis; 2. the pole history deduced from the earlier divisions (see figure 2.4). In
particular:
— the new pole defined as the one closest to the septum, — the other defined as the preexisting pole,
— the age of the bacterium defined as the number of generations
since the preexisting pole had been formed3;
3. the relative position of the bacterium inside the colony (see figure 2.5b) given by:
— the distance to the border d, defined as the minimal distance from the center of mass of the cell to the closest border of the colony,
— the angular position of the cell θ(t) with respect to an horizontal axis centered on the center of mass of the colony.
Other quantities could be calculated for one cell cycle (for each cell, from birth to division):
— the growth rate defined as the exponential constant of the fitted temporal evolution of the cell length (see figure 2.5a),
— the cell displacement defined via a travelled distance, || ∆~r ||
= || −−−−→rdivision − −−→rbirth ||, and a displacement orientation α with
respect to an horizontal axis centered on the center of mass of the colony (see figure 2.5b),
— the angular position defined as the average of the angular position over the cycle, < θ(t) >.
3. Note that what we estimate as the age of the cell is always a lower estimate of the actual age of the cell. Indeed, we calculate the age of the cell assuming that the initial cell is of age 1. In reality, it could be older although we do not have access to this information.
2.2. IMAGE ANALYSIS 31
Figure 2.4 – At each division, two new poles are created (in blue, age=0). Recording the number of generations since the preexisting pole has been created, one can define an age for each cell. This figure comes from [211].
0 5 10 15 20 25 30 100.4 100.5 100.6 100.7 100.8 Time (minutes) Length (microns) Measured length Exponential fit (R2=0.9993)
(a) Example of the temporal evolution of an E. coli cell length.
! r(t2) d(t2) d(t1) ✓(t1) ✓(t2) !r ↵ ! r(t1)
(b) Relative position of a cell in-side the colony.
Figure 2.5 – Spatial and temporal information over a cell lifetime.
(a) The temporal evolution of the length of an E. coli cell is well fitted by an exponential (green dashed line). The length is represented in logscale. The
characteristic constant (here 0.0214 min−1) defines the growth rate. (b) The
position of a given cell inside the colony can be described by a set of polar coordinates r and θ with respect to the center of mass of the colony. The distance to the border is displayed in green. Their variations over a cell cycle
![Figure 1.2 – The different steps of biofilm formation. This figure was initially displayed in [78].](https://thumb-eu.123doks.com/thumbv2/123doknet/2318495.28452/24.892.177.650.191.410/figure-different-steps-biofilm-formation-figure-initially-displayed.webp)