Thèse
de
do
ctorat
se
ptem
bre/
2013
Thèse de doctorat en sciences économiques
soutenue le 24 septembre 2013
Monopole naturel, marchés bifaces,
différen-ciation tarifaire: trois essais sur la régulation
de télécommunications
Natalia Shutova
Sous la direction de Laurent Benzoni
Membres du jury :
Nicolas Curien, Professeur émérite au Conservatoire national des arts et métiers, Rapporteur
Marc Bourreau, Professeur de Telecom ParisTech, Rapporteur Bruno Deffains, Professeur à l’Université Paris II Panthéon-Assas Pierre Kopp, Professeur à l’Université Paris I Panthéon-Sorbonne Laurent Benzoni, Professeur à l’Université Paris II Panthéon-Assas
Avertissement
L’université n’entend donner aucune approbation ni improbation aux opinions émises dans cette thèse ; ces opinions doivent être considérées comme propres à leur auteur.
Remerciements
Je tiens tout d’abord à remercier le Professeur Laurent Benzoni d’avoir accepté la direction de cette thèse, d’avoir partagé son expérience et sa connaissance, pour ses conseils avisés et pour la confiance qu’il m’a accordée tout au long de ce travail.
Je souhaite exprimer au Professeur Nicolas Curien toute ma gratitude pour les précieux conseils qu’il m’a prodigués lors de notre collaboration scientifique. Sa rigueur scientifique, sa créativité et son enthousiasme m’ont beaucoup appris. Je lui suis reconnaissante de m’avoir fait l’honneur de rapporter cette thèse.
Je suis reconnaissante au Professeur Marc Bourreau de m’avoir fait l’honneur de rap-porter cette thèse.
J’adresse mes remerciements au Professeur Bruno Deffains pour ses remarques perti-nentes et de m’avoir fait l’honneur de faire partie du jury.
Je remercie également le Professeur Pierre Kopp de m’avoir fait l’honneur de faire partie de ce jury de thèse.
J’aimerais remercier l’équipe de TERA Consultants d’avoir partagé leur expérience de modélisation numérique et leur connaissance du domaine de télécommunications, et de m’avoir permis l’application des théories développées sur des cas d’études réels.
Je tiens à remercier les participants de la conférence sur la recherche appliquée sur l’infrastructure Infraday 2011 pour les retours que j’ai pu avoir lors de ma présentation.
Ma reconnaissance va également à Julien Pellefigue, Paul Le Coz et Timofey Zakrevskiy qui m’ont apporté un indispensable soutien dans leurs domaines respectifs.
Monopole naturel, marchés bifaces, différenciation tarifaire: trois essais sur la régulation de télécommunications
Résumé : La thèse s’intéresse à l’économie de l’industrie des télécommunications et à sa régulation. La première partie est dédiée au déploiement du réseau fixe de fibre op-tique. L’étude de différentes méthodes de régulation permet de comparer les approches en termes de vitesse et d’efficacité du déploiement ainsi que de bien-être de consommateurs. Un modèle technico-économique est construit afin d’estimer les coûts du réseau d’accès de fibre en France et de comparer les résultats des différentes approches de régulation en termes quantitatifs. La deuxième partie applique la théorie de marchés bifaces au domaine des communications électroniques. Elle aborde le sujet de la régulation concurrentielle de marchés bifaces et montre en quoi leur traitement doit être spécifique, en s’appuyant sur des résultats théoriques et études de cas. Un modèle de la discrimination par les prix sur des marchés bifaces est proposé qui révèle les facteurs qui déterminent le caractère favorable ou défavorable de l’impact de la discrimination. La troisième partie étudie la question de l’impact de la différenciation tarifaire en fonction de la destination d’appel sur le marché des communications mobiles. Un modèle théorique est construit et ensuite calibré sur la base de l’exemple du marché français en 2003. Il est montré que des baisses all-net des tarifs vers tous les réseaux simultanément entreprises par tous les opérateurs sont plus avantageux pour les consommateurs que des baisses on-net du tarif intra-réseau.
Descripteurs : télécommunications, régulation, politique de concurrence, marchés bifaces.
Natural monopoly, two-sided markets, price differentiation: three essays on the regulation of telecommunications
Abstract: The thesis focuses on the economics of the telecommunications industry and on
its regulation. The first part is dedicated to the deployment of the fixed network of the optical fibre. The study of different regulation methods allows to compare the approaches in terms of the speed and efficiency of deployment as well as the consumers’ welfare. We construct a technico-economic model of the fibre access network in France in order to compare the results of different regulation approaches in quantitative terms. The second
part applies the theory of two-sided markets to the field of electronic communications. It
deals with the issue of competition regulation on two-sided markets and shows in what way their treatment should be specific, based on theoretic results and case studies. A model of price discrimination on two-sided markets is proposed that reveals the factors determining favourable or unfavourable impact of discrimination. The third part studies the impact of the price differentiation depending on the call destination on the mobile communications market. A theoretic model is constructed and then calibrated based on the example of the French market in 2003. It is shown that the all-net reduction of the tariffs towards all the networks and by all the operators is more beneficial for consumers than the on-net reduction of the intra-network tariffs.
Principales abréviations
ARCEP – Autorité de régulation des communications électroniques et des postes BEREC – Body of European Regulators of Electronic Communications
CAPEX – Capital Expenditure CCA – Current Cost Accounting
FDC (FAC) – Fully Distributed (Allocated) Cost FTTH – Fibre To The Home
HCA – Historical Cost Accounting
LR(A)IC – Long Run (Average) Incremental Cost NGN – Next Generation Network
ODF – Optical fibre Distribution Frame OPEX – Operational Expenditure PON – Passive Optical Network TSM – Two-Sided Markets
Sommaire
Introduction générale
19
I
Regulating transition from old to new infrastructure in fixed
telecommunications
31
Introduction 33
1 Review of approaches to regulating next generation networks 39
1.1 Local loop as a natural monopoly . . . 39
1.2 Main approaches to the fibre deployment regulation . . . 43
2 Model 47 2.1 Cost a function of operators number . . . 48
2.2 Comparison of regulatory scenarios . . . 48
2.2.1 Regulated monopoly with wholesale access . . . 49
2.2.2 Market configuration currently observed in France . . . 52
2.3 Sensitivity analysis . . . 56
2.3.1 Extra cost of point-to-point horizontal network . . . 56
2.3.2 Risk premium parameter . . . 57
3 Comparison of different approaches to regulating fibre network deploy-ment 61 3.1 The impact of the different regulation approaches on the social welfare . . 61
3.2 Regulating price of wholesale access to infrastructure . . . 67
Conclusion 75
Appendix 77
II
Regulating two-sided markets of electronic communications
95
Introduction 97
1 Competition policy on two-sided markets: literature review 101
1.1 Impact of the degree of competition on prices and social welfare . . . 104
1.2 Market definition . . . 106
1.2.1 Market definition analysis based on qualitative methods . . . 107
1.2.2 Statistical analysis . . . 109 1.2.3 Examples . . . 111 1.3 Market power . . . 113 1.4 Merger analysis . . . 115 1.4.1 Horizontal mergers . . . 115 1.4.2 Vertical integration . . . 119
1.5 Unilateral anticompetitive practices . . . 119
1.5.1 Predation and excessive pricing . . . 119
1.5.2 Tying . . . 122
1.5.3 Exclusive dealing . . . 126
1.5.4 Price discrimination . . . 132
1.6 Coordinated anticompetitive practices . . . 138
1.6.1 Coordination between platforms . . . 139
1.6.2 Coordination between members of the same platform . . . 139
1.7 Conclusion: specifics of competition policy on two-sided markets . . . 141
2 The effects of asymmetric prices on two-sided markets: a case study of online declaration services 143 2.1 Context . . . 143
2.2 Two-sidedness of the online declaration services . . . 144
2.3 Pricing on the two-sided market of online tax filing services . . . 145
2.4 A simple model . . . 146
2.5 Conclusion: asymmetric prices on two-sided markets . . . 151
3 Price discrimination on two-sided markets 153 3.1 Case studies . . . 153
3.1.1 Internet industry and the question of neutrality . . . 154
3.1.3 Advertisement markets . . . 160
3.1.4 Online markets . . . 162
3.1.5 Internet social networks . . . 164
3.2 A model of perfect discrimination: general assumptions . . . 165
3.3 A monopoly model . . . 171
3.3.1 Users’ optimal coordination . . . 171
3.3.2 Users’ expectations on a newly created market . . . 178
3.3.3 Users’ expectations on a well established market . . . 184
3.3.4 Sellers’ incentives to invest in quality . . . 185
3.4 A duopoly model . . . 188
3.4.1 Duopoly and optimally coordinating users . . . 189
3.4.2 Duopoly and competition between incumbent and entrant . . . 193
3.4.3 Duopoly model with differentiation on the buyer side . . . 193
3.5 Conclusion: price discrimination on two-sided markets . . . 198
Conclusion 203
Appendix 205
III
Différenciation tarifaire on-net/off-net : nouvelle approche
théorique et modèle de simulation
241
Introduction 243
1 Présentation du modèle 253
1.1 Hypothèses et notations . . . 253
1.1.1 Parcs de clientèle, tarifs et trafics . . . 253
1.1.2 Structure des préférences individuelles . . . 255
1.1.3 Fonction d’utilité . . . 258
1.2 Fonctions de demande . . . 260
1.2.1 Propriétés générales . . . 260
1.2.2 Deux cas remarquables . . . 264
2 Les états remarquables de marché 267 2.1 Optimum de court terme . . . 267
2.1.1 Caractérisation de l’optimum de court terme . . . 267
2.1.2 Décentralisation de l’optimum de coourt terme . . . 269
2.2 Equilibre de court terme . . . 270
2.2.1 Equilibre de court terme non régulé . . . 270
2.2.2 Equilibre de court terme régulé . . . 273
3 Impacts de changements tarifaires 275 3.1 Impact sur les volumes de trafic . . . 276
3.2 Impact sur les consommateurs . . . 277
3.3 Impact sur les opérateurs . . . 280
3.4 Impact économique global . . . 282
4 Analyse numérique 285 4.1 Revue des approches à l’estimation de fonctions de la demande en télécom-munications . . . 285
4.2 Inputs et hypothèses de calibrage . . . 291
4.3 Procédure de calibrage . . . 294
4.3.1 Coefficients de déformation . . . 295
4.3.2 Trois scénarios de substituabilité . . . 296
4.3.3 Réduction du système paramétrique . . . 298
4.3.4 Calculs numériques . . . 300
4.5 Etats remarquables du marché . . . 303 4.6 Trois transitions tarifaires alternatives . . . 306 4.7 Un scénario révélateur . . . 311
Conclusion 315
Annexe 317
Bibliographie 326
Depuis une cinquantaine d’année, l’économie des télécommunications s’est progressive-ment constituée comme un champ spécifique de la microéconomie et de l’économie indus-trielle. Son programme de recherche est pluridisciplinaire, à l’intersection de l’économie de la concurrence et de la régulation, de l’économie des contrats et de l’analyse économique du droit1. Il existe aujourd’hui un très vaste corpus de travaux dans ce domaine, qui recouvre
à la fois des articles purement théoriques ainsi que des analyses empiriques de problé-matiques concrètes (allocation des coûts dans des entreprises multiservices, mécanismes d’enchères optimales, etc.)
L’un des enjeux principaux de l’économie des télécommunications concerne l’efficience des mécanismes de marché, et, lorsque cette efficience est prise en défaut, l’identification des modalités d’interventions réglementaires optimales. Cette question a, par exemple, conduit à de multiples travaux de recherche sur la tarification efficiente du prix des interconnexions, sur les « justes » moyens réglementaires de forcer l’introduction de la concurrence tout en maximisant l’efficience productive, sur les conditions de l’accès aux infrastructures essen-tielles pour empêcher un opérateur d’altérer la concurrence sur les marchés aval, sur les formes de la régulation des prix de détail nécessaire pour empêcher dans certains cas les opérateurs d’augmenter les prix jusqu’à un niveau préjudiciable aux consommateurs (no-tamment pour le service universel).
Cette focalisation sur les questions de défaillance du marché et de systèmes d’interven-tion hors-marché s’explique naturellement par les caractéristiques économiques du secteur des télécommunications : externalités positives de consommation, intensité capitalistique de certains segments, progrès technique et obsolescence rapide tant des inputs que des outputs, utilisation de ressources « rares » (fréquences), fonction de coûts sous-additive, etc. D’un point de vue théorique, ces caractéristiques doivent être prises en compte lors de la modélisation des marchés de télécommunications.
D’un point de vue pratique, ces caractéristiques ont justifié l’instauration, dans tous les pays du monde, d’une régulation centralisée ex ante pour compenser les défaillances structurelles du marché. De même, une attention particulière est généralement accordée 1Les premiers travaux dédiés à l’économie des télécommunications sont apparus dans les années 1970.
Voir par exemple : Littlechild, Stephen C. Elements of telecommunications economics. P. Peregrinus, 1979 ; Herring, James Morton, and Gerald Connop Gross. Telecommunications : Economics and
Regula-tion. Arno Press, 1974. Pour une revue, voir par exemple Majumdar, Sumit, Ingo Vogelsang, and Martin
Cave. Handbook of Telecommunications Economics. 2002 ; Nicolas Curien, Michel Gensollen. Economie des
au secteur des télécommunications par le régulateur ex post.
En France, la régulation ex post est ainsi placée sous l’égide de l’Autorité de la concur-rence, qui applique le droit général de la concurrence concernant l’examen et les éventuelles sanctions des pratiques d’ententes et d’abus de position dominante (Titre II du Code de commerce). La régulation ex ante du secteur des télécommunications est quant à elle opé-rée par l’Autorité de régulation des communications électroniques et de la poste (ARCEP), qui applique le droit spécifique au secteur des télécommunications (le Code des postes et des communications électroniques).
Quelques exemples de problématiques nécessitant une intervention hors-marché (ex ante ou ex post) peuvent être détaillés ci-dessous pour illustrer notre propos.
• Certains segments des réseaux de télécommunications, par exemple la boucle locale ou les câbles transcontinentaux, présentent une fonction de coût caractérisée par de puissants rendements croissants et par des coûts d’entrée élevés. Dans cette circons-tance, seule une ou quelques grandes entreprises peuvent coexister pour fournir en concurrence les services d’accès au réseau. Cette situation entraîne classiquement un risque de forte concentration du marché, ce qui peut, en soi, justifier parfois un be-soin de régulation ex ante. Dans certains cas, il arrive que seule une entreprise puisse exister à long terme, c’est par exemple le cas des boucles locales (fixes ou mobiles) dans les zones à forte dispersion de population (zones rurales). Le marché se re-trouve donc localement dans une situation classique de monopole naturel. Le réseau de l’opérateur unique joue alors le rôle d’un bottleneck ou d’une facilité essentielle pour tout opérateur désirant offrir des services de communication aux populations desservies par ce réseau. L’opérateur en monopole dispose alors d’un grand pouvoir de marché qui peut se traduire soit par le refus de donner l’accès à son réseau dont il se réservera l’exploitation, ce qui minimise les possibilités d’innovation et de diversi-fication des services, soit par un accès à son réseau ouvert à des opérateurs de service moyennant l’application de mark-up très élevés sur les prix, par rapport à ceux qui sont pratiqués dans les activités en concurrence. En raison des économies d’échelle, la structure monopolistique est cependant efficiente et reste préférable à une situation de « laissez-faire » supposée déboucher sur une concurrence entre plusieurs réseaux. Il importe donc que le marché soit régulé.
caractérisées par l’existence d’externalités positives. Les utilisateurs d’un réseau de télécommunications fixe ou mobile bénéficient par exemple des appels reçus des autres utilisateurs ainsi que du contenu accessible sur Internet. En l’absence d’interventions hors-marché, rien ne garantit cependant que ces externalités soient totalement in-ternalisées par les concurrents. Par ailleurs, lorsque les externalités positives sont croissantes avec les tailles des parcs d’utilisateurs d’un même réseau, elles procurent un avantage aux opérateurs disposant des parcs plus importants qui sont générale-ment ceux qui sont entrés en premier sur le marché : les consommateurs accordent une « prime » aux grands parcs, donc aux grands opérateurs, et ils auront alors ten-dance à rejoindre le plus grand opérateur et à engendrer par ce comportement une externalité encore plus grande du réseau choisi accélérant ainsi l’utilité des utilisa-teurs de ce réseau qui entraîne en retour une croissance rapide de son parc d’abonnés (l’effet « boule de neige »). L’existence de ces externalités positives justifie aussi le recours à une subvention de l’accès au réseau pour les consommateurs des zones à forte dispersion de la population par des mécanismes internes au secteur (subventions croisées entre différentes zones et/ou catégories de consommateurs) plutôt que par des mécanismes de subventions étatiques.
• Sur les marchés de télécommunications fixe ou mobile, les consommateurs supportent des coûts significatifs pour changer d’opérateur (« switching costs »). Les opérateurs peuvent agir stratégiquement sur ces coûts pour maintenir la « rigidité » du marché afin d’augmenter les prix au-dessus du niveau concurrentiel. Pour cette raison, les régulateurs peuvent adopter des mesures pour fluidifier le marché afin de minimiser les coûts de changement en imposant par exemple la portabilité des numéros, en limitant la durée des clauses d’engagement contractuel, etc.
• Le secteur des télécommunications se caractérise également par des innovations tech-nologiques fréquentes qui imposent parfois le renouvellement rapide des réseaux et des terminaux et crée une obsolescence accélérée des actifs tout en engendrant une forte incertitude sur les possibilités de rentabilisation des nouveaux actifs. Il peut alors arriver qu’un investissement ne paraisse pas rentable à court terme pour les opérateurs, alors que, du point de vue de la société et du bien-être général à long terme, le bénéfice associé est bien supérieur aux coûts des investissements à réaliser. La régulation peut donc inciter à l’investissement, par exemple en faisant participer au financement différents types d’acteurs d’un marché donné, tels que les opérateurs concurrents, les consommateurs, les fournisseurs de services sur le réseau, ou encore
les fonds publics.
• Pour finir, les réseaux de télécommunications sont le support de l’économie numé-rique, un domaine indispensable au développement économique, à la satisfaction de besoins multiples et plus généralement au fonctionnement de la société. L’accessibi-lité la plus large possible de l’accès à des réseaux de communications électroniques constitue alors un enjeu politique majeur. La régulation intègre donc dans ses objec-tifs des dimensions qui dépassent amplement les seuls mécanismes microéconomiques de bon fonctionnement des marchés. Ainsi, la loi française prévoit que le régulateur sectoriel en charge des communications électroniques, l’ARCEP, doive, au-delà de la concurrence, veiller à ce que son action contribue à promouvoir l’innovation, à développer l’emploi dans le secteur, à contribuer à l’aménagement numérique du territoire. Ces objectifs macroscopiques doivent parfois le conduire à intégrer dans ses décisions de régulation des mécanismes qui, selon les circonstances, modèrent ou durcissent l’intensité concurrentielle sur les marchés en cause.
Face à ces enjeux concrets, l’économie des télécommunications a joué un rôle important en mettant au point l’appareil théorique permettant de concevoir des dispositifs réglemen-taires efficaces. Ainsi, en dépit de quelques échecs ou déconvenues, la libéralisation et la privatisation du marché des télécommunications en Europe ont stimulé l’innovation et la croissance que ce soit au niveau des réseaux ou des services. L’efficience générale du sec-teur a ainsi considérablement augmenté : les prix ont significativement baissé tandis que les produits et les services se sont considérablement diversifiés et ont vu leur performance croître dans des proportions gigantesques2.
L’évolution technologique et économique du secteur des télécommunications fait ce-pendant sans cesse évoluer les problématiques susceptibles de préoccuper les régulateurs
ex ante et ex post, et requiert la mise au point de nouveaux cadres conceptuels
permet-tant d’y apporter des solutions efficaces. Depuis quelques années, trois nouveaux thèmes d’interrogation sont ainsi apparus dans le champ réglementaire :
• Face au développement de nouvelles technologies radicales dans les boucles locales (fibre optique, 3G et 4G dans les mobiles), comment les régulateurs doivent-ils stimu-2Le succès de la liberalization des telecommunications est ainsi relevé par la Commission européenne :
« In the two markets which were opened up to competition first (air transport and telecommunications), average prices have dropped substantially. » (http://ec.europa.eu/competition/liberalisation/ overview_en.html)
ler les investissements dans ces réseaux dits de nouvelle génération ? Comment inciter les opérateurs à déployer des solutions efficaces en termes de coûts ? Comment pré-server une concurrence active et loyale entre tous les acteurs lors de la transition des anciens réseaux vers les nouvelles technologies ?
Cette problématique apparaît comme un enjeu essentiel de politique publique, comme le souligne la Commission Européenne : « La connectivité à haut débit revêt une importance stratégique en Europe, pour la croissance et l’innovation dans tous les secteurs de l’économie ainsi que pour la cohésion sociale et territoriale. La stratégie Europe 2020 souligne l’importance du déploiement du haut débit, qui s’inscrit dans le cadre de la stratégie de croissance poursuivie par l’UE pour la prochaine décennie, et elle fixe des objectifs ambitieux pour le développement du haut débit (. . . ) Toute intervention de l’État doit limiter le plus possible le risque que l’aide supplante les investissements privés, dénature les incitations à réaliser des investissements com-merciaux et, en fin de compte, fausse la concurrence dans une mesure contraire à l’intérêt commun de l’Union européenne. »3
• Face à l’augmentation du pouvoir économique des grandes entreprises opérant sur le secteur des services en ligne (souvent qualifiés d’over the top), faut-il laisser-faire, corriger d’éventuels abus ex post ou aller jusqu’à proposer une régulation ex ante de nouveaux marchés ?
Quelques exemples récents de cas d’abus de position dominante concernant ces ac-teurs over the top, et notamment Google4, incitent en effet à s’interroger sur
l’oppor-tunité de mettre en oeuvre des instruments réglementaires les concernant.
• Avec la diversification des offres commerciales et des moyens de tarification des opé-rateurs de télécommunications, comment identifier les pratiques tarifaires potentiel-lement anticoncurrentielles ?
Selon le BEREC (Body of European Regulators of Electronic Communications), les stratégies tarifaires des opérateurs ont été identifiées comme d’importants obstacles à la migration des clients entre opérateurs. Plus spécifiquement, les régulateurs se sont récemment beaucoup intéressés aux pratiques de différentiation tarifaire
on-net/off-net quand les appels on-on-net/off-net (c’est-à-dire les appels entre deux abonnés du même
réseau) sont moins chers que les appels off-net (appels inter-réseaux).5
3EU Guidelines for the application of State aid rules in relation to the rapid deployment of broadband
networks (2013/C 25/01) 26 January 2013
4http://europa.eu/rapid/press-release_IP-10-1624_en.htm
L’objet de cette thèse est d’apporter des éléments de réflexion permettant d’esquisser des réponses à ces différentes questions, qui constituent autant de sujets centraux pour la régulation des télécommunications dans les années à venir. L’approche suivie sera princi-palement théorique et formalisée, mais en tâchant d’en tirer certains enseignements utiles pour l’instauration de mécanismes de régulation efficients du point de vue du bien-être collectif et du surplus des consommateurs.
Les trois thèmes seront abordés successivement : la question du déploiement optimal de la boucle locale fixe de nouvelle génération (réseau FTTH), l’appréhension du marché des services sur Internet à travers la théorie des marchés bifaces et enfin la différenciation tarifaire sur le marché des communications mobiles.
Le premier chapitre de la thèse est dédié au déploiement du réseau fixe de nouvelle génération en fibre optique. C’est une question d’actualité pressante car les réseaux sont en cours de déploiement partout en Europe et dans le monde. Face à un enjeu commun, on observe pourtant une multiplicité d’approches accompagnée d’une grande divergence d’opi-nions sur la nature de la régulation optimale, que ce soit dans les travaux théoriques menés sur cette question ou dans les décisions effectives prises par les autorités de régulation.
Ce premier chapitre se fonde sur la théorie du monopole naturel et des incitations à l’investissement qu’il convient d’adopter dans ce contexte. Nous y étudions les différents aspects de la transition d’une ancienne technologie (boucle locale cuivre) vers la nou-velle technologie (boucle locale fibre). Une synthèse des travaux théoriques existants et de leurs principaux résultats sera tout d’abord réalisée, de même qu’une analyse comparative internationale des pratiques de régulation. Nous construirons ensuite un modèle technico-économique de déploiement du réseau de boucle locale en fibre optique pour couvrir l’en-semble du territoire métropolitain français afin de comparer les résultats des différentes approches de régulation possibles. Des conclusions seront finalement tirées quant au dis-positif le plus avantageux en termes de vitesse et d’efficacité du déploiement ainsi que de maximisation du bien-être collectif et du surplus des consommateurs.
Le deuxième chapitre applique la théorie de marchés bifaces au domaine des commu-nications électroniques.
Le concept de « marché biface » a été explicitement introduit dans la théorie de l’éco-nomie industrielle au début des années 2000. Depuis la création du concept, l’étude des
marchés bifaces a suscité une production théorique très riche et très fructueuse. Les résul-tats de la théorie des marchés bifaces ont en effet dépassé le pur champ de la recherche économique pour être appliqués par des autorités de la concurrence lors de cas concrets de contentieux ou d’opérations de concentration notamment dans le domaine de commu-nications électroniques. On peut citer, pour les cas les plus récents, une décision de la Commission européenne concernant le rachat par Google de DoubleClick6 et une décision
sur la prise de contrôle exclusif par le groupe TF1 du groupe AB sur le marché de média7.
La Commission européenne recommande même désormais de prendre en compte que les marchés de communications électroniques sont souvent de nature biface8.
La théorie de marchés bifaces permet de trouver une nouvelle interprétation au com-portement des agents sur les marchés des télécommunications, puis d’expliquer pourquoi et dans quels cas la régulation de ces marchés est nécessaire. Ce chapitre traitera tout d’abord de la régulation concurrentielle ex post des marchés bifaces, s’agissant des problématiques de fusions, de pratiques unilatérales et de pratiques coordonnées. Dans un deuxième temps, une étude de cas concernant une affaire de tarification asymétrique sera proposée. Enfin, un modèle de discrimination par les prix sur des marchés bifaces sera proposé avec comme objectif de révéler les facteurs qui déterminent le caractère favorable ou défavorable de l’impact de la discrimination sur le surplus des consommateurs. Ce modèle sera utilisé pour tirer des conclusions pratiques utiles à la régulation des services en ligne.
Le troisième chapitre étudie quant à lui la question de l’impact de la différenciation tarifaire sur le marché des communications mobiles.
Les pratiques de différenciation tarifaire entre les appels on-net (intra-réseau) et
off-net (inter-réseaux) sont actuellement la source de plusieurs contentieux concurrentiels.
En 2009, l’Autorité de la concurrence a sanctionné Orange Caraïbe et France Télécom à hauteur de 63 millions d’euros pour avoir freiné le développement de la concurrence en mettant en place diverses pratiques abusives, dont une pratique de différenciation tarifaire
6Commission decision of 11/03/2008 declaring a concentration to be compatible with the common
market and the functioning of the EEA Agreement (Case No COMP/M.4731 - Google/ DoubleClick).
7 Autorité de la concurrence. Décision n˚ 10-DCC-11 du 26 janvier 2010 relative à la prise de contrôle
exclusif par le groupe TF1 de la société NT1 et Monte-Carlo Participations (groupe AB).
8Commission Recommendation of 17 December 2007 on relevant product and service markets
wi-thin the electronic communications sector susceptible to ex ante regulation in accordance with Directive 2002/21/EC of the European Parliament and of the Council on a common regulatory framework for electronic communications networks and services. C(2007) 5406. 2007/879/EC
entre les appels on-net et off-net 9. Par ailleurs, en 2009, à La Réunion et à Mayotte,
l’opérateur mobile français SRR a été contraint par l’Autorité de la concurrence, à titre conservatoire, de s’assurer que l’écart entre ses tarifs on-net et off-net ne dépasse pas l’écart entre les coûts correspondants 10. En France métropolitaine, un cas similaire a été
jugé par l’Autorité de la concurrence et fait actuellement l’objet d’un recours devant la Cour d’appel de Paris 11.
Sur le même sujet, en juillet 2007, le troisième opérateur mobile allemand KPN a déposé une plainte auprès de la Commission européenne contre la différenciation on-net/off-net opérée par T-mobile et Vodafone. Bien que le Federal Cartel Office n’ait finalement pas donné suite à cette action, des plaintes semblables ont été portées dans d’autres pays, notamment en Belgique12, en Autriche, en Italie et en Nouvelle Zélande13.
Un grand nombre de travaux théoriques porte sur la concurrence entre réseaux de com-munication électronique. Soit parce qu’ils reposaient sur des hypothèses très particulières, soit au contraire parce qu’ils utilisaient un cadre de modélisation très général et donc très complexe, les modèles développés jusqu’ici n’ont pas permis de mener une analyse exhaustive de l’impact d’une différenciation on-net/off-net sur le bien-être social et sur ses composantes.
Le modèle théorique du troisième chapitre s’attache précisément à cet objectif en re-présentant une concurrence entre plusieurs opérateurs de téléphonie mobile dans le cadre de laquelle les opérateurs sont capables de différencier le prix d’un appel en fonction de sa destination. Le modèle est ensuite calibré sur la base de l’exemple du marché français des services de téléphonie mobile en 2003. Une simulation numérique permet finalement d’étu-9 Autorité de la concurrence. Décision n˚ 09-D-36 du 9 décembre 2009 relative à des pratiques mises
en oeuvre par Orange Caraïbe et France Télécom sur différents marchés de services de communications électroniques dans les départements de la Martinique, de la Guadeloupe et de la Guyane.
10Autorité de la concurrence. Décision n˚ 09-MC-02 du 16 septembre 2009 relative aux saisines au fond
et aux demandes de mesures conservatoires présentées par les sociétés Orange Réunion, Orange Mayotte et Outremer Télécom concernant des pratiques mises en oeuvre par la société SRR dans le secteur de la téléphonie mobile à La Réunion et à Mayotte.
11Autorité de la concurrence. Décision n˚ 12-D-24 du 13 décembre 2012 relative à des pratiques mises
en oeuvre dans le secteur de la téléphonie mobile à destination de la clientèle résidentielle en France métropolitaine.
12Conseil de la concurrence. Décision n˚ 2009- P/K-10 du 26 mai 2009. Affaire CONC-P/K-05/0065 :
Base/BMB.
13cf. J. Haucap et U. Heimeshoff. Consumer behavior towards on-net/off-net price differentiation. Dans :
dier l’impact de la différenciation sur tous les participants du marché et sur le bien-être collectif.
Part I
Regulating transition from old to
new infrastructure in fixed
Introduction
The fixed telecommunications industry possesses characteristics that make pure competi-tion inefficient and may lead to market failure; the standard competitive models cannot be applied to this industry and centralised regulation may turn out to be necessary:
• The cost function is characterised by the increasing scale effect which may lead to natural monopoly.
• The positive externality effect is generated between the customers.
• Telecommunications services have a positive effect on the global economic and social development on the macroeconomic level.
All these characteristics call for a special treatment of the industry: the government should ensure the broad availability of the service and the market’s efficiency. The objective of this work is to study economic features of the telecommunications industry and to propose a policy that takes them into account; the specific case of the next generation fixed network is used. The question of its deployment is of importance today. Indeed, telecommunication operators worldwide are currently building their next generation access networks (NGN) that will allow to significantly increase the Internet connection speed at fixed locations. The broadly adopted technology is the fibre to the home (FTTH) technology; it stipulates usage of optical fibre cables instead of copper cables in the access network, where fibre reaches the boundary of the building. Its deployment is one of important objectives set by the European Commission14, and most European countries have developed a plan for very
fast broadband deployment.
14A Digital Agenda for Europe. Communication from the Commission to the European Parliament, the
Council, the European Economic and Social Committee and the Committee of the Regions. Brussels, 19 May 2010 COM(2010) 245.
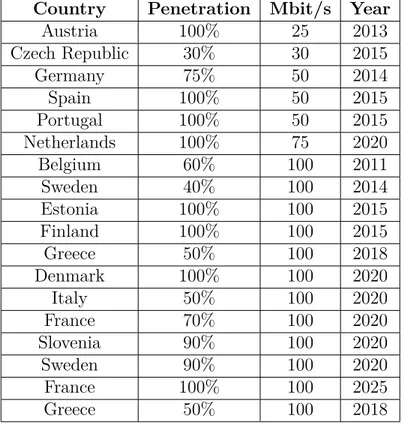
Country Penetration Mbit/s Year Austria 100% 25 2013 Czech Republic 30% 30 2015 Germany 75% 50 2014 Spain 100% 50 2015 Portugal 100% 50 2015 Netherlands 100% 75 2020 Belgium 60% 100 2011 Sweden 40% 100 2014 Estonia 100% 100 2015 Finland 100% 100 2015 Greece 50% 100 2018 Denmark 100% 100 2020 Italy 50% 100 2020 France 70% 100 2020 Slovenia 90% 100 2020 Sweden 90% 100 2020 France 100% 100 2025 Greece 50% 100 2018
Table 0.1: National plans objectives of NGN deployment in Europe: temporal horizon, speed and coverage.
Source: BEREC, Next Generation Access - Collection of factual information and new issues of NGA roll-out - February 2011
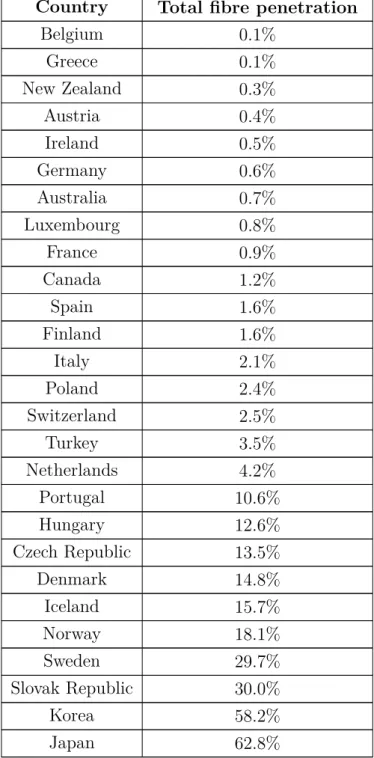
It may be difficult to accomplish these objectives because Europe is late in its fibre network adoption, especially compared to other countries. In Asia, and particularly in South Korea and Japan, FTTH has supplanted the DSL, with 58% and 62% correspond-ingly. North America and Europe are a step back: very fast broadband deployment is not a priority in the USA and most European countries have manifested only a late interest for FTTH.
Country Total fibre penetration Belgium 0.1% Greece 0.1% New Zealand 0.3% Austria 0.4% Ireland 0.5% Germany 0.6% Australia 0.7% Luxembourg 0.8% France 0.9% Canada 1.2% Spain 1.6% Finland 1.6% Italy 2.1% Poland 2.4% Switzerland 2.5% Turkey 3.5% Netherlands 4.2% Portugal 10.6% Hungary 12.6% Czech Republic 13.5% Denmark 14.8% Iceland 15.7% Norway 18.1% Sweden 29.7% Slovak Republic 30.0% Korea 58.2% Japan 62.8%
Table 0.2: Percentage of fibre connections in total broadband among countries reporting fibre subscribers, December 2011.
Note: Includes fibre-to-the-home (FTTH) and fibre-to-the-building (FTTB or apartment LAN) connections. Source: OECD Broadband Portal
These numbers on penetration levels show that in Europe there is a need for a more efficient regulation of the NGN deployment: the regulation pattern should ensure a quick transition from the old copper network to the optical fibre one. Determined at the early stage, such pattern will provide dynamic consistency and policy commitment in future; also, it will allow to avoid future errors.
Regulators, industry participants and economic theorists are actively discussing which industry organisation would promote the quickest spread of fibre technology to the benefit of final users. However, as of today, there is no consensus on how the fibre should be coordinateded, and a wide array of policies is used by regulators in Europe and worldwide. Solutions proposed by different authors diverge considerably and there does not exist a unique answer. Often authors do not give precise answer on how the fibre network should be regulated, referring to different conditions on each individual territory. For example, Atkinson (2009) claims that the optimal market structure on each market will depend on specific circumstances such as density, availability and cost of existing infrastructure, etc. A similar conclusion was made by Soria and Hernández-Gil (2011), who claim that a market analysis should be performed on each sub-national territory separately with the objective of determining the optimal policy on this particular territory.
Since economic literature does not give an answer to the question of the optimal reg-ulation strategy, the issue needs to be further developed. The objective of this work is to study the impact of various strategies of FTTH regulation and to conclude on their efficiency.
Telecommunications industry cost structure has many particular characteristics and purely theoretic modelling cannot account for all of them. That is why it was chosen to develop a more practice-oriented numerical model, taking into consideration the current level of technical development and socio-demographic factors.
We will proceed as follows. Chapter 1 deals with natural monopoly characteristics of the fixed telecommunications market and briefly discusses different approaches to regulating next generation networks. In chapter 2, we present our numerical model of fibre deployment and make simulations of two different regulatory policies. Based on these numerical results, on the theoretical analysis and on real-life examples from a European benchmark, chapter
3 compares different approaches to the regulation of the fibre network. It also studies different approaches to pricing regulation of access to infrastructure. The discussion allows to reveal regulation approaches beneficial to the total welfare and to the promotion of competition on the optical fibre market. The last chapter concludes.
1
Review of approaches to
regulating next generation networks
1.1
Local loop as a natural monopoly
The concept of natural monopoly was developed in its present form in the 1970s.1 A natural
monopoly appears where the technology or the character of service are such that the customer can be served at a lesser cost by a single firm than by several firms. This property of the cost function of a typical firm is referred to as subadditivity. Suppose q – the output vector, C(q) – the cost function. A single firm is less costly to the market if it holds that
C(q) < C(q1) + · · · + C(qk), where q = q1+ · · · + qk.
The market may be characterised as a natural monopoly if the inequality holds for any decompositions of q.
Economies of scale, defined as average cost declining with the output, are often present on such market:
C(q) q >
C(q + ∆q) q + ∆q .
For a single-product firm, if decreasing returns to scale apply for all the output val-ues, it implies that the cost function is always subadditive and the market is a natural monopoly. However, economies of scale are not a necessary condition of subbaditivity. For a multiproduct firm, the scale effect is neither necessary nor sufficient for subadditivity, as
have been shown by Baumol (1977).
Let us consider the case of the telecommunications industry and discuss to which extent it may be categorised as a natural monopoly.
As mentioned by Sharkey (1983), there is a need to delineate the market boundaries that separate natural monopoly sector from a closely related competitive sector of a given market. In this context, it is appropriate to divide the elements of the fixed telecommu-nications network into two parts: the access network, connecting a customer telephone termination point (the point at which a telephone connection reaches the customer) to a local telephone exchange, and the core network, providing the service to the exchange. The access network is characterised by stronger scale effect than the core network; the properties of the access network are closer to the natural monopoly. At the same time, once the access network is built, several operators may have access to it on a wholesale level. While the wholesale provision is a natural monopoly, the retail provision is closer to a competitive structure. Below we concentrate our attention solely on the access network, which constitutes a bigger part of the total cost.
Let us consider an operator’s cost function C(q), where the output q is measured by the number of customers connected by the operator. For an operator who has already provided a fibre network connection for a part of customers in an area, it wouldn’t be very expensive to provide connection to remaining customers in the same area. For a new operator who penetrates the area, the cost of connecting an additional customer is much higher, since all the costs related to connecting the area will have to be incurred when the first customer is connected. Both incremental and average costs are higher for a new entrant than for an incumbent:
dC
dq (q + 1) < dC
dq(q), and C(q + 1)
q + 1 < C(1) (economies of scale apply).
This rule can be applied to an area of closely located buildings, for example an agglom-eration. It is not necessarily true for the whole national territory, especially if a country has a large territory with densely populated areas separated by less populated areas. To connect a new area, which is presented by a city and its agglomeration, an operator needs
to make significant investments irrespective of operator’s presence in another area. There may be an economy in the cost of the core network, but this cost is relatively small com-pared to the cost of the access network. In this case the average cost function may have the form of a ladder with a qjump in the average cost value when a new area is connected. The scale effect on the fixed network is stronger than the one on the mobile network and closer to that of the electricity network. While on the mobile network the infrastructure competition is promoted in the Member States, on the electricity network the infrastruc-ture sharing is maintained.2 It means that the principles of regulating mobile and fixed
telecommunications should not be the same.
Sharkey (1983) gives the example of the fixed telecommunications industry dynamics in the USA to show the natural tendency to consolidation as a sign of natural monopoly. The industry was gradually consolidated and became dominated by AT&T, which lasted before the regulatory intervention in 1960s.
It can be concluded that due to its techno-economic conditions, the wholesale access market in fixed telecommunications is close to natural monopoly, and this property is especially strong in less dense areas.
Let us consider possible equilibrium configurations on a market with a sub-additive cost function. In the classical model, if the entry is free, the long-term equilibrium will be established in the cross-point between demand and long-run average costs (P1, Q1) and
only one firm will serve the market. Indeed, for any price P < P1 and Q > Q1, the profit
would be negative. At the same time, if P < P1 then another firm may enter the market,
drive the incumbent out of the market, and obtain a positive profit with a higher price. The only production level that precludes profitable entry by another firm is P = P1 and
Q = Q1 (cf. Schmalensee (1989)).
2 Lebourges (2011) compares fibre network to mobile network to prove that the absence of access
regulation is more efficient in both industries. Still, cost characteristics differ significantly between these two types of technologies, with fibre network being closer to natural monopoly.
Figure 1.1: Market equilibrium in the case of natural monopoly
However, such stable equilibrium may be rarely found in practice. Even if a market is most efficiently served by only one firm, it does not mean that in equilibrium this efficient solution is achieved. An inefficient entry may occur because of a market failure. Unrestricted entry may lead to the destructive rivalry: it will bring down the price to the marginal cost, the fixed cost will not be covered, and the firms will not find it profitable to invest in the industry.
In the telecommunications industry an inefficient entry may lead to disincentives to invest in the new infrastructure based on the optical fibre. An inefficient entry may occur in the telecommunications industry because it is different from the classical theoretical model in several aspects such as switching costs, imperfect information, the stepped form of the cost curve, and non-negligible time of deployment.
The average cost of connecting a customer is significantly higher in less populated areas, that is why a risk of cream-skimming occurs. Competitors will enter only on the low-cost market segments and the price on these segments will decrease. That can be observed on the French market. As a result, the incumbent will not be able to use the gain earned in most profitable areas to decrease prices in less profitable areas, and may even cease to save it.
On a telecommunications market, even though it possesses natural monopoly charac-teristics, inefficient entry may happen due to sunk costs and to the dynamic process of equilibrium formation. The first operator who started to deploy the network cannot im-mediately serve all the customers; such operator is not protected against inefficient entry by another operator. Two operators may also start to deploy at the same time, so that
their average cost levels will be close for the same coverage. In the classical model, the monopoly is already present on the market and this dynamic aspect is not accounted for. Panzar and Willig (1977) construct a theoretical example of the case where the natural monopoly cannot protect itself against an entry because the average cost is not constantly decreasing with the output but is increasing in certain intervals. As a result of such entry, the market is served by more than one firm even though it is inefficient from the social viewpoint. Inefficient entry may lead to ‘competitive destruction’, where there is no sustainable equilibrium. In the telecommunications industry average cost may first decrease and then increase due to the network congestion, when as new customers join, it is necessary to expand the network’s capacity. The average cost also increases due to an additional fixed cost when a new building or a new area is connected.
1.2
Main approaches to the fibre deployment
regula-tion
There exist two main mechanisms to promote competition on a fixed telecommunications market: infrastructure-based and service-based competition. In the first case, each provider owns its network while in the second case providers use wholesale access to a common network. Unbundled access allows operators who do not possess their own network to provide services using the existing copper or fibre network of other operators. Two main technical approaches are possible:
1. passive unbundled access does not include active electronic equipment (it is referred to as ‘black fibre’ on NGN);
2. active or virtual unbundled access includes active electronic equipment.
Regulator may impose access obligations on the incumbent or another operator who owns the next generation network.
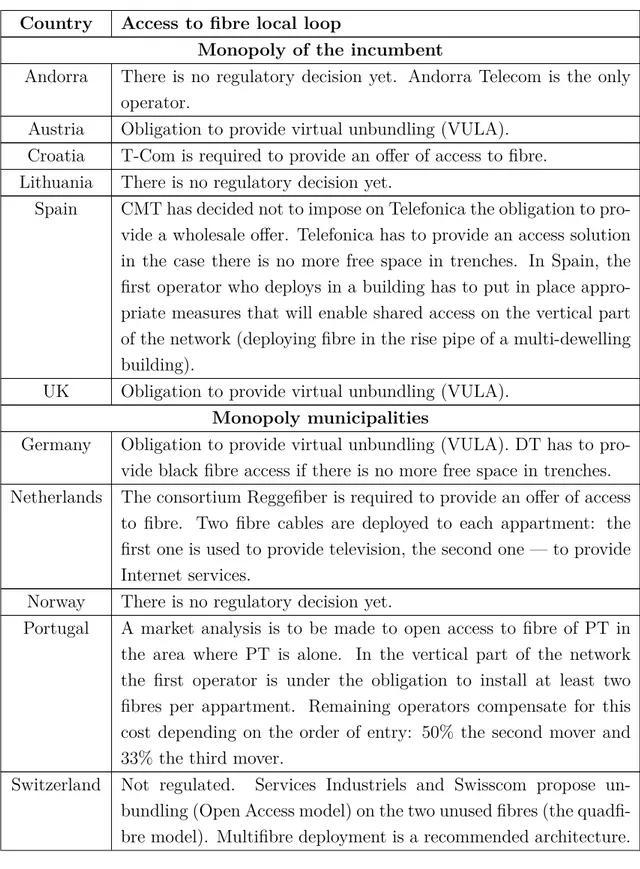
The table below presents solutions adopted in practice by different European regulators. In the case of monopoly, the unique network may be owned either by one operator, usually the incumbent, or by a consortium of several structures.
Table 1.1: Benchmark of fibre access regulation.
Country Access to fibre local loop
Monopoly of the incumbent
Andorra There is no regulatory decision yet. Andorra Telecom is the only operator.
Austria Obligation to provide virtual unbundling (VULA). Croatia T-Com is required to provide an offer of access to fibre. Lithuania There is no regulatory decision yet.
Spain CMT has decided not to impose on Telefonica the obligation to pro-vide a wholesale offer. Telefonica has to propro-vide an access solution in the case there is no more free space in trenches. In Spain, the first operator who deploys in a building has to put in place appro-priate measures that will enable shared access on the vertical part of the network (deploying fibre in the rise pipe of a multi-dewelling building).
UK Obligation to provide virtual unbundling (VULA).
Monopoly municipalities
Germany Obligation to provide virtual unbundling (VULA). DT has to pro-vide black fibre access if there is no more free space in trenches. Netherlands The consortium Reggefiber is required to provide an offer of access
to fibre. Two fibre cables are deployed to each appartment: the first one is used to provide television, the second one — to provide Internet services.
Norway There is no regulatory decision yet.
Portugal A market analysis is to be made to open access to fibre of PT in the area where PT is alone. In the vertical part of the network the first operator is under the obligation to install at least two fibres per appartment. Remaining operators compensate for this cost depending on the order of entry: 50% the second mover and 33% the third mover.
Switzerland Not regulated. Services Industriels and Swisscom propose un-bundling (Open Access model) on the two unused fibres (the quadfi-bre model). Multifiquadfi-bre deployment is a recommended architecture.
Multiple deployments
Italy There is no regulatory decision yet. Slovakia There is no regulatory decision yet.
Slovenia APEK was going to impose on Telekom Slovenije an obligation to provide fibre unbundling.
Sweden 94% of municipalities propose fibre unbundling. Since May 2012: requirement for the incumbent to probide unbundling (black fibre on the access network).
The numerical model of the next section allows to simulate different methods of fibre deployment regulation, monopoly or multiple deployments, and to compare their impact on the final deployment cost.
2
Model
In order to compare the effect of different policy approaches, we construct a cost model of the fibre local loop in France: it allows to estimate the cost of each element of the local loop network as well as the total cost, and to check how the result changes in particular with the number of operators, technology and WACC. It also allows to numerically simulate geographically averaged price of the wholesale access in France, and to estimate the retail price increase associated with the transfer from copper to fibre.
The data and assumptions that we use include: • cost of different network elements,
• network configuration parameters, in particular equipment capacity and cable length, • for each of 36,000 municipalities, geographic and demographic data such as number
of buildings and households, road length, etc. Details can be found in Appendix A. Data.
The cost of network includes the following categories: • capital costs of a passive fibre network,
• operating costs including maintenance cost and access payment for civil engineering of France Telecom,
• a part of common costs allocated to unbundled access service.
Ducts are included not in capital costs but in operating costs, since the existing civil engineering is used.
2.1
Cost a function of operators number
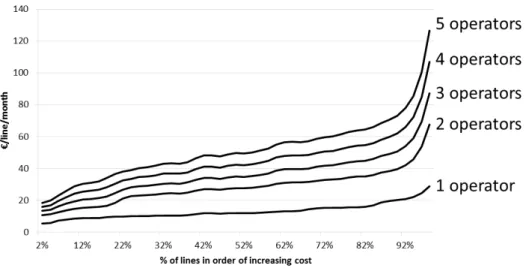
We will show that the cost function is characterized by a significant scale effect, as the number of operators varies.
The following graph shows the access cost per line and per month as a number of operators. When calculating annual depreciation, we take a WACC of 8.5%. In the case of several operators, we add a risk premium of 5% to compensate for competition risk. The lifetime of cables is taken equal to 40 years.
Figure 2.1: Cost as a function of density in unregulated competition, e/line/month
The geographically averaged cost is e12.94 per line per month in the monopoly and e28.10 per line per month in duopoly, or 217% higher. The increase is due to infrastructure duplication and a risk premium.
The numbers show that scale effects are significant. Hence, fibre local loop represents a natural monopoly.
2.2
Comparison of regulatory scenarios
1. regulated monopoly with wholesale access (the regulator chooses only one operator who constructs the network and the wholesale access is imposed at the cost-based price);
2. regulation currently observed in France (the regulator does not limit the number of operators).
We compare these scenarios with respect to the average access cost level as a main com-parison criterion, together with cost allocation per zone, access price and retail price.
2.2.1
Regulated monopoly with wholesale access
In this section, we estimate fibre local loop costs and corresponding prices that would be established if the regulator have imposed the monopoly on the fibre deployment. Using the model described above, we calculate monthly cost per line as a function of density.
To ensure service-based competition, the regulator needs to choose the network con-figuration that would simplify the wholesale access. There exist two general types of fibre network structure: the PON technology which consists in deploying in certain parts of the horizontal network the only fibre that groups multiple subscribers and the point-to-point technology which consists in deploying at least one fibre per subscriber within the local loop. The point-to-point technology is the more costly one, but it is more advantageous in prospect. First, it is better able to accommodate future demand for a higher speed access since there is no capacity sharing on the local loop level. Second, and very impor-tant in our context, it makes it simpler to unbundle. PON technology allows for virtual unbundling, but this type of unbundling leaves less freedom to service providers and leads to less innovation. The point-to-point technology is more suitable in the current scenario. To simplify the wholesale access, a big size of ODF (Optical fibre Distribution Frame) has been set. The ODF capacity is equal to 20,000 lines in Paris and 10,000 lines outside Paris.1 This high ODF capacity allows for a viable competition on the core network level:
it becomes profitable for operators to connect to an ODF where there is a sufficient number of potential customers.
1The number of 10,000 was used in a study by ARCEP (French telecommunications regulator). Etude
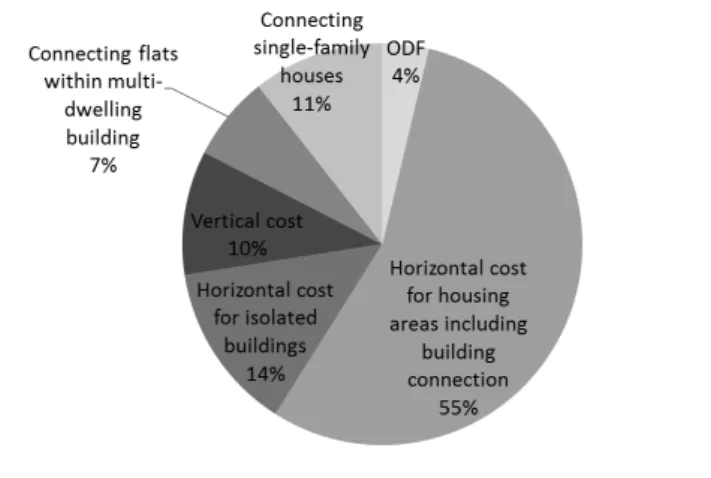
First, let us study the cost structure yielded by the described regulation approach. The fixed costs constitute about 71% of the total costs. The figure below shows the share of each component of these fixed costs. Horizontal cost (cost of the network between an ODF and a building entry) has the greatest weight which is especially significant in non-dense areas. These costs are not subject to technical progress and mainly consist of labour force and cable price.
Figure 2.2: Fixed cost structure in regulated monopoly, %
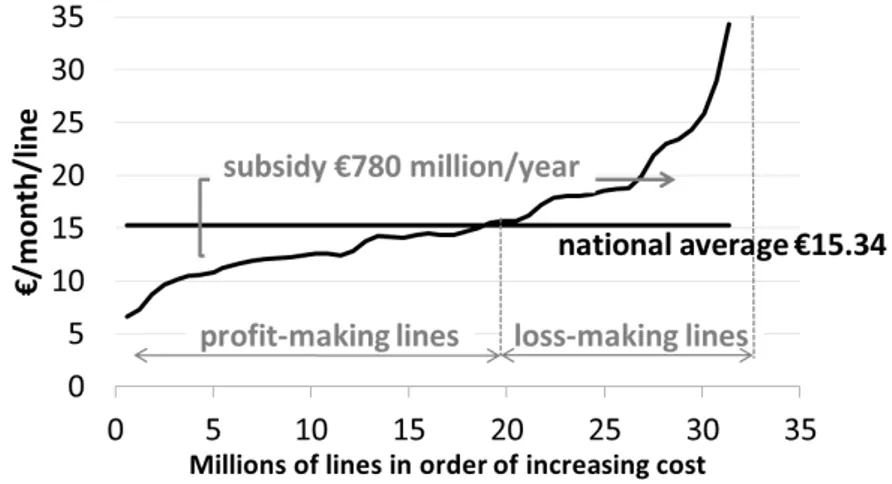
The total cost was divided by 32 million of lines to obtain the national average. Then, all the lines were classified according to the density of the area they belong to. Each community of 36,000 municipalities was rated among one of 50 density categories. For each density interval, the absolute value of monthly cost is given, including CAPEX and OPEX. In Figure 2.3 communities are ordered according to their density, from more dense to less dense.
Figure 2.3: Cost as a function of density,e/line/month
The average cost is e15.34 per month per line. If the regulator fixes this single level of access price to fibre on the whole national territory, then the over-profit in dense areas can be redistributed to less dense areas through a funding mechanism so that to exactly compensate operator deploying the network in a particular area for the costs incurred.
This scheme of subsidizing uneconomic areas is already used in the French copper network. In fibre network, the subsidy will be equal to e782 million per year. 60% of economic lines will subsidise 40% of uneconomic lines.
To estimate the average retail price, we assume that the absolute value of difference between access price and retail price is the same for fibre and copper technologies. This difference includes essentially commercial cost, as well as cost of active equipment and profit margin, and there is no reason to assume that this difference will be higher in fibre than in copper. The value added tax is of 19.6%. Today in France, the access price to copper local loop is ate9 per line per month. The currently observed average subscription price in France is e32 per line per month including tax.
When passing from copper to fibre, the retail monthly connection price will rise from e32 to e39 or approximately 20%. Even though this calculation was made only for France, the retail price increase will not be excessive in other European countries as well. The internet connection price in France is already rather low compared to average European
level, so the gap between copper and fibre does not tend to be greater.
2.2.2
Market configuration currently observed in France
In this section we consider the case where the number of operators is not regulated. As observed in France, it leads to well-developed infrastructure competition in dense areas and no competition in non-dense areas:
• Indeed, in highly profitable dense areas several competing operators will develop their fibre networks in parallel.2 In these areas the competition is infrastructure-based and
not service-based; that is why when calculating the corresponding network cost we choose the PON technology instead of the more costly point-to-point technology; this technology would be used by a rational operator.
• In non-dense areas, on the contrary, only one network will be deployed since dupli-cation would be unprofitable and a rational operator would not constuct a network in the areas where it already exists. But given that the monopoly is not protected by regulation, the investor will need to be compensated for the risk by a higher WACC, that is why in non-dense areas the cost of competition will be higher than in regulated monopoly. The technology used in non-dense areas is point-to-point: the obligation of unbundling makes it rational to use point-to-point architecture to economize on expensive active equipment.
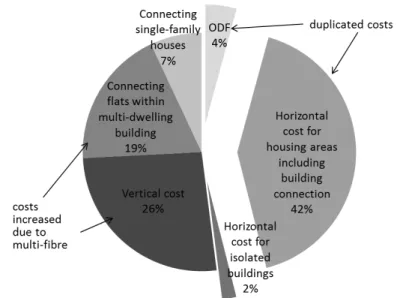
First, let us consider more in details how the cost is calculated in dense areas. Since several networks are constructed, a part of infrastructure needs to be duplicated: ODF buildings, ODF and horizontal cost (study, supply and laying) including connecting build-ings. These three categories of costs constituted 42% of fixed cost and 30% of total cost in monopoly in dense areas (see figure below). The remaining infrastructure elements are mutualised among operators. The vertical cost and cost of connecting flats within building increase by 15-30% because of the need to deploy several fibre lines.
2 In France, dense areas as defined by ARCEP (the French telecommunications regulator) include 148
Figure 2.4: Fixed cost structure in dense areas in monopoly
The technology factor partially compensates for the cost increase following the duplica-tion: PON technology is less expensive than the point-to-point one. Horizontal cost (study, supply and laying) excluding connecting buildings is higher by 20% in point-to-point.
When several parallel networks are active, the variable costs increase as well: a larger infrastructure requires more operating costs, and the cable maintenance cost is multiplied by the number of operators in dense areas. The common cost increases together with the other cost categories.
The cost that remains stable is the duct access payment. We suppose that the total price paid by all the operators for the access to France Telecom’s civil works is such that it strictly compensates its cost. For example, each of two competing operators has to pay twice less than a monopoly operator. That is why the total price paid by all the operators does not change with their number.
Now, let us consider cost calculation in non-dense areas, where only one fibre network is built. Most likely this network will be built by the incumbent who already owns copper infrastructure, and so will be in a better position to construct a next generation network. In France ARCEP has obliged operators to construct a network of point-to-point type in
non-dense areas.
Since costs are not duplicated and the point-to-point technology is used, the investment to be made is the same as in the regulated monopoly. However, since there is no obligation to remove copper, the investor faces a higher risk than in the case of regulation. In more expensive non-dense areas, if the investor does not arrive to attract sufficient demand for fibre, the capital expenses are not compensated. Where justified, the European Commis-sion recommends including a risk premium when setting access prices to the unbundled fibre loop. That is why in the base model we suppose that in non-dense areas WACC in the non-regulated scenario is higher than WACC in the regulated scenario. Hence, we take WACC=10.40% for the first case and WACC=15.40% for the second case to calculate the capital cost.
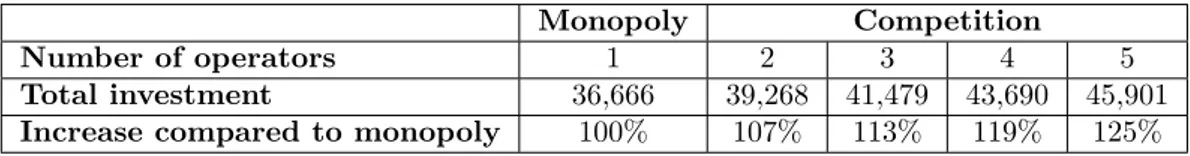
The total investment needed to build a nationwide network significantly increases with the number of operators: by 13% for 3 operators, which is equivalent to a social welfare loss ofe4.8 milliard.
Monopoly Competition
Number of operators 1 2 3 4 5
Total investment 36,666 39,268 41,479 43,690 45,901
Increase compared to monopoly 100% 107% 113% 119% 125%
Table 2.1: Total investment as a function of number of operators, emillion
The cost in competition is higher than the cost in monopoly because of two effects: infrastructure duplication in dense areas and a higher WACC in non-dense areas. If we suppose that the access price is cost-oriented, this price in competition is strictly higher than the price in monopoly. Moreover, access price grows higher as the number of alter-native infrastructures increases.
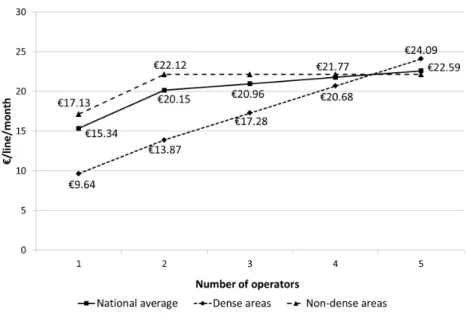
The figure below traces the average cost as the number of competitors increases. The increase in cost in dense areas is explained by duplication. The average cost of a line situated in non-dense areas is 77% higher than the cost of a line in a dense area in monopoly, and 59% in duopoly. This gap is lower in duopoly since the total cost in dense areas is higher because of duplication.
The plain line summarizes the two dotted lines and demonstrates how the average national access price changes as the number of competitors increases. This cost increases by 31% for 2 competitors and by 37% for 3 competitors compared to monopoly.
Figure 2.5: Average cost depending on number of operators, e/line/month
The effect of duplication on national price depends significantly on the size of high density areas. In countries with high average density the duplication will take place on a great surface, and its negative effect will be particularly significant.
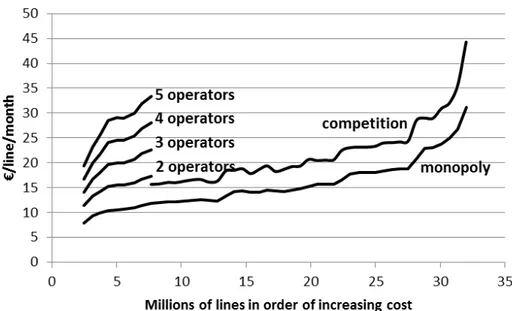
Figure below demonstrates how the cost function changes with the number of competi-tors. Because of duplication, the cost of construction may become higher in dense areas than in non-dense areas. It will lead to absurd local disruptions in retail price. When 5 competitors are building their networks in parallel, the average cost of one line in dense areas is even higher than the average cost of one line in non-dense areas: e24.09 vs. e22.59.
Figure 2.6: Cost as a function of density range, depending on the number of competing operators
2.3
Sensitivity analysis
In this section we check the robustness of our results by varying the most significant assumptions.
2.3.1
Extra cost of point-to-point horizontal network
There is no consensus on how more expensive a point-to-point network is compared to a PON network. Several studies suggest that the costs are almost the same, while others claim that point-to-point CAPEX is 40% higher than that of PON (see Appendix A. Data for more details). We study how this assumption changes our results.
In the base model we have assumed that one cost category increases in point-to-point: horizontal cost for apartment/office buildings excluding connecting buildings. It represents
the greatest extra-cost when several fibre cables are installed instead of only one.
We have considered alternative scenarios, assuming that the horizontal cost excluding connecting buildings increases by 0%, 10%, 20% (as in the base case), 30% and 40%.
Additional horizontal cost in point-to-point
Nb operators 0% 10% 20% 30% 40% 1 14.32 14.83 15.34 15.85 16.36 2 18.82 19.49 20.15 20.82 21.48 3 19.63 20.30 20.96 21.63 22.29 4 20.44 21.11 21.77 22.44 23.10 5 21.26 21.92 22.59 23.25 23.92
Table 2.2: Sensitivity of average access cost with respect to extra cost of point-to-point horizontal network, e/line/month
The average access cost increases/decreases by less than e1.02 compared to the base case. The total welfare gain thanks to implementing the proposed policy compared to the current French market structure (3 operators) varies between e2,039 million and e2,277 million per year, or at maximum by 12%.
When there is no additional cost of point-to-point, the total investment in monopoly is equal toe33.4 milliard versus e36.6 milliard in the base model. The cost both in monopoly and in competition slightly decrease, the gap between monopoly and competition increases.
2.3.2
Risk premium parameter
A risk premium is added to WACC in non-dense areas with potential competition. In the base model it is 5%, as recommended by ARCEP. In this section we estimate costs with alternative risk premium values.
If no risk premium is granted to operators in non-dense areas, it significantly changes the access price in those areas. In fact, the price becomes the same irrespective of number of operators: see figure below. The plain line corresponds to the benchmark scenario where the gap is significant between monopoly cost and duopoly cost in non-dense areas. The
dotted line corresponds to the alternative scenario where the same WACC is taken for both monopoly and oligopoly.
Figure 2.7: Average cost in non-dense areas depending on the number of operators, e/line/month
As a result, the national average price in competition is only insignificantly higher compared to monopoly as shown below.