UNIVERSITÉ DE MONTRÉAL
FAULT PROGNOSTICS USING LOGICAL ANALYSIS OF DATA AND
NON-PARAMETRIC RELIABILITY ESTIMATION METHODS
AHMED RAGAB ANWAR RAGAB
DÉPARTEMENT DE MATHÉMATIQUES ET DE GENIE INDUSTRIEL ÉCOLE POLYTECHNIQUE DE MONTRÉAL
THÈSE PRÉSENTÉE EN VUE DE L’OBTENTION DU DIPLÔME DE PHILOSOPHIAE DOCTOR
(GÉNIE INDUSTRIEL) DECEMBRE 2014
UNIVERSITÉ DE MONTRÉAL
ÉCOLE POLYTECHNIQUE DE MONTRÉAL
Cette thèse intitulée :
FAULT PROGNOSTICS USING LOGICAL ANALYSIS OF DATA AND NON-PARAMETRIC RELIABILITY ESTIMATION METHODS
présentée par : RAGAB Ahmed Ragab Anwar
en vue de l’obtention du diplôme de : Philosophiae Doctor a été dûment acceptée par le jury d’examen constitué de : M. ADJENGUE Luc-Désiré, Ph. D., président
Mme YACOUT Soumaya, D. Sc., membre et directrice de recherche
M. OUALI Mohamed-Salah, Doctorat, membre et codirecteur de recherche M. AGARD Bruno, Doctorat, membre
DEDICATE
I dedicate this thesis to my parents, my beloved wife (Yasmine), my son (Omar), and my daughter (Sarah) whom I am indebted to for their sacrifices, encouragement, and endless and unwavering love.
ACKNOWLEDGEMENTS
There are many people I wish to thank for their help on this thesis. First, I would like to express my profound gratitude to my research director Dr. Soumaya Yacout whom I have had the privilege of being her student and whom I am heavily indebted to. Without her, this thesis could not have been found. I am even more fortunate that she generously gave me more of her valuable time to complete this work. I am indebted to her initial vision and long-term support for the research interest upon which this thesis is based. I appreciate her patience and gentle guidance during the whole process of this research. Her words of wisdom provided me with enough confidence in my skills and encouraged me to undertake this work. She shared with me her knowledge that is valuable as gold.
My profound gratitude goes as well to my co-director of research Dr. Mohamed-Salah Ouali whom I received wisdom and knowledge. He shared with me his experience and knowledge throughout the work. I appreciate his dedication and insightful comments. I have relied upon his insights, encouragement, and experience to formulate my thinking with regard to the technical and theoretical aspects in this thesis. I am deeply grateful to his remarkable support. I appreciate his patience, suggestions for improvements, and willingness to test algorithms and point out errors in the programs’ codes. I am grateful to him for giving me the chance to prove myself.
I owe a special note of regards to Dr. Luc Adjengue, Dr. Bruno Agard, and Dr. Mustafa Kumral for their constructive role as members of my jury.
My gratitude and appreciation go as well to Dr. Hany Osman for providing me continuously with the updated versions of the software cbmLAD.
I would like to extend my thanks and appreciation to all those colleagues from our department for their support and advices to enhance the compilation of this thesis, in particular Xavier de Carné de Carnavalet, Mohamed Ossama, and Wissem Maazoun.
I would like to thank the Natural Sciences and Engineering Research Council of Canada (NSERC) for their fund to accomplish this doctoral program. My thanks go as well to Prüftechnik Canada for supporting us with the vibration data employed in this research.
RÉSUMÉ
Estimer la durée de vie utile restante (RUL) d’un système qui fonctionne suivant différentes conditions de fonctionnement représente un grand défi pour les chercheurs en maintenance conditionnelle (CBM). En effet, il est difficile de comprendre la relation entre les variables qui représentent ces conditions de fonctionnement et la RUL dans beaucoup de cas en pratique à cause du degré élevé de corrélation entre ces variables et leur dépendance dans le temps. Il est également difficile, voire impossible, pour des experts d’acquérir et accumuler un savoir à propos de systèmes complexes, où l'échec de l'ensemble du système est vu comme le résultat de l'interaction et de la concurrence entre plusieurs modes de défaillance.
Cette thèse présente des méthodologies pour le pronostic en CBM basé sur l'apprentissage automatique, et une approche de découverte de connaissances appelée Logical Analysis of Data (LAD). Les méthodologies proposées se composent de plusieurs implémentations de la LAD combinées avec des méthodes non paramétriques d'estimation de fiabilité. L'objectif de ces méthodologies est de prédire la RUL du système surveillé tout en tenant compte de l'analyse des modes de défaillance uniques ou multiples. Deux d’entre elles considèrent un mode de défaillance unique et une autre considère de multiples modes de défaillance. Les deux méthodologies pour le pronostic avec mode unique diffèrent dans la manière de manipuler les données.
Les méthodologies de pronostique dans cette recherche doctorale ont été testées et validées sur la base d'un ensemble de tests bien connus. Dans ces tests, les méthodologies ont été comparées à des techniques de pronostic connues; le modèle à risques proportionnels de Cox (PHM), les réseaux de neurones artificiels (ANNs) et les machines à vecteurs de support (SVMs). Deux ensembles de données ont été utilisés pour illustrer la performance des trois méthodologies: l'ensemble de données du turboréacteur à double flux (turbofan) qui est disponible au sein de la base de données pour le développement d'algorithmes de pronostic de la NASA, et un autre ensemble de données obtenu d’une véritable application dans l'industrie. Les résultats de ces comparaisons indiquent que chacune des méthodologies proposées permet de prédire avec précision la RUL du système considéré.
Cette recherche doctorale conclut que l’approche utilisant la LAD possède d’importants mérites et avantages qui pourraient être bénéfiques au domaine du pronostic en CBM. Elle est capable de gérer les données en CBM qui sont corrélées et variantes dans le temps. Son autre avantage et qu’elle génère un savoir interprétable qui est bénéfique au personnel de maintenance.
ABSTRACT
Estimating the remaining useful life (RUL) for a system working under different operating conditions represents a big challenge to the researchers in the condition-based maintenance (CBM) domain. The reason is that the relationship between the covariates that represent those operating conditions and the RUL is not fully understood in many practical cases, due to the high degree of correlation between such covariates, and their dependence on time. It is also difficult or even impossible for the experts to acquire and accumulate the knowledge from a complex system, where the failure of the system is regarded as the result of interaction and competition between several failure modes.
This thesis presents systematic CBM prognostic methodologies based on a pattern-based machine learning and knowledge discovery approach called Logical Analysis of Data (LAD). The proposed methodologies comprise different implementations of the LAD approach combined with non-parametric reliability estimation methods. The objective of these methodologies is to predict the RUL of the monitored system while considering the analysis of single or multiple failure modes. Three different methodologies are presented; two deal with single failure mode and one deals with multiple failure modes. The two methodologies for single mode prognostics differ in the way of representing the data.
The prognostic methodologies in this doctoral research have been tested and validated based on a set of widely known tests. In these tests, the methodologies were compared to well-known prognostic techniques; the proportional hazards model (PHM), artificial neural networks (ANNs) and support vector machines (SVMs). Two datasets were used to illustrate the performance of the three methodologies: the turbofan engine dataset that is available at NASA prognostic data repository, and another dataset collected from a real application in the industry. The results of these comparisons indicate that each of the proposed methodologies provides an accurate prediction for the RUL of the monitored system.
This doctoral research concludes that the LAD approach has attractive merits and advantages that add benefits to the field of prognostics. It is capable of dealing with the CBM data that are correlated and time-varying. Another advantage is its generation of an interpretable knowledge that is beneficial to the maintenance personnel.
TABLE OF CONTENTS
DEDICATE ... III ACKNOWLEDGEMENTS ... IV RÉSUMÉ ... V ABSTRACT ... VI TABLE OF CONTENTS ...VII LIST OF TABLES ... XIII LIST OF FIGURES ... XV LIST OF ABBREVIATIONS AND NOTATIONS... XVI LIST OF APPENDICES ... XXII
CHAPTER 1 INTRODUCTION ... 1
1.1 Taxonomy of maintenance strategies ... 1
1.2 Problem statement ... 5
1.3 Limitations of current prognostic methods ... 6
1.4 The advantages of using LAD as knowledge discovery approach ... 7
1.5 Research objectives ... 7
1.5.1 General objective ... 7
1.5.2 Specific research objectives ... 8
1.6 Originality and success ... 8
1.7 Deliverables ... 9
1.8 Social impacts and economic benefits ... 10
1.9 Thesis organization ... 11
CHAPTER 2 BACKGROUND AND LITERATURE REVIEW ... 12
2.2 Types of CBM data ... 13
2.3 Data Mining and Knowledge Discovery in CBM ... 14
2.3.1 Big Data in CBM ... 14
2.3.2 Data Mining and machine learning in CBM ... 14
2.4 CBM Components ... 15
2.4.1 Data acquisition ... 15
2.4.2 Data processing ... 16
2.4.3 Maintenance decision-making procedure (diagnosis and prognosis) ... 21
2.5 Fault prognostics in CBM ... 22
2.6 Reliability-based prognosis ... 23
2.6.1 Reliability (survival) function ... 23
2.6.2 Survival function estimation: Parametric techniques ... 24
2.6.3 Non-Parametric survival curve: Kaplan-Meier estimator ... 24
2.6.4 Prognosis: Remaining useful life estimation ... 24
2.7 Updated survival curve using the condition monitoring data ... 25
2.7.1 The effects of the CM data on the survival curve ... 25
2.7.2 Proportional hazards model ... 25
2.8 Multiple Failure Modes Prognostics in CBM ... 26
2.9 Cumulative Incidence Function (CIF): A non-parametric technique for multiple failure modes 26 2.10 Current Prognostic Methods: A Literature Review ... 27
2.10.1 Diagnostic/Prognostic decision approaches ... 27
2.11 Model-Based Prognostic Approaches ... 29
2.12 Data-Driven Prognostics Approaches ... 30
2.12.2 Statistical-based methods ... 34
2.12.3 Other approches: logical analysis of data ... 39
2.13 LAD: Historical perespective ... 40
2.13.1 Knowledge discovery in the form of extracted patterns ... 40
2.14 Two-class LAD decision model ... 41
2.14.1 Stages of two-class LAD ... 41
2.14.2 Data binarization ... 41
2.14.3 Pattern generation ... 41
2.14.4 Definition and characteristics of patterns ... 42
2.14.5 Pattern generation methods ... 43
2.14.6 MILP-based method ... 43
2.14.7 Pattern selection ... 45
2.14.8 Theory formation: discriminant function ... 46
2.15 Multi-class LAD decision model ... 47
2.15.1 Pattern generation for multi-class LAD decision model ... 47
2.15.2 Scoring function for multi-class LAD decision model ... 48
2.16 LAD's applications ... 48
2.16.1 Application of LAD in medical diagnosis and prognosis ... 48
2.16.2 Other applications ... 49
2.16.3 Applications of LAD in CBM diagnostics ... 50
2.17 Application of LAD in CBM Prognostics: Proposed methodologies ... 50
CHAPTER 3 ARTICLE 1 : REMAINING USEFUL LIFE PREDICTION USING PROGNOSTIC METHODOLOGY BASED ON LOGICAL ANALYSIS OF DATA AND KAPLAN–MEIER ESTIMATION ... 52
3.2 Introduction ... 53
3.3 Logical Analysis Of Data ... 57
3.3.1 Logical analysis of data: preliminaries ... 57
3.3.2 Pattern generation for two class LAD decision model ... 58
3.3.3 Combining LAD to KM: the survival curves of the generated patterns ... 59
3.4 Proposed Prognostic Methodology ... 60
3.5 Case Study ... 72
3.5.1 Turbofan engine dataset ... 72
3.5.2 Pattern generation ... 72
3.5.3 Result validation using two-phase Friedman test ... 75
3.6 Conclusion ... 77
3.7 References ... 79
CHAPTER 4 ARTICLE 2 : PATTERN-BASED PROGNOSTIC METHODOLOGY FOR CONDITION BASED MAINTENANCE USING SELECTED AND WEIGHTED SURVIVAL CURVES ………83
4.1 Abstract ... 84
4.2 Introduction ... 84
4.3 Logical Analysis Of Data ... 88
4.3.1 The approach ... 88
4.3.2 Definition and properties of patterns ... 89
4.3.3 Pattern generation ... 90
4.3.4 Pattern selection ... 91
4.4 The Proposed Reliability-Based Prognostic Methodology ... 92
4.4.1 Problem Statement ... 92
4.4.3 Training and updating algorithms ... 102
4.5 Application To NASA Prognostic Turbofan Engine Dataset ... 103
4.5.1 Results Analysis ... 103
4.5.2 Accuracy of the MRUL Calculations ... 106
4.6 Conclusions ... 113
4.7 References ... 114
CHAPTER 5 ARTICLE 3 : PROGNOSTICS OF MULTIPLE FAILURE MODES IN ROTATING MACHINERY USING LOGICAL ANALYSIS OF DATA AND CUMULATIVE INCIDENCE FUNCTIONS ... 118
5.1 Abstract ... 119
5.2 Introduction ... 119
5.3 Multiple Failure Modes Prognostics ... 122
5.3.1 The main challenges in multiple failure modes prognostics ... 122
5.3.2 The idea of the proposed methodology: Merging LAD and CIFs ... 122
5.4 Cumulative Incidence Functions (CIFs) ... 123
5.4.1 The CIF estimation for each failure mode ... 124
5.4.2 Limitation of the KM estimator in the presence of competing failure modes ... 126
5.5 Multi-Class Logical Analysis Of Data ... 127
5.5.1 Stages of the LAD approach and characteristics of the patterns ... 127
5.5.2 Multi-class LAD decision model ... 128
5.6 The Proposed Multiple Failure Modes Prognostic Methodology ... 128
5.7 Case Study: Rotating Machinery Application ... 133
5.7.1 Multiple failure modes prognostics in rotating machinery ... 133
5.7.2 Prüftechnik Canada vibration data ... 133
5.7.4 Feature Selection ... 137
5.7.5 CIF Estimation for Each Failure Mode ... 138
5.7.6 Pattern Generation Using Multi-Class LAD ... 139
5.7.7 Validation of the Proposed Methodology ... 140
5.8 Conclusions ... 146
5.9 References ... 147
CHAPTER 6 GENERAL DISCUSSION ... 150
CONCLUSION AND FUTURE WORK ... 156
REFERENCES ... 160
APPENDIX A – DISTANCE EVALUATION TECHNIQUE ... 173
APPENDIX B –NON PARAMETRIC MAXIMUM LIKELIHOOD ESTIMATION FOR KAPLAN-MEIER ESTIMATOR ... 175
APPENDIX C – REMAINING USEFUL LIFE CALCULATION ... 177
APPENDIX D – PROPORTIONAL HAZARDS MODEL ... 180
APPENDIX E – DATA BINARIZATION ... 182
APPENDIX F – PATTERN GENERATION ... 187
LIST OF TABLES
Table 3.1: Representation of the training dataset for 𝑇 equipment ... 63
Table 3.2: Dataset for SL and LL equipment ... 64
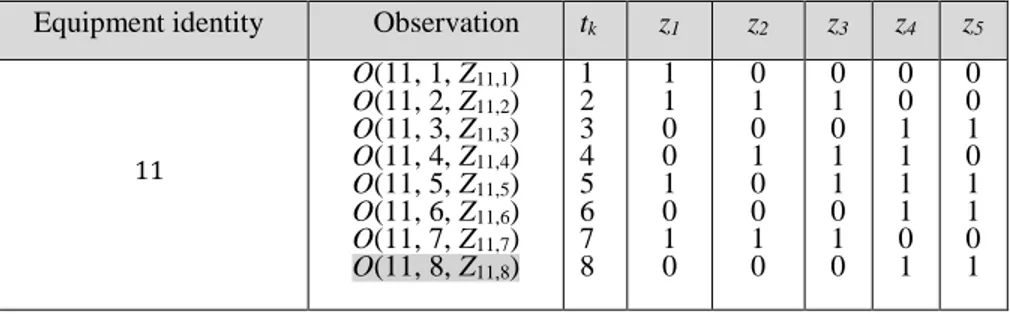
Table 3.3: Updating observations from equipment 11 ... 64
Table 3.4: The baseline survival curve ... 65
Table 3.5: Generated SL and LL patterns ... 66
Table 3.6: Survival curves of SL patterns, LL patterns, and the baseline ... 66
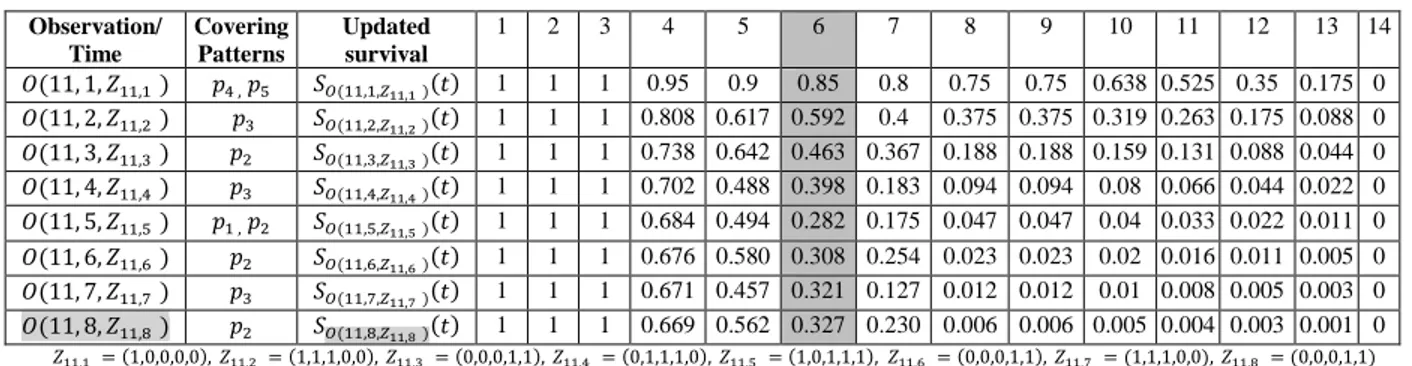
Table 3.7: Updating procedure for the estimated survival curve (formula 2) ... 68
Table 3.8: MRUL calculation for equipment 11 ... 70
Table 3.9: Representation of the training observations for the 260 equipment ... 72
Table 3.10: The generated SL and LL patterns ... 73
Table 3.11: The results for LAD prognostic models and PHM prediction model ... 74
Table 3.12: Friedman test to validate the proposed LAD methodology ... 77
Table 4.1: The observations collected from 𝑀 system ... 95
Table 4.2: Representation of the training observations collected from V systems ... 96
Table 4.3: The results for LAD Formula 1, LAD Formula 2, and LAD Formula 3, for a sample of ten engines ... 105
Table 4.4: Friedman test without considering pattern selection in the proposed LAD methodology ... 108
Table 4.5: Friedman test when considering the selected patterns ... 109
Table 4.6: Comparison between the obtained results using the first two formulas in both methodologies ... 109
Table 4.7: Comparison between the obtained results using the second two formulas in both methodologies ... 110
Table 4.8: Friedman test for the ANN, the SVR, and the proposed LAD methodology without considering pattern selection ... 112
Table 4.9: Friedman test for the ANN, the SVR, and the proposed LAD methodology when
considering the selected patterns ... 112
Table 5.1: Time domain-based features ... 134
Table 5.2: A sample of the processed observations collected from three different bearings having three different failure modes ... 137
Table 5.3: Interpretations of the generated patterns (1: Inner race defect, 2: Outer race defect, and 3: Rolling element defect) ... 140
Table 5.4: Average prediction error when the prognostic models consider all features in the training dataset ... 143
Table 5.5: Average prediction error when the prognostic models consider the selected features only ... 144
Table 5.6: The total incurred prediction penalty for each prognostic model when all extracted features are considered ... 145
Table 5.7: The total incurred prediction penalty for each prognostic model when the selected features using CDET are considered ... 145
Table E.1: Non-binary data ... 183
Table E.2: Ranking of the numerical factor 𝑧1 in ascending order ... 183
Table E.3: Ranking of the ordinal factor 𝑧5 in ascending order ... 185
Table E.4: The binary data resulting from Table E.1 ... 186
Table F.1: Eight observations (four positive and four negative) ... 188
Table F.2: The observations and their complements (first MILP procedure) ... 189
Table F.3: The first MILP iteration (generation of the positive pattern 𝑝1+) ... 189
Table F.4: The observations and their complements (second MILP procedure) ... 190
Table F.5: The second MILP iteration (generation of the positive pattern 𝑝2+) ... 191
Table F.6: The third MILP iteration (generation of the negative pattern 𝑝1−) ... 191
LIST OF FIGURES
Figure 1-1: Taxonomy of maintenance strategies as presented in [2] ... 2
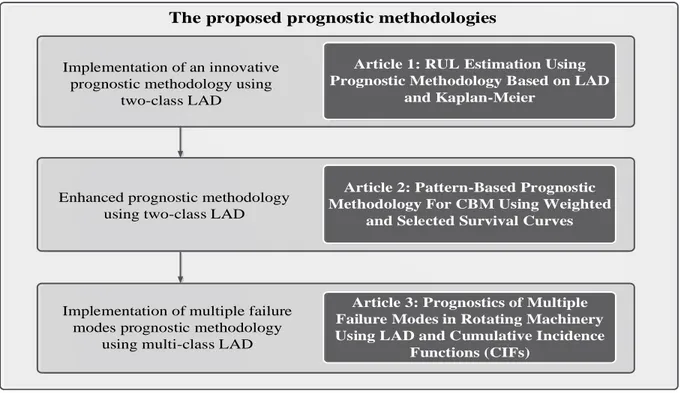
Figure 1-2: Illustration of published and submitted articles incorporated in this thesis ... 10
Figure 2-1: The seven functional layers of the OSA-CBM presented in [39] ... 13
Figure 2-2: The overall architecture of the CBM program ... 22
Figure 2-3: Model-based and data-driven approaches as presented in [20] ... 28
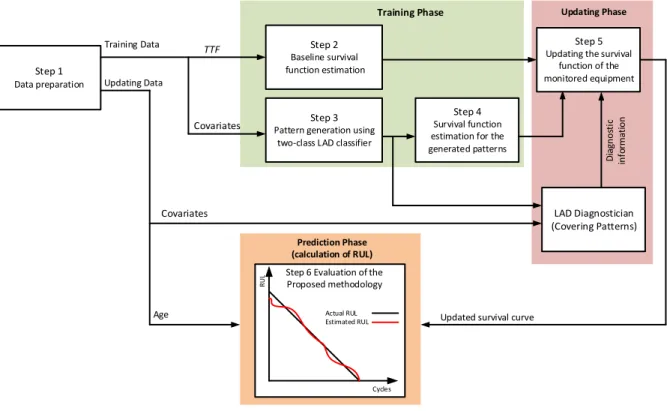
Figure 3-1: Schematic diagram for the proposed prognostic methodology ... 61
Figure 3-2: Estimated survival curves for the baseline, and the five generated patterns ... 67
Figure 3-3: Actual RUL versus estimated RUL for equipment 11 ... 70
Figure 3-4: The pseudocode of the training algorithm ... 71
Figure 3-5: The pseudocode of the updating and RUL estimation algorithm ... 71
Figure 3-6: Survival curves for some of the generated SL and LL patterns ... 73
Figure 4-1: The diagram of the pattern-based prognostic methodology ... 94
Figure 4-2: SL and LL observations in the training dataset ... 97
Figure 4-3: The baseline survival curve, the survival curves for a sample of the selected SL and LL patterns, and the updating procedure after collecting the first two observations from the first engine, using LAD Formula 1. ... 104
Figure 5-1: Different deterioration paths for each failure mode ... 123
Figure 5-2: Phases and steps of the proposed multiple failure modes prognostic methodology . 132 Figure 5-3: Feature selection using CDET ... 138
Figure 5-4: CIF for each failure mode and the curve 𝐹(𝑡) = 1 − 𝑆(𝑡) ... 139
Figure 5-5: The ANN prediction model ... 142
Figure 5-6: The prediction accuracy function ... 144
LIST OF ABBREVIATIONS AND NOTATIONS
Abbreviations
AHM Asset Health Management RCM Reliability Centred Maintenance CBM Condition-Based Maintenance
IVHM Integrated Vehicle Health Management IAEA International Atomic Energy Agency RUL Remaining Useful Life
LAD Logical Analysis of Data
NASA National Aeronautics and Space Administration OSA-CBM Open System Architecture for CBM
SNR Signal-to-Noise Ratio
PCA Principal Component Analysis FDA Fisher Discriminant Analysis ICA Independent Component Analysis RMS Root Mean Square
TSA Time Synchronous Averaging ARMA Autoregressive Moving Average FFT Fast Fourier Transform
STFT Short Time Fourier Transform
WT Wavelet Transform
DWT Discrete Wavelet Transform WPT Wavelet Packet Transform
GA Genetic Algorithm
SBS sequential backward selection DET distance evaluation technique
KM Kaplan-Meier
MRUL Mean Remaining Useful Life PHM Proportional Hazards Model CIF Cumulative Incidence Function
PNs Petri Nets
ANNs Artificial Neural Networks WMRs Wheeled Mobile Robots FEA Finite Element Analysis PF Particle Filtering
EPGS Electrical Power Generation and Storage EKF Extended Kalman Filtering
HMM Hidden Markov Model SVR Support Vector Regression
DWNN Dynamic Wavelet Neural Network PSD Power Spectral Density
GRNN Generalized Regression Neural Network RNN Recurrent Neural Networks
FCRNN Fully Connected Recurrent Neural Network EHSVs Electrohydraulic Servo Valves
FFNN Feed-Forward Neural Network DGDS Hazardous Gas Detection System
MCS Monte Carlo Simulation LR Logistic Regression SVMs Support Vector Machines SLT Statistical Learning Theory OAO One-Against-One
OAA One-Against-All DAG Direct Acyclic Graph HVAC High Voltage AC Machines
MILP Mixed Integer and Linear Programming SCP Set Covering Problem
LASD Logical Analysis of Survival Data
Notations
𝑆(𝑡) The survival function at time 𝑡.
𝑑𝑗 The number of systems that failed at time 𝑡𝑗.
𝑛𝑗 The number of systems which are at risk just before the time 𝑡𝑗. 𝑀𝑅𝑈𝐿(𝑡𝑘) The mean remaining useful life calculated at time 𝑡𝑘.
𝐸[𝑇 − 𝑡𝑘|𝑇 > 𝑡𝑘] The expected value of the conditional random variable 𝑇 − 𝑡𝑘, given the
time 𝑡𝑘, where 𝑇 is the time to failure.
𝐶𝑜𝑣(𝑝) The set of observations covered by the pattern 𝑝.
𝛺𝑆𝐿 The set of observations collected from the short life systems that fail
before a specified time 𝑡𝑆. The time 𝑡𝑆 is specified and decided by the
maintenance personnel. In this thesis we consider 𝑡𝑆, the mean time to failure.
𝛺𝐿𝐿 The set of observations collected from the long life systems that fail after
the time 𝑡𝑆.
𝛺 The training data set.
𝑂(𝑖, 𝑡𝑘, 𝑍𝑖,𝑡𝑘) The observation collected from the 𝑖
𝑡ℎ system (𝑖 = 1,2, … 𝑀) at time
𝑡𝑘 (𝑡𝑘 = 1,2, … 𝑡𝐹𝑖), where 𝑡𝐹𝑖 is the failure time. The vector of covariates 𝑍𝑖,𝑡𝑘 represents the operating conditions and condition indicators at time 𝑡𝑘.
𝑂(𝑖, 𝑡𝐹𝑖, 𝑍𝑖,𝑡
𝐹𝑖 ) The failure observation of the 𝑖
𝑡ℎ system at time 𝑡
𝐹𝑖, and 𝑍𝑖,𝑡𝐹𝑖 is the corresponding vector of the covariates.
𝑂(𝑖, 𝑡𝐹𝑖 ≤ 𝑡𝑆, 𝑍𝑖,𝑡𝐹𝑖≤𝑡𝑆) A positive (short life) observation in the training dataset. 𝑂(𝑖, 𝑡𝐹𝑖 > 𝑡𝑆, 𝑍𝑖,𝑡𝐹𝑖>𝑡𝑆) A negative (long life) observation in the training dataset. 𝑂(𝑢, 𝑡𝑘, 𝑍𝑢,𝑡𝑘 ) The updating observation collected from the 𝑢
𝑡ℎ system
(𝑢 = 1,2, … 𝑈) at time 𝑡𝑘 (𝑡𝑘 = 1,2, … 𝑡𝐹𝑢), and 𝑍𝑢,𝑡𝑘is the vector of covariates at time 𝑡𝑘.
𝑆𝑏(𝑡) The baseline survival function (also called survival probability function)
estimated by KM.
𝑃 The set of generated patterns, in the first article of the thesis.
|𝑃| The cardinality of the set of generated patterns 𝑃 (i.e. the number of generated patterns).
𝑝𝑗 A pattern belongs to the set of generated patterns 𝑃, where 𝑗 = 1,2, … |𝑃|.
𝑆𝑝𝑗(𝑡) The survival curve of the generated pattern 𝑝𝑗.
𝑆𝑂(𝑢,𝑡𝑘,𝑍𝑢,𝑡𝑘)(𝑡) The updated survival curve of the updating observation 𝑂(𝑢, 𝑡𝑘, 𝑍𝑢,𝑡𝑘), at time 𝑡𝑘 for the 𝑢𝑡ℎ system (𝑢 = 1,2, … 𝑈), and 𝑈 is the number of
𝑆𝑓(𝑡) The former updated survival curve obtained from the previous updating observation.
𝑀𝑅𝑈𝐿𝑢(𝑡𝑘) The mean remaining useful life of the 𝑢𝑡ℎ system , calculated at time 𝑡𝑘.
𝛥𝑡𝑟 The monitoring interval which is the difference between two consecutive
inspection times i.e. 𝛥𝑡𝑟 = 𝑡𝑟+1− 𝑡𝑟.
𝑅𝑀𝑆𝐸(𝑢) The calculated root mean squared error (RMSE) for the MRUL estimation of the 𝑢𝑡ℎ system in the updating dataset, where (𝑢 = 1.2, … 𝑈).
𝑁𝐹𝑢 The actual number of operational cycles until the failure of the 𝑢𝑡ℎ system.
𝐹𝑟 Friedman test statistic.
𝑃(𝜒𝑘−12 ≥ 𝐹𝑟) The calculated significance level, where 𝜒𝑘−12 is the Chi-Square value with 𝑘 degrees of freedom, and 𝑘 is the number of prognostic formulas. χ𝑘−1,𝛼2 The Chi-Square value with 𝑘 degrees of freedom and a declared
significance level 𝛼.
𝑑𝛼𝐹√𝑈𝑘(𝑘 + 1)/6 A post-hoc value used for the second phase of Friedman test, where 𝑑𝛼𝐹 is the 100(1 − 𝛼𝐹)𝑡ℎ of the standard normal distribution, and 𝛼𝐹 is the
family wise significance level.
𝑝𝑔 ∈ 𝑃𝐺𝑒𝑛 A pattern belong to the set of generated patterns 𝑃𝐺𝑒𝑛, in the second article of the thesis.
|𝑃𝐺𝑒𝑛 | The cardinality of the set of generated patterns 𝑃𝐺𝑒𝑛 (i.e. the number of
generated patterns).
𝑝𝑠 ∈ 𝑃𝑆𝑒𝑙 A selected pattern belonging to the set of selected patterns 𝑃𝑆𝑒𝑙.
|𝑃𝑆𝑒𝑙 | The cardinality of the set 𝑃𝑆𝑒𝑙 (the number of selected patterns).
𝑊𝑝𝑠 The normalized weight of the selected pattern 𝑝𝑠.
𝑐𝑜𝑣(𝑝𝑠) The set of observations that are covered by the selected pattern 𝑝𝑠. 𝑆𝑝𝑠(𝑡) The survival curve of the selected pattern 𝑝𝑠.
𝑀𝑅𝑈𝐿𝑢(𝑡𝑘, 𝑍𝑡𝑘) The mean remaining useful life (MRUL) calculated for the 𝑢𝑡ℎ system at time 𝑡𝑘 for a vector of covariates 𝑍𝑡𝑘.
𝐸[𝑇 − 𝑡𝑘|𝑇 > 𝑡𝑘, 𝑍𝑡𝑘] The expected value of the conditional random variable 𝑇 − 𝑡𝑘, given the time 𝑡𝑘 and the vector of covariates 𝑍𝑡𝑘.
𝑃(𝑇 ≥ 𝑡𝑘) The probability that the random variable 𝑇 is greater than the value 𝑡𝑘.
𝑆𝑖(𝑡) The cause-specific survival (sub-survival) for the failure mode 𝑖, where (𝑖 = 1, … , 𝐶).
𝑞𝑖 The proportion of systems that failed due to the failure mode 𝑖. ℎ𝑖(𝑡𝑗) The sub-hazard function for the failure mode 𝑖 at 𝑡𝑗.
𝑓𝑖(𝑡𝑗) The sub-density function for the failure mode 𝑖 at time 𝑡𝑗.
𝑑𝑖𝑗 The number of systems that have experienced the failure mode 𝑖 at 𝑡𝑗.
𝐹̂𝑖(𝑡) The estimated CIF for the system that is experiencing the failure mode 𝑖
at the time 𝑡.
𝑆𝑂(𝑡𝑘)(𝑡) The updated survival curve for the system based on the collected observation 𝑂, at time 𝑡𝑘.
𝑀𝑅𝑈𝐿𝑖(𝑡𝑘) The MRUL for the cause-specific failure mode 𝑖, calculated at time 𝑡𝑘.
𝑆̂𝑖(𝑡) The estimated sub-survival function derived from the estimated CIF for
the failure mode 𝑖.
𝑀𝑅𝑈𝐿̂ 𝑂(𝑡𝑘) The 𝑀𝑅𝑈𝐿 of the monitored system estimated based on the updated survival curve 𝑆𝑂(𝑡𝑘)(𝑡).
𝐸̅ The average absolute prediction error.
𝐿𝐴𝑐𝑐(𝑡𝑘) The prediction accuracy function which measures the difference between the actual 𝑅𝑈𝐿 and the estimated 𝑅𝑈𝐿 at the inspection time 𝑡𝑘.
𝐿𝐴𝑃(bearing𝑔 ) The average penalty incurred for the bearing 𝑔. 𝐿(model) The total penalty incurred for each prediction model.
LIST OF APPENDICES
Appendix A – Distance Evaluation Technique ... 173 Appendix B –Non Parametric Maximum Likelihood Estimation For Kaplan-Meier Estimator . 175 Appendix C – Remaining Useful Life Calculation ... 177 Appendix D – Proportional Hazards Model ... 180 Appendix E – Data Binarization ... 182 Appendix F – Pattern Generation ... 187
CHAPTER 1
INTRODUCTION
Asset health management (AHM) system implies the continuous monitoring of an asset, in order to detect and predict as early as possible any changes in its condition that may have drastic consequences [1]. These consequences may concern safety issues, e.g. the failure of nuclear reactors or aircraft gas turbine engines. These consequences may also be economical when dealing with the occurrence of unscheduled downtime that may prevent accomplishing the committed mission schedules. As an example, unscheduled downtime has serious economic consequences in critical applications such as aircrafts or missiles assigned to space exploration missions [2]. These consequences provide the motivation to perform maintenance and repair tasks before such drastic situations arise.
The task of maintenance is to maintain reliable and cost-effective operations of physical assets. Different maintenance strategies have been introduced as an efficient way to assure a satisfactory level of availability of the assets [3]. Moreover, the maintenance of an engineering asset is a prerequisite which has significant impacts on its safety and reliability [4].
Maintenance costs have increased rapidly during the past years since they represent a major part (from 15% to 40%) of the total operating costs in manufacturing and production plants, according to the study reported in [4, 5]. It was also reported that as much as 30% of the total maintenance expenditures were spent on some unnecessary actions like, the use of unnecessary preventive maintenance, and wrong scheduling [6]. Consequently, the experts in maintenance engineering have paid a deep attention to various types of advanced maintenance strategies [7].
1.1 Taxonomy of maintenance strategies
Various definitions of maintenance strategies have been suggested during the past years. The maintenance terminologies used in this thesis have been used in [4, 8, 9]. In a broad sense, the maintenance strategies can be classified as reactive (also called unplanned or break-down or run-to-failure maintenance) and proactive (also called planned maintenance). Figure 1-1 gives a brief taxonomy for different maintenance strategies, as presented in [2].
In reactive maintenance, the actions are taken after breakdowns occur (fix or replace the unit after it fails). In proactive maintenance, the objective is to resolve the issues in the operating asset prior to the onset of failure [10]. This can be done by performing inspection and/or servicing tasks that
have been pre-planned to retain the functional capabilities of the asset [11]. Proactive maintenance strategies can be further classified into preventive and predictive maintenance. In preventive maintenance, the actions are taken in predetermined or periodic intervals in order to prevent breakdowns or failures, regardless of the health state of the physical asset [9].
As technology developed rapidly, engineering systems have become more and more complex while higher quality and reliability are required [12]. As a result, the costs of preventive maintenance become higher. One way to minimize unnecessary maintenance and repair costs and probability of failure is to perform an assessment and prediction of the asset’s health state, based on its current and historical operating conditions [2]. This can be carried out by applying a predictive maintenance strategy where the action taken is dependent on the nature of the physical asset and the availability of input data.
In predictive maintenance, the goal is to make economically justifiable decisions by blending together the economic aspects and the risk prediction, in order to identify the optimal maintenance decision [13]. The authors in [2] present a good review for the maintenance strategies that focus on improving reliability and reducing unscheduled downtime by monitoring and predicting the asset’s health conditions. As depicted in Figure 1-1, predictive maintenance can be further classified into reliability centered maintenance (RCM) and condition-based maintenance (CBM).
Maintenance strategy Break-down or Reactive Maintenance Proactive or planned Maintenance Corrective Maintenance Emergency Maintenance Preventive Maintenance Predictive Maintenance Reliability Centred Maintenance (RCM) Condition Based Maintenance (CBM) Constant Interval Maintenance Age based Maintenance Imperfect Maintenance
Recently, CBM has received an increasing attention among the practitioners and researchers, as a predictive maintenance strategy [5]. It consists of activities and tasks for detecting and correcting failure causes, by monitoring the symptomatic conditions of the failure process in the targeted asset. CBM utilizes condition monitoring technologies to detect and predict the current and future health states of the engineering assets, based on non-intrusive measurements of their operating conditions [14].
CBM strategy attempts to avoid unnecessary preventive maintenance tasks by taking maintenance actions only when there are abnormal signs coming from the monitored asset [15]. In other words, it makes a maintenance decision based on the up-to-date degradation data of the monitored asset. Many cases from the industry that are applying CBM show significant reductions in preventive maintenance costs, while maintaining or even improving the availability and reliability of the monitored systems [13].
AHM system uses the CBM strategy to provide an intuitive and integrated solution to detect the defects of an asset through the continuous monitoring during multiple degraded states before it fails [1]. In the AHM/CBM system, the degraded states of the asset are monitored and predicted, and the optimal maintenance actions can be taken to protect it from breakdown or catastrophic failures [3].
Researches supported by international agencies, industry and academia are focusing on designing more effective and intelligent AHM/CBM systems [16]. The National Aeronautics and Space Administration (NASA) uses the Integrated Vehicle Health Management (IVHM) program for its fleet [17]. The International Atomic Energy Agency (IAEA) is continuously paying a great attention to AHM/CBM programs, in order to improve both reliability and safety of nuclear power plants [18].
As decision making procedures in the CBM system, diagnostics and prognostics are two important aspects. Diagnostics deals with fault detection, isolation and identification when it occurs [3, 19, 20]. Fault detection is the task of indicating whether something is going wrong in the monitored asset or not; fault isolation is the task of locating the faulty component; and fault identification is the task of determining the nature of the fault in the located faulty component [3, 20].
Prognostics on the other hand deal with the prediction of failure before it occurs. The task of such prediction is to determine whether a failure is impending and estimate how long and how likely
this failure will occur [20]. A particular prognostic issue is to estimate the remaining useful life (RUL) (also called residual life) of the monitored asset. The RUL is defined as the time left before the occurrence of catastrophic failure [12, 20].
Developing an accurate prognostic method is motivated by the need to prolong the utilization of the system. The accuracy of diagnosis procedure affects the life of the monitored system since the prognosis procedure is based on these diagnostic results [3]. Therefore, the prognosis procedure requires precise diagnostic models, in order to estimate the future health states and the RUL of the monitored system, accurately [21].
Fortunately, the invention of advanced sensors and powerful signal processing techniques enable the maintenance practitioners to extract multiple features for the purpose of degradation detection and quantification [22]. Some of the extracted features can be selected and can serve as the basis for accurate diagnosis and hence RUL prediction. The prediction of RUL in CBM is not completely understood in many practical situations [20]. As an example in bearing prognostics, it is known that the vibration in a pump is not the only indication for its future failure.
The aim of this thesis is to present the subject of this doctoral research which focuses on the implementation of an interpretable knowledge discovery approach called Logical Analysis of Data (LAD) in the field of CBM prognostics. LAD was applied successfully in the field of medical diagnosis and prognosis to diagnose patient’s condition and to predict the propagation of some diseases [23-25]. As a machine learning classification technique, LAD was used on a great variety of problems and reacts well to noisy data and measurement errors [26]. It was applied in the field of CBM diagnostics for the first time by the maintenance and reliability research team at École Polytechnique de Montréal, Canada [27].
The material discussed and the terminologies used in this thesis are often interdisciplinary, originating in quite disparate fields such as machine learning, pattern recognition, statistical models, mechanical engineering, computer science, and maintenance and reliability engineering. The terms used in this thesis are largely those pertaining to the CBM domain and are taken from some of the most cited papers and books such as [3, 12, 20]. Other terminologies from different disciplines may be brought to the CBM domain. The vocabulary used in Chapter 2 explaining the CBM and LAD are adopted from [3, 26], as they are the most cited articles concerning the two domains.
1.2 Problem statement
A significant amount of researches and reasonable progresses have been achieved in system diagnostics and it has been a subject of considerable attention in CBM community, whereas the prognostic methods have not enjoyed the same attention [3]. In general, the design procedures for the prognostic methods are more complex than that of the diagnostic ones, due to some challenges and complications. As the systems become complex and critical, the need for accurate prognostic methods has been urgent in order to maximize their reliability. Maximizing the reliability of a system means increasing its ability to survive more and more in the future [28]. An example of such systems is the aircraft turbine engine [29].
In order to compare different prognostic methods, some performance indices should be followed [20]. A justification of a designed prognostic method should be provided based on such performance indices [12]. From data analysis point of view, as more historical data about the system’s health conditions become available, the devised prognostic method will be able to predict the RUL more accurately [20].
We identified two main research problems in the field of prognostics, they are stated as follows: 1- A significant challenge is to estimate the RUL for a population of systems working under varying
operating conditions. This is because the relationship between the covariates that are representing those operating conditions and the prediction of RUL in many cases is not fully understood, due to the high degree of correlation between such covariates and their dependence on time. Generally, long term prediction of RUL in CBM entails large amount of uncertainty because the system’s degradation undergoes dynamic stochastic process and usually consists of a sequence of degraded states [22].
2- Another challenge is to estimate the RUL in case of complex systems that fail due to one of multiple failure modes. In this case, the failure of the system is regarded as the result of interaction and competition between several failure modes. In rotating machinery as an example, at the system level, different components can have different failures such as: bearing defect, cracked or broken rotor bars, mechanical seal wear, and others [30]. At the component level, there may be different types of failure modes such as: an inner race defect, an outer race defect, a crack in the cage of the rolling element. In multiple failure modes prognostics, the challenge
is to consider the effect of those interacting and competing failure modes when analyzing the RUL or the failure time of a monitored system.
1.3 Limitations of current prognostic methods
Most of the current prognostic methods in the CBM literature do not address the above two challanges more accurately. Accordingly, they pose some limitations summarized in the following two papagraphs.
The majority of those prognostic methods either assume many impractical assumptions about the disribution of the data, or they are based on tedious parameter tuning and experimental settings. A number of these prognostic methods still rely on human experience. Although the experts have significant knowledge about system failure and its degraded states, they do not have systematic methodologies that can predict the RUL in the presence of highly correlated or time-varying covariates [2]. Therefore, there is a need to develop and to improve systematic prognostic methodologies that can be implemented in the AHM/CBM system without the need to hire an expert.
In case of multiple failure modes prognostics, most of the prognostic methods assume that the lifetime data for each failure mode are drawn from a certain parametric failure distribution function. There are two major limitations when applying such parametric prognostic models in CBM. The first limitation of such models is that they are application-dependent. This means that the assumption that allows the lifetime data for each failure mode to follow a certain distribution, needs a lot of experience and knowledge about the application at hand. It is also hard or even impossible to accumulate the knowledge in the case of complex systems that have a multitude of failure modes. The second limitation of those prognostic models is that the failure distribution function of each failure mode is estimated by considering the other competing failure modes as censored categories. According to those two limitations, it is necessary to develop a non-parametric failure distribution function for each failure mode, while considering the other failure modes as competing ones. The above problems and limitations in CBM prognostics motivate us to design and develop prognostic methodologies that are not based on any assumptions for the distributions of CBM data, and are not based on any experts as well. The methodologies are based on certain theoretical and practical settings, targeting some issues of implementing CBM prognostics as a holistic
phenomenon. They are based on LAD as a proven approach which possesses two key advantages over the other knowledge discovery techniques.
1.4 The advantages of using LAD as knowledge discovery approach
The results reported in the CBM diagnostic applications presented in [10, 27, 31, 32], show that LAD as a classification technique demonstrated a good performance in detecting the faulty systems. It is also concluded from the results presented in those works that LAD is a promising tool in CBM decision making. Moreover, it is shown that the LAD approach has some important advantages over the other comparable techniques. These advantages are listed as follows:
1- Unlike many CBM decision making techniques which assume that the input data belong to a certain probability distribution, LAD is not based on any statistical analysis. This makes it capable of dealing with the covariates that are highly correlated and time-varying, without the need to satisfy any statistical assumptions. LAD detects and evaluates the correlation between any number of covariates in the CBM data, without the need to select the most significant ones. 2- The transparency (interpretability) and knowledge preservation. This is one of the important properties of the LAD approach when it is compared to the other machine learning techniques in the field of CBM [32]. The transparency means that LAD as a decision model is meaningful and gives a physical interpretation about the behavior of the monitored system. Once the training phase is completed, the knowledge is discovered in the form of interpretable patterns and preserved for the future use by the maintenance personnel.
1.5 Research objectives
1.5.1 General objective
The ultimate objective of this doctoral research is to estimate the future health condition and to predict the failure time of the monitored systems using automated CBM prognostic methodologies based on LAD.
The task is to predict the advent of failure in terms of the probability of mission survival or remaining useful life. The historical CBM data collected from various systems are analyzed for the purpose of knowledge discovery. The discovered knowledge is then used in different ways by using diagnostic and prognostic algorithms.
In this doctoral reseach, different implementation methodologies are adopted by combining LAD to non-parametric reliability estimation methods. These methodologies will be discussed in the subsequent chapters of this thesis. The developed prognostic methodologies can be employed to reduce industry’s dependence on the experts.
The performance of each methodology in this doctoral research is measured in terms of the difference between the predicted and actual RUL of the monitored system.
1.5.2 Specific research objectives
The above general objective is achieved by fulfilling the following specific objectives:
1- Implementation of two different prognostic methodologies based on the two-class LAD approach. The two methodologies are developed in order to predict the RUL of a system works under varying operating conditions. LAD is exploited to extract the hidden knowledge from the CBM data. The extracted knowledge is then used to update the reliability curve estimated by using a common non-parametric estimation method. The updated reliability curve is then exploited to estimate the system’s RUL.
2- Implementation of multi-class LAD as a prognostic methodology for the systems that fail due to multiple failure modes. The multi-class LAD is merged with a set of non-parametric functions that are characterizing the different failure modes (one function for each failure mode). The reliability curve of a monitored system is updated based on the knowledge extracted from the CBM data. The RUL is then estimated based on the updated curve.
3- Software development. The prognostic algorithms in the three methodologies are developed using designed computer codes. The codes are integrated and linked to the existing software cbmLAD, to deal with the CBM prognostic applications. The intellectual property of the developed software belongs to École Polytechnique de Montréal, and those members of our maintenance and relibility research team who contributed in the development of this software.
1.6 Originality and success
The maintenance and reliability research team at École Polytechnique de Montréal, Canada was able to reproduce human expertise in detecting and analyzing different faults in the field of CBM diagnostics, by using LAD as a classification method. LAD was used successfully to diagnose
machine conditions and to detect faults of some important applications such as rotor bearings and power transformers. It also demonstrated good performance in detecting and analysing the faults and phenomenon of rogue components in airplanes. It is clear that the accuracy of a prognostic algorithm is mainly dependent on the accuracy of diagnostic information used. Our hypothesis states that LAD diagnostic model can be developed and used as the cornerstone in different prognostic methodologies to predict the RUL. According to the previously mentioned advantages of LAD, this thesis presents novel CBM prognostic methodologies based on LAD. The novelty of this doctoral research is stated in two points (1) the application of two-class LAD as prognostic methodology, and enhancing this methodology in order to improve its performance (2) A novel and innovative application of multi-class LAD within the context of multiple failure modes prognostics in CBM. To the best of our knowledge, the material presented in this thesis is not published or written elsewhere except where due references are cited.
The methodologies involved in this thesis were compared to other common prognostic methods in the CBM domain. The obtained results are promising and indicate that these methodologies can be applied successfully in the industrial applications.
1.7 Deliverables
The research conducted in this thesis was followed in an evolutionary manner in order to achieve the objectives stated previously. The outcomes of this doctoral research are:
1- Three conference papers.
2- Three articles, two focus on the implementation of two-class LAD in prognostics and the third one focuses on the implementation of multi-class LAD in multiple failure modes prognostics. 3- A thesis compiling the findings, including the three articles.
4- In addition to the articles, a related software was developed.
This doctoral research is documented in the three articles incorporated into this thesis. The first two articles address the first problem stated previously. The first article in this thesis has been approved and published in the “Journal of Intelligent Manufacturing”. The second article addresses three modifications to the methodology proposed in the first article. It has been submitted to the journal of “IEEE Transactions on Reliability”.
The third article addresses the second problem stated above. It involves the implementation of multi-class LAD as a multiple failure modes prognostic methodology in a common CBM appliaction; rotating machniery prognostics. It has been submitted to the journal of “Mechanical Systems and Signal Processing”. Figure 1-2 illustrates the evolutionary approach followed in this doctoral research along with the three articles involved.
Article 1: RUL Estimation Using Prognostic Methodology Based on LAD
and Kaplan-Meier
Implementation of an innovative prognostic methodology using
two-class LAD
Article 2: Pattern-Based Prognostic Methodology For CBM Using Weighted
and Selected Survival Curves
Enhanced prognostic methodology using two-class LAD
Article 3: Prognostics of Multiple Failure Modes in Rotating Machinery Using LAD and Cumulative Incidence
Functions (CIFs)
Implementation of multiple failure modes prognostic methodology
using multi-class LAD
The proposed prognostic methodologies
Figure 1-2: Illustration of published and submitted articles incorporated in this thesis
1.8 Social impacts and economic benefits
The results obtained during this doctoral research were published and submitted in international journals and specialized conferences, targeting to enforce the link between both academic and industrial communities. The results obtained were validated in collaboration with selected practitioners in North America such as NASA and Prüftechnik Canada. This research on the other hand is expected to reduce the maintenance cost significantly since it is able to accurately predict the system's health conditions. Hence, it enables the maintenance personnel to act only when maintenance is actually necessary. We are planning to extend this research in the future to the optimization of maintenance resources which is one of the interests of our research team at École Polytechnique de Montréal.
1.9 Thesis organization
This thesis is divided into six chapters. Chapter 1 explains the problem being studied and its scientific, practical, and economical pertinence. It also states the objective of this research and explains its originality, the targeted deliverables, and delimitations of the thesis.
Chapter 2 explains the different procedures involved in CBM and the techniques used in each procedure. It also presents a literature review on the current CBM prognostic methods. The purpose is to give the reader a general overview and a preliminary number of references for the common prognostic methods. Meanwhile, the chapter presents the LAD decision model and describes the state of the art in this approach. The historical perspectives and knowledge discovery process are overviewd. The common applications of LAD are presented at the end of the chapter.
Chapters 3 through 5 present the three articles incorporated into this thesis. They include the developed prognostic methodologies used throughout this doctoral research.
Chapter 3 proposes a novel and innovative prognostic methodology to predict the RUL of a system working under different operating conditions, based on two-class LAD. The performance of the proposed methodology is illustrated on a benchmark dataset in the field of prognostics, by comparing it to the most common statistical-based CBM prognostic method; the proportional hazards model (PHM).
Chapter 4 presents an enhanced prognostic methodology addressing three modifications to the proposed methodology in Chapter 3. The utility of the proposed methodology is demonstrated through a number of experiments on the same benchmark dataset, by performing comparisons with two common machine learning techniques; support vector machines and artificial neural networks. Chapter 5 presents a novel prognostic methodology based on multi-class LAD to predict the RUL of the systems that are working under difffernt operating conditions and subjected to multiple failure modes. The methodology addresses the two main limitations of the current multiple failure mode prognostic methods that were stated previously. The proposed methodology is validated through experiments on a dataset collected from the industry. It is compared to support vector machines and artificial neural networks, for the purpose of validation.
Chapter 6 presents a general discussion on the three articles incorporated in this thesis, followed by conclusions and future work directions to extend this doctoral research.
CHAPTER 2
BACKGROUND AND LITERATURE REVIEW
2.1 CBM definition and standards
The definition of CBM in this thesis is adopted from [3] as one of the most cited papers in this domain. It is defined as the predictive maintenance initiated as a result of continuous or periodic measurement and interpretation of data to indicate the condition of the monitored asset [3, 33, 34]. The standard definition found in the British Standard (BS 3811:1984) defines the CBM as “the preventive maintenance initiated as a result of knowledge of the condition of an item from routine or continuous monitoring ”, as stated in [35].
CBM is needed to guarantee the survival of a system so that incipient faults can be detected and diagnosed as early as possible. Although the possibility of failure occurrance cannot be avoided, the earlier diagnosis of an incipient fault is useful to avoid the occurrance of catestrophic failure in the system. When such fault exists, it will give some indicators (symptoms) such as excessive vibration and noise, increased temperature, oil debris, and others. These indicators carry valuable information about the state of the system, and they form the basis for CBM policy planning [36]. The technical constituents and organizational aspects in the CBM system are investigated in [37, 38]. The objective is to make the CBM strategy more accessible within the industry, and to increase technology modularization and system flexibility as well. Several standards and standardization reports were already published and have been available for the developers and customers of CBM system technology [38]. An Open System Architecture for CBM (OSA-CBM) for the organizations was presented in [39]. The architecture comprises seven layers as depicted Figure 2-1 [37]. This doctoral research focuses mainly on the fifth layer (prognostics) in this architecture.
Another version of an OSA-CBM has been presented recently in [40]. In that paper, the architecture was developed to address the need for a certain standard that handles the flow of information between the different components of the CBM system. Generally, the OSA-CBM exploits the advancements in the information and database technologies. As a consequence of utilizing such technologies, a huge volume of data are available and stored in the CBM databases. The analysis of such massive data creates new challenges to researchers and practitioners in the CBM domain.
Decision Support Prognostics Health Assessment Presentation Layer Sensor Module Signal Processing
Condition Monitoring Local or Wide Area Network
1 2 3 4 5 6 7
Figure 2-1: The seven functional layers of the OSA-CBM presented in [39]
2.2 Types of CBM data
The acquired data in the CBM system can be categorized into two main categories [3]: condition monitoring data and event data. Condition monitoring data are collected and processed to determine the system’s health condition, where the measured observations are related to the health states of the monitored system [3]. If the condition monitoring data have trends that are reflecting the degradation conditions of the system, they are called degradation data [41]. They can represent the vibration, temperature, pressure, moisture, humidity, oil debris, and others.
Event data provide the information on what happened (failure, installation, overhaul, etc.) and/or what was done (repair, preventive maintenance, oil change, etc.) to the targeted system [3]. If the event data represent the failure of the system, they are called lifetime data.
Types of condition monitoring data
Condition monitoring data are further categorized into three subcategories: waveform data, value data, and multidimensional data [3]. Waveform type data are time series measurements which are collected over a certain time interval (time record), hence they are called time-domain data. Vibration and acoustic signals are common examples of waveform type data [42]. Value type data can be measured directly from the data acquisition module at a specific time instant or through
processing the waveform data. Examples of this type of data are measures of temperature, pressure, humidity, etc. Multidimensional type data are measured at specific time instants over three or more features (dimensions). An example of such data is the infrared thermographic image [3].
In this doctoral research, the waveform data and value type data are the most relevant.
2.3 Data Mining and Knowledge Discovery in CBM
2.3.1 Big Data in CBM
There are two main problems associated with the existence of huge volumes of CBM data. First, it is reported in [43] that the amount of stored databases doubles every 20 months. Accordingly, it is difficult and sometimes impossible to deal with such amount of data in any quantitative sense (this is referred to as Big Data) [43]. Instead, the important information should be extracted from the data. Second, the CBM databases have the potential to predict the evolution of interesting events in terms of variables or trends which have not been fully exploited yet, because these huge data are not well represented.
The advancement of the software, hardware and methodological researchs have recently led to the development of flexible procedures that can be used to analyze the CBM data [9, 32, 44-46]. However, there is a need to develop a knowledge discovery procedure to deal with the CBM data in a systematic and clear way, in order to support the CBM maintenance personnel with an appropriate assessment for the health states of the monitored system.
2.3.2 Data Mining and machine learning in CBM
Data mining is defined as the process of automatic exploration and extraction of knowledge from the data [47]. Machine learning provides the technical basis of data mining. In other words, it is the technology for mining knowledge from data [43]. It relies on the availability of data and draw on learning strategies from the area of computational intelligence, pattern classification, and others [48]. The machine learning techniques are based on the concepts of training and testing.
In the context of CBM, the main objective of machine learning is to build computer programs that refine the CBM databases automatically in order to extract useful information. Then, the extracted information are then exploited to discover a set of patterns. Those patterns are representing a
valuable knowledge about the history of the system’s health states. Among the extracted patterns, some are trivial and nonsignificant, others are general and can contribute to an accurate prediction for the targeted events [43]. The patterns discovered should be meaningful and have some advantage in an economic sense. From economical point of view, one of the most important requirements for the patterns is the comprehensiveness (interpretability) [32]. Some patterns are comprehensible (also called transparent or interpretable or structural), while some are comprehensive but not necessarily comprehensible (called black box patterns) [49]. From the performance point of view, both of them can have good prediction [48].
The advantage of using the interpretable patterns in CBM is their transparency, therefore they can help the analyst and the decision maker to explain the predicted events in an explicit way.
Based on the extracted patterns, the machine learning technique maps the CBM data into a decision model, in order to produce predicted outcomes for the new observations that are not found previously in the data. Those observations are collected recently from the monitored system, and they are carrying information about its health state. The decision model can be used as either a regression or classification technique, depending on the variable of interest to be predicted. Machine learning classification techniques are further divided into supervised and unsupervised. In supervised learning, the purpose is to infer a decision model from labeled data. In unsupervised learning, the learning technique is fed with only unlabeled observations (there is no a priori label).
2.4 CBM Components
The seven layers of the OSA-CBM depicted in Figure 2-1 can be aggregated into three main procedures in the CBM [3, 20]. In this thesis, we discuss the three aggregated procedures of the CBM program presented in [3]; namely:
1. Data acquisition. 2. Data processing.
3. Maintenance decision-making (diagnosis and prognosis)
2.4.1 Data acquisition
Data acquisition is the first procedure in the CBM program. In this procedure, the data are collected by the means of transducing devices, in their raw forms. The data must be refined appropriately in
order to obtain proper measurements. The refined data will serve as the main input to the data processing procedure in the CBM program. The type of data processing algorithms and tools are dependent on the type of acquired data.
Sensing strategies
Sensors and sensing strategies constitute a major technology and foundational basis in CBM. They are intended to monitor typical state variables as vibration, temperature, pressure, speed, etc. Such variables are commonly used in CBM fault diagnostic/prognostic of machinery [20].In the case of rolling elements diagnosis/prognosis for example, vibration data are needed because they relate the trends of vibration features to the degradation and failure process of bearings [50, 51].
More specifically, some sensors are designed to measure quantities that are directly related to the failure modes which are candidates for diagnosis and prognosis [20]. Common examples of such sensors are: ultrasonic sensors, strain gauges, acoustic emission sensors, electrochemical fatigue sensors, and proximity devices [52-54]. Other sensors are designed as multipurpose sensors to monitor process variables in CBM [20]. Recently, wireless sensors have been introduced in CBM domain [55-57].
Signal conditioning
Signal conditioning is an important and required step in data acquisition procedure. The signals coming from the sensors can be very noisy, of low amplitude, and dependent on secondary variables such as temperature [20]. As a consequence, we may not be able to measure the quantity of interest but only the dependent quantity. The sensor output must be conditioned and processed to provide an appropriate measurement for the physical quantity [58]. Amplification, level translation, linearization, and filtering are fundamental signal conditioning tasks [59]. A common objective of signal conditioning is to improve the signal-to-noise ratio (SNR), in order to extract as useful as possible information from the raw data. Signal conditioning may be carried out with hardware or software. There is a variety of integrated circuits available for hardware signal conditioning. The signal conditioning in software is carried out much more efficiently and accurately, and this eliminates the need for difficult hardware calibrations [58].
2.4.2 Data processing
Data processing is the second procedure in the CBM [3]. In this procedure, the data acquisition module feeds the CBM system with the acquired signals, in order to process and extract the relevant
features as a first step [60]. The second step in data processing procedure is the feature selection step. In feature selection step, the purpose is twofolds, firstly, to select the optimal number of features that reduces the dimensionality of feature space and secondly, to select the superior features that improve the performance of the CBM decision making procedure [48].
a-Feature extraction
Generally, it is difficult to assess the health states of complex systems directly from the measured time-domain data. Those data are collected by the data acquisition module and are not useful in their raw forms. The acquired data must be preprocessed appropriately, to extract useful information that represent a reduced version of the original data, but preserve as much as possible some characteristic features [48, 61]. In the practice, it is useful to extract some features from these time-domain data as good representatives of state changes in the system being monitored [31]. These features are the indicators for the faulty events we are seeking to detect, isolate, and predict [20].
For multidimensional type data, feature extraction using image processing is more complicated than that of waveform signal, due to the higher dimensionality involved. The resulting feature space after processing an image is a high dimensional space, since it represents all the constituent pixels in the image. Increasing the dimensionality of such space makes the training data sparse. This is a common problem in pattern recognition literature, it is known as curse of dimensionality [61]. The higher dimensionality leads to poor generalization (known as overfitting problem), and therefore decreases the performance of the decision model [48, 61].
One way to deal with such problem is to apply some processing techniques such as: principal component analysis (PCA) [62], Fisher discriminant analysis (FDA) [63], and independent component analysis (ICA) [64], to reduce the dimensionality of the feature space, while keeping the classification accuracy [48, 61]. In the context of CBM, other examples of processing techniques are presented in [65, 66].
In case of waveform type data, processing techniques such as time–domain analysis, frequency– domain analysis, and time–frequency analysis are the most applicable [3]. Since this type of data is involved in this doctoral research, descriptions of these analysis techniques will be discussed briefly in this thesis, in the following.
![Figure 1-1: Taxonomy of maintenance strategies as presented in [2]](https://thumb-eu.123doks.com/thumbv2/123doknet/2345149.34706/24.918.134.789.636.1035/figure-taxonomy-maintenance-strategies-presented.webp)
![Figure 2-1: The seven functional layers of the OSA-CBM presented in [39]](https://thumb-eu.123doks.com/thumbv2/123doknet/2345149.34706/35.918.208.711.104.465/figure-seven-functional-layers-osa-cbm-presented.webp)
![Figure 2-3: Model-based and data-driven approaches as presented in [20]](https://thumb-eu.123doks.com/thumbv2/123doknet/2345149.34706/50.918.215.678.432.802/figure-model-based-data-driven-approaches-presented.webp)