HAL Id: hal-02790186
https://hal.inrae.fr/hal-02790186
Submitted on 5 Jun 2020HAL is a multi-disciplinary open access
archive for the deposit and dissemination of sci-entific research documents, whether they are pub-lished or not. The documents may come from teaching and research institutions in France or abroad, or from public or private research centers.
L’archive ouverte pluridisciplinaire HAL, est destinée au dépôt et à la diffusion de documents scientifiques de niveau recherche, publiés ou non, émanant des établissements d’enseignement et de recherche français ou étrangers, des laboratoires publics ou privés.
data in selection for feed efficiency
. Wur, . Topigs Norsvin, . Inra
To cite this version:
. Wur, . Topigs Norsvin, . Inra. Methodologies to account for crossbred and genomic data in selection for feed efficiency. [Contract] D5.4, 2020. �hal-02790186�
Page 1/20
FEED-A-GENE
Adapting the feed, the animal and the feeding techniques to
improve the efficiency and sustainability of monogastric livestock
production systems
Deliverable D5.4
Methodologies to account for
crossbred and genomic data in
selection for feed efficiency
Due date of deliverable: M60
Actual submission date: M59
Start date of the project: March 1
st, 2015
Duration: 60 months
Organisation name of lead contractor: DLO
Revision: V1
Dissemination level
Public – PU
x
Confidential, only for members of the consortium (including Commission
Services) - CO
Page 2/20
Table of Contents
1.
Summary ... 3
2.
Introduction ... 5
3.
Results ... 7
3.1
Additive and dominance variance components ... 7
3.2
The purebred-crossbred correlation (r
pc) ... 8
3.3
Optimal genomic prediction models for crossbreeding... 9
3.4
Newly proposed selection strategies for feed efficiency ... 11
4.
Conclusions ... 17
5.
References ... 18
Page 3/20
1. Summary
Objectives
The general objective of this work was to develop methodologies to account for crossbred and genomic data for a sustainable selection for feed efficiency. These activities were essentially developed in task 5.4 of the Feed-a-Gene project.
Specifically, we have worked on three main topics of research:
1. Assess the contribution of the additive and dominance genetic effects to the phenotype expression of several traits, especially those related to feed efficiency, within crossbred and purebred animals, and the genetic correlation to the corresponding traits between the two populations,
2. Identify optimal genomic prediction models, both in terms of efficiency in calculations and accuracy of estimates, that enable unbiased and accurate estimation of the genetic parameters and genomic breeding values that are required for implementation in practice, 3. Combine all available and newly generated knowledge in terms of genetic variances and
economic values to propose a new index to improve feed efficiency.
Rationale:
Selection to improve feed efficiency in monogastrics has been practiced for several decades, despite the practical difficulties and costs related to routinely measuring feed intake and efficiency on a large scale. These selection strategies so far have mostly been based on measured feed intake and efficiency on purebred animals, because selection takes place within purebred lines. The breeding goal, however, is to improve feed efficiency in the crossbred production animals. Strategies to select purebred selection candidates based on performance measured on crossbred offspring or relatives have been proposed previously, but linking crossbred performance back to the purebred animals was often challenging, while the links were relatively weak. Genomic selection is the state-of-the-art selection approach that is used in modern breeding programs. The previously described limitations can be overcome by using genomic selection of purebred animals, based on a crossbred training population. This requires genomic prediction models that can compute genomic breeding values for purebred animals for crossbred performance. In such models, it is important to appropriately model the crossbred and purebred animals relative to each other. From the research undertaken in Task 5.4 of Feed-a-Gene, as well as from recently published research, a straightforward genomic prediction model that models at least one so-called metafounder for each of the parental lines, appears to be the most appropriate choice. Such a model provides genomic breeding values with accuracies similar to those obtained with more sophisticated models and similar or less bias than other models, while being one of the most computationally efficient models.
Using genomic information in the estimation of breeding values provides the opportunity to explicitly model dominance deviations, next to the traditional additive breeding values. It was expected that explicitly modelling dominance deviations is especially relevant in crossbreeding, where the crossbred performance partly relies on heterosis, which is mainly caused by dominance effects. Within Task 5.4 of Feed-a-Gene, an empirical study was conducted that showed that 6-12% of the phenotypic variance of feed efficiency related traits in pigs is caused by dominance effects, while 18-30% is caused by
Page 4/20
additive effects. Based on these results, as well as recent studies that investigated the impact of explicitly modelling dominance deviations in genomic prediction models, it is concluded that the potential benefits from accounting for dominance is likely to be relatively small for improving feed efficiency and growth.
In WP5, several new traits and characteristics have been proposed and investigated, that have some relationship with feed intake and/or efficiency, and that may be easier to record than feed intake or efficiency itself. For each of those traits, the question is whether breeding programs in practice should consider measuring those and selecting on them. Therefore, the ultimate approach, as defined in Task 5.4, was to evaluate new selection indices, including those new traits. We showed that selection response for crossbred feed efficiency can be increased by: including an economic weight for the crossbred rather than the purebred trait, adding crossbred information for traits not measured directly on purebred selection candidates, and additionally adding indicator traits, of which especially digestibility, feeding behaviour, and biomarkers are beneficial. Including genomic prediction is also recommended, however this would require investment to maintain a reference population of crossbred pigs.
Teams involved:
Stichting DLO, Wageningen University & Research Centre (DLO), The Netherlands Topigs Norsvin, The Netherlands
Institut National de la Recherche Agronomique (INRA – GenPhySE), France
Species and production systems considered:
The results of this deliverable are mostly applicable to pigs, poultry, and rabbits, as the common production systems of these species commonly rely on crossbreeding. Throughout, the main focus is on pigs, as most information is available and generated in WP5 for this species, but illustrations for the broiler case are added in a few places. All 3- or 4-way crossbred production systems could benefit from these results, provided that data and (genomic) tools are available.
Page 5/20
2. Introduction
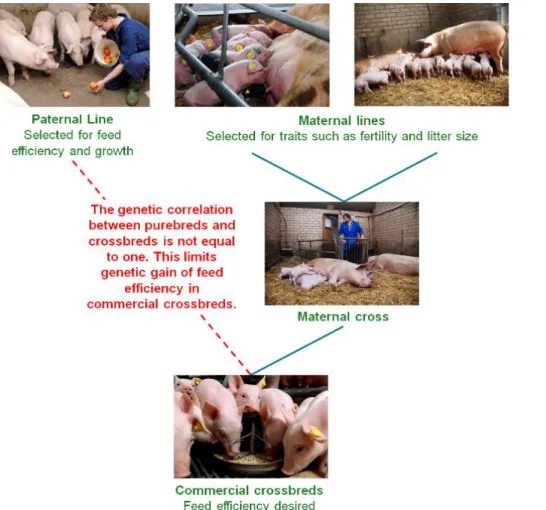
Pigs and poultry production schemes rely on crossbreeding, where the production animals are crossbred (CB) animals (Figure 1). Thus, the breeding goal for these species is to increase CB performance under commercial farming conditions, while selection of purebred (PB) animals typically is based on PB performance measured in a nucleus environment with high levels of biosecurity. The genetic differences between PB and CB performance is quantified by the purebred-crossbred genetic correlation (rpc), which is typically below unity for many traits, with average reported values in the range of 0.6 to 0.8 for pigs (Wientjes and Calus, 2017) and poultry (Bos, 2020). When genetic correlations between PB and CB performances differ from unity, the genetic gain reached at the nucleus level is only partly transferred to the production level as a correlated response. One approach to overcome this issue is to account for CB information (i.e., genetic and phenotypic data) in the genetic evaluations of the PB lines to select them for improving CB rather than PB performance.
Figure 1. A schematic overview of a breeding scheme in pigs, where the commercial animals are
crossbreds.
Selection for feed efficiency and related traits has been common practice in pigs (Knap and Wang, 2012) and poultry (Neeteson-van Nieuwenhoven et al., 2013) for more than 30 years. Measuring feed efficiency involves measuring all feed consumed during a predefined period of time, for instance typically 10 days for broilers, and the weight of the animals both at the beginning and the end of this period. With this information, the feed efficiency can be computed as the growth divided by the total amount of feed consumed in this period. The feed conversion ratio, commonly used in these livestock
Page 6/20
productions to quantify efficiency, is the inverse of feed efficiency. Feed efficiency is typically measured on PB selection candidates, and is laborious, because it requires weighing both the feed and the animals. As for other traits, this trait in PB animals is not necessarily the same as in CB animals. In addition, because of the costs involved, an important question is whether it is possible to improve feed efficiency by indirect selection on correlated traits.
Therefore, the overall objective of this deliverable is to gather methodologies developed in the Feed-a-Gene project to account for CB and genomic data for a sustainable selection for feed efficiency. To address this objective, we divided our research in three main topics:
Dissecting genetic variance into its additive and dominance genetic components and PB-CB genetic correlation
The extent to which PB selection can change a CB trait depends strongly on the partitioning of the phenotypic variance, and the purebred-crossbred genetic correlation (rpc). Here, we dissected the total genetic variance of several traits in pigs into additive and dominance components, and did this both for PB and CB pigs. Expected values of the rpc were derived by reviewing the available literature for pigs and poultry.
Optimal genomic prediction models for crossbreeding
Including information of CB animals in genomic prediction models implies that multiple breeds are combined in one analysis, while the CB animals themselves are a mixture of different breeds. An important challenge is to separate out the effects of the different breeds involved in the CB animals, and to make sure that each of those are computed relative to an appropriate base. In previous research, it was observed that considering the breed-origin-of-alleles of CB animals was beneficial only in some specific situations, while computations became considerably more cumbersome (Sevillano, 2018). In this task, we investigated the possibility to implement the metafounder approach instead (Legarra et al., 2015), which enables to properly scale the bases of different breeds relative to each other.
Newly proposed selection strategies for feed efficiency
The ultimate activity of this task was to combine all generated results within this task, together with indicators of e.g. welfare, robustness, product quality, and digestibility (Tasks 5.1 and 5.3), to propose new selection strategies for feed efficiency. Here, the approach taken was to first collect and summarize phenotypic, genetic, and economic parameters from the traits defined in previous tasks (5.1-5.3). Additional traits were added from published literature and parameters estimated from datasets made available within Feed-a-Gene. It was important to collect as much information available on correlations between PB and CB traits. Some correlations between the new traits or between CB and PB needed to be approximated. The parameters were then combined in a selection index, which weighs the sources of information to maximize the genetic gain of the traits in the breeding objective. In this case feed conversion ratio was considered to be the main breeding objective, as it is a measure of feed efficiency and currently widely used in breeding programs. The index was tested with various combinations of information sources and breeding objectives, to provide sensitivity and importance of the new traits. All indices followed the principles outlined by Hazel (1943), and were built using the program SelAction (Rutten et al., 2002).
Page 7/20
3. Results
3.1
Additive and dominance variance components
Variance components, including the additive genetic variance, the heritability, and genetic correlations between traits, are important to predict possible response to selection in all breeding goal traits, and other traits related to those. The breeding goal in pigs and poultry typically is to improve CB performance, which enables to benefit from breed complementarity between parental lines, as well as heterosis (i.e., the greater performance displayed by the CB individuals compared to the mean of the parental performances). It has been widely accepted that heterosis is mostly due to dominance (e.g. Shull, 1908). Dominance arises from the interaction between alleles at the same locus and cannot be inherited. However, if these non-additive genetic effects are properly accounted for in genetic evaluations, they can increase the goodness of fit of the model and should consequently lead to an improvement in the prediction accuracy of the estimated genomic breeding values. In addition, increasing the contribution of dominance at the CB level would directly increase heterosis and thus CB performance. Crossbred animals benefit more from positive effects of dominance than purebreds do, because CB animals have a higher level of heterozygosity. In terms of variance components, therefore, the amount of variance that is explained by dominance deviations, that is a non-heritable component of the genetic variance, is important for pig and poultry CB production. Using genomic information allows a much easier modelling and more powerful experimental design to estimate dominance genetic effects compared to using pedigree information, as individual genotypes at each locus become available for modelling.
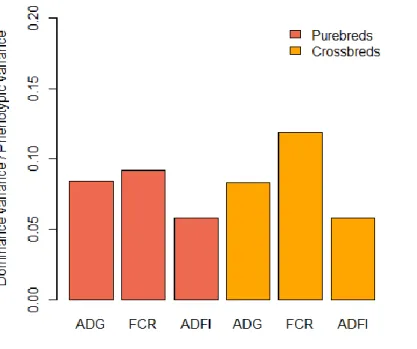
In this task, using genomic models we have estimated how the total genetic variance is partitioned into its additive and non-additive components in 22 PB (Piétrain) and CB (Piétrain x Large White) pig traits. The analysed traits can be classified into five groups: growth rate and feed efficiency, carcass composition, meat quality, behaviour, and boar taint and puberty. Additive and dominance variances were estimated in univariate genomic models (Vitezica et al., 2016), including a genomic inbreeding covariate. Despite the uncertainty of the estimates because of model complexity and the limited amount of data available, it gives a good picture about the influence of dominance variance in the phenotypic expression in a wide range of traits of different nature, including those related to growth and fee efficiency (Tusell et al., 2019). For the traits of interest in this project (i.e., average daily gain, average daily feed intake, and feed conversion ratio), the dominance genetic variance explained 6-12% of the phenotypic variance in PB and CB, while the additive genetic variance explained 18-30% (Figure 2). These results suggest that the potential benefits from accounting for dominance mentioned above may be relatively small for improving feed efficiency and growth.
Page 8/20
Figure 2. Ratios of dominance deviation variance to phenotypic variance estimated for average daily
gain (ADG), feed conversion ratio (FCR) and average daily feed intake in purebred and crossbred pig populations. Results obtained from Tusell et al. (2019).
3.2
The purebred-crossbred correlation (r
pc)
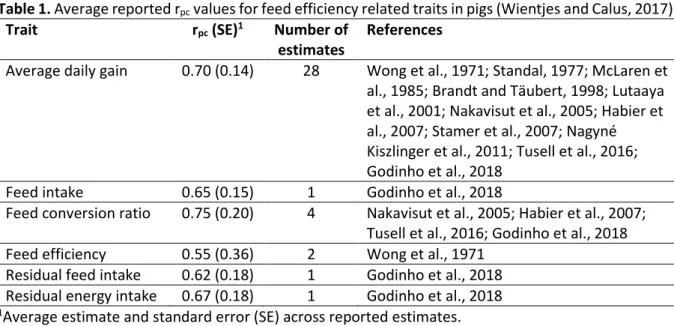
In pigs, 11 studies estimated in total 28 rpc values for average daily gain, and five studies estimated in total nine rpc values for traits related to feed (Table 1). Average rpc values all fell in the range of 0.55 to 0.70, and thus are considerably lower than 1. In broilers, only rpc estimates are available for body weight, with an average value of ~0.75, but not for any trait related to feed (Bos, 2020). These reported rpc values suggest that feed efficiency related traits indeed are different traits in crossbreds compared to purebreds, and that use of crossbred information is warranted to improve accuracy of genomic selection for feed efficiency in crossbred pigs, and probably also in crossbred broilers.
Page 9/20
Table 1. Average reported rpc values for feed efficiency related traits in pigs (Wientjes and Calus, 2017).
Trait rpc (SE)1 Number of
estimates
References
Average daily gain 0.70 (0.14) 28 Wong et al., 1971; Standal, 1977; McLaren et al., 1985; Brandt and Täubert, 1998; Lutaaya et al., 2001; Nakavisut et al., 2005; Habier et al., 2007; Stamer et al., 2007; Nagyné Kiszlinger et al., 2011; Tusell et al., 2016; Godinho et al., 2018
Feed intake 0.65 (0.15) 1 Godinho et al., 2018
Feed conversion ratio 0.75 (0.20) 4 Nakavisut et al., 2005; Habier et al., 2007; Tusell et al., 2016; Godinho et al., 2018 Feed efficiency 0.55 (0.36) 2 Wong et al., 1971
Residual feed intake 0.62 (0.18) 1 Godinho et al., 2018 Residual energy intake 0.67 (0.18) 1 Godinho et al., 2018 1Average estimate and standard error (SE) across reported estimates.
3.3
Optimal genomic prediction models for crossbreeding
Future genomic evaluation models to be used routinely in breeding programs for pigs and poultry need to be able to optimally use information of CB animals to predict breeding values for purebred selection candidates. Crossbred information is important given that the rpc is <1 for most traits (see section 3.2). In addition, because genomic evaluations are run at least once a week in most breeding companies, the computation efficiency of the proposed model is of major importance.
Accuracy & bias
Both from the work in Task 5.4 and related projects, combined with recent literature, four different models have been identified that are potentially suitable (see description in Table 2), and compared in terms of accuracy, bias and efficiency. The simplest model ignores the differences between lines (GBLUP_gen). Xiang et al. (2017) show that the accuracy of ssGBLUP with metafounders (ssGBLUP_mf) is similar to the accuracy of ssGBLUP_BOA, which requires phasing to assign breed-of-origin of alleles in CB animals. Results from Sevillano et al. (2017) show that GBLUP_BOA typically gives similar results as GBLUP_gen and GBLUP_spec, and perhaps only has some advantage for low heritability traits. Accurately assigning breed-of-origin is possible (Vandenplas et al., 2016; Calus et al., 2019), regardless whether using pedigree data or not (Sevillano et al., 2016) but this step is quite time consuming.
Table 2. Descriptions and comparison of models for the prediction of CB performance.
Abbreviation Model description Accuracy Bias* Efficiency
GBLUP_gen Ignoring differences between lines + + ++
GBLUP_spec Using line-specific allele frequencies + + ++
GBLUP_mf Using metafounders + ++ ++
GBLUP_BOA Line-specific partial relationships + + -
*The bias is measured as the regression coefficient of true on estimated breeding values.
Using metafounders in a GBLUP model has been studied using a simulation study in Feed-a-Gene (van Grevenhof et al., 2019). Results show that the accuracies of GEBVs obtained using 60K-like SNP panels and pedigree information were very similar, when using metafounders or not (Figure 3a). These results were confirmed in empirical analyses using layer chicken data (Vandenplas et al., 2017). Theoretically,
Page 10/20
using metafounders also solves problems which are generally present in practical data. For instance, using metafounders generalises the concept of genetic groups when non-zero relationships exist between populations, and handles those in a robust way, without assuming or entering any foreknowledge or information in the model description.
Figure 3a. GEBV prediction accuracies in GBLUP
models with versus without implementation of metafounders (mf) for populations with closely related and unrelated pedigrees in PB and CB populations. Red bars represent models with mf.
Figure 3b. Convergence criteria of GBLUP
models with versus without implementation of metafounders (mf) for populations with closely related and unrelated pedigrees. Red bars represent models with mf.
Efficiency
The use of metafounders in GBLUP_mf gives a model that has similar or somewhat better convergence properties compared to other models (Figure 3b). Additional computations for the GBLUP_spec and GBLUP_mf models, relative to GBLUP_gen, are trivial. The GBLUP_BOA, in contrast, requires additional computations to derive line-origin-of-alleles and to obtain separate partial relationships matrices per line (Christensen et al., 2015). Thus, in terms of computational efficiency, GBLUP_mf is very competitive as it is equally efficient as standard models in terms of computations required to set up the model, while it also seems more efficient in terms of model convergence.
Dominance
As stated above, improved performance of CB animals is partly due to heterosis. One of the major genetic bases of heterosis is dominance. Recently, it was shown that including dominance in the model tends to yield a more robust model (Duenk et al., 2017). Empirical analyses, however, showed that inclusion of dominance in the GBLUP model does not improve predictive ability for CB animals, whereas inclusion of inbreeding depression does (Xiang et al., 2016). At the same time, inclusion of dominance doubles the number of effects to be estimated in the model, while the added complexity to include inbreeding depression is trivial. Given the moderate to low amount of dominance genetic variance estimated for growth and feed efficiency traits (see section 3.1), including dominance deviation effects in genetic evaluations is not advisable.
Page 11/20
Which data to record in practical scenarios?
Considering the expected benefit of using crossbred information in breeding programs to improve feed efficiency for pigs and poultry, an important question is which kind of data needs to be recorded from CB animals. Is it sufficient to record crossbred phenotypes, or should the crossbred animals also be genotyped? Many breeding programs may have a preference to limit genotyping as much as possible to selection candidates, and thus to PB animals. A comprehensive simulation study in broilers showed that with an rpc value of 0.9 it is not beneficial to phenotype CB animals (Chu et al., 2018). When the rpc is 0.5 to 0.7, including the range of observed rpc values for feed related traits in pigs (Table 1), it was optimal to collect 30% of the phenotypes from CB animals, and also to spend 30% of the genotyping effort on CB animals. This suggests that in practical breeding programs, the optimal approach is to spread both the phenotyping and genotyping effort across PB and CB animals. Thus, the optimal genomic evaluation model should be able to include both PB and CB animals. The genomic prediction model that includes at least one metafounder for each parental line can easily include both PB and CB animals, regardless whether all animals with phenotypes are genotyped or not.
3.4
Newly proposed selection strategies for feed efficiency
Past and current selection strategies for CB performance have not accounted for the fact that the rpc (the genetic correlation between CB and PB traits) is not equal to one. While the breeding goal has been for improved feed efficiency of CB pigs, the sources of information and the weight in selection indices have been for PB pigs. The first comparison that we made was between two selection indices. Both indices had the traits Feed Conversion Ratio (FCR), Average Daily Gain (ADG), and Daily Feed Intake (DFI) recorded only on PB animals. However, the economic weights for FCR and ADG were placed either on the PB or CB trait. Some of the most recent published economic values for feed efficiency traits were used (Ali et al., 2017). The economic values for ADG and FCR are calculated with a correction for cost of feed and DFI. So the economic value for DFI is already added indirectly, and if an economic value was also placed on DFI directly the cost of feed would be double counted. This has been a common problem when calculating economic values for feed efficiency and other ratio traits in breeding programs (Gunsett, 1984; Goddard, 1998).
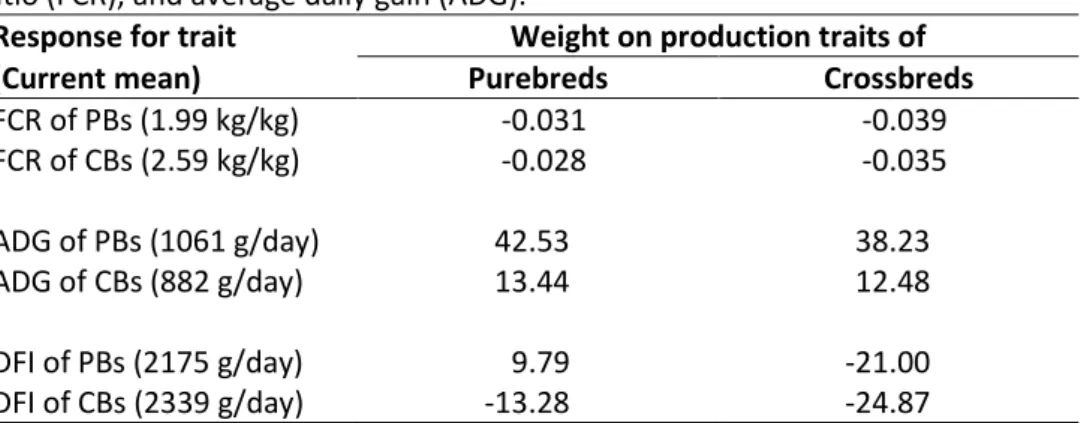
Simply by shifting the weight of selection from PB traits to CB traits there are considerable improvements to FCR of CB animals (Table 3). There is a 25% improvement in CB FCR, 87% improvement to DFI, and a small 7% unfavourable change to ADG. All following indices continue to use economic weights on the CB traits ADG and FCR, with recording of PB traits on FCR, ADG, and DFI, this is henceforth referred to as the “Base index”.
Page 12/20
Table 3. Response to feed efficiency traits when adding economic weights to PB or CB feed conversion
ratio (FCR), and average daily gain (ADG).
Response for trait Weight on production traits of
(Current mean) Purebreds Crossbreds
FCR of PBs (1.99 kg/kg) -0.031 -0.039 FCR of CBs (2.59 kg/kg) -0.028 -0.035 ADG of PBs (1061 g/day) 42.53 38.23 ADG of CBs (882 g/day) 13.44 12.48 DFI of PBs (2175 g/day) 9.79 -21.00 DFI of CBs (2339 g/day) -13.28 -24.87
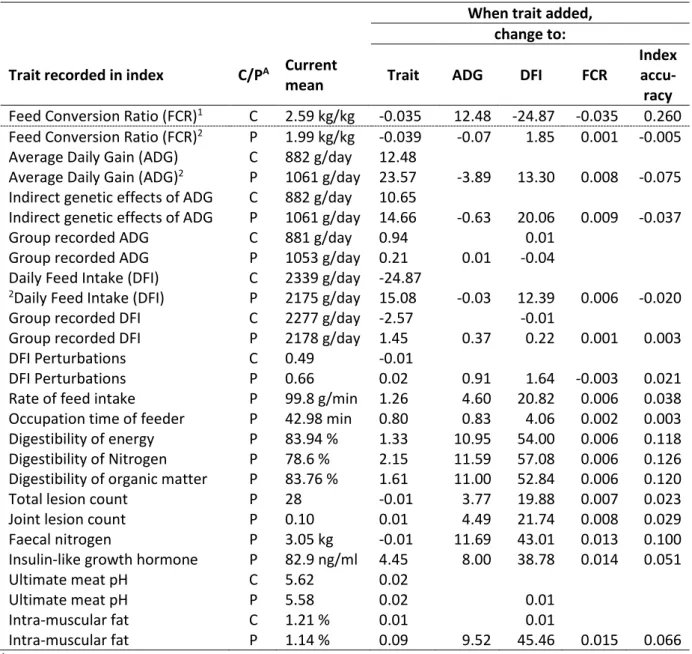
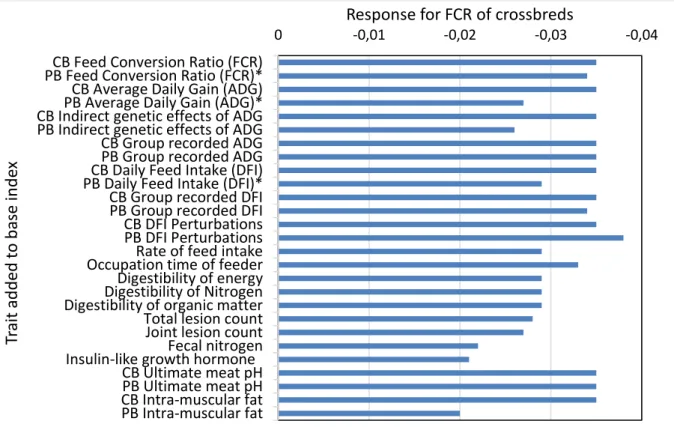
To test the potential of the new traits developed in Feed-a-Gene, they were each individually added to the base index (Table 4). Having records for crossbred traits (including both old and new traits), they did not appear to have a large impact on crossbred feed efficiency traits or index accuracy. This is most likely because the crossbred traits were recorded as parental EBVs rather than own records as purebred animals would not have these traits recorded. The digestibility traits tend to have the largest improvement to the index accuracy, followed by the biomarkers (i.e., faecal nitrogen and insulin-like growth hormone). The production, perturbation, and meat quality traits had the largest or no change to FCR (Figure 4). The largest improvements to DFI and ADG were observed with biomarkers, digestibility, meat quality, and perturbation traits.
Page 13/20
Table 4. Expected changes to feed efficiency traits, when adding new traits to the base index. When trait added,
change to: Trait recorded in index C/PA Current
mean Trait ADG DFI FCR
Index
accu-racy
Feed Conversion Ratio (FCR)1 C 2.59 kg/kg -0.035 12.48 -24.87 -0.035 0.260 Feed Conversion Ratio (FCR)2 P 1.99 kg/kg -0.039 -0.07 1.85 0.001 -0.005 Average Daily Gain (ADG) C 882 g/day 12.48
Average Daily Gain (ADG)2 P 1061 g/day 23.57 -3.89 13.30 0.008 -0.075 Indirect genetic effects of ADG C 882 g/day 10.65
Indirect genetic effects of ADG P 1061 g/day 14.66 -0.63 20.06 0.009 -0.037
Group recorded ADG C 881 g/day 0.94 0.01
Group recorded ADG P 1053 g/day 0.21 0.01 -0.04 Daily Feed Intake (DFI) C 2339 g/day -24.87
2Daily Feed Intake (DFI) P 2175 g/day 15.08 -0.03 12.39 0.006 -0.020
Group recorded DFI C 2277 g/day -2.57 -0.01
Group recorded DFI P 2178 g/day 1.45 0.37 0.22 0.001 0.003
DFI Perturbations C 0.49 -0.01
DFI Perturbations P 0.66 0.02 0.91 1.64 -0.003 0.021
Rate of feed intake P 99.8 g/min 1.26 4.60 20.82 0.006 0.038 Occupation time of feeder P 42.98 min 0.80 0.83 4.06 0.002 0.003 Digestibility of energy P 83.94 % 1.33 10.95 54.00 0.006 0.118 Digestibility of Nitrogen P 78.6 % 2.15 11.59 57.08 0.006 0.126 Digestibility of organic matter P 83.76 % 1.61 11.00 52.84 0.006 0.120
Total lesion count P 28 -0.01 3.77 19.88 0.007 0.023
Joint lesion count P 0.10 0.01 4.49 21.74 0.008 0.029
Faecal nitrogen P 3.05 kg -0.01 11.69 43.01 0.013 0.100
Insulin-like growth hormone P 82.9 ng/ml 4.45 8.00 38.78 0.014 0.051
Ultimate meat pH C 5.62 0.02
Ultimate meat pH P 5.58 0.02 0.01
Intra-muscular fat C 1.21 % 0.01 0.01
Intra-muscular fat P 1.14 % 0.09 9.52 45.46 0.015 0.066
ATrait recorded on CB or PB pigs. Note that if it recorded on CB pigs, the parental average EBV is used as it is not possible to have an own record.
1Changes are relative to crossbred FCR, adding crossbred FCR to the base index had no change
2Since the base selection index includes FCR, ADG, and DFI of PB traits, the results presented are for when these traits are removed from the base index.
Page 14/20
Figure 4. Change to crossbred feed conversion ratio when new traits are added to the base index.
Crossbred; CB, Purebred; PB. (*The response in FCR if the trait is removed from the index is presented, for the traits already in the base index.)
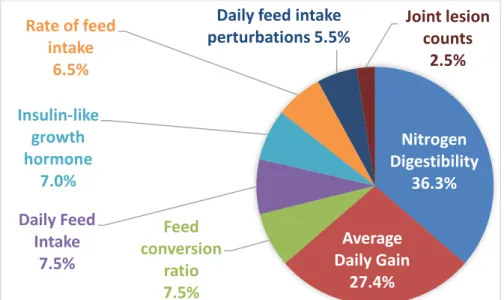
Most of the traits have some benefit to a selection index for feed efficiency of CB pigs. The traits that appear to have the largest impact were included in a larger multi-trait selection index, based on the response to FCR, ADG, and DFI of CB animals, improvements to index accuracy, and the accuracy of the available parameter estimates (not presented). By removing one trait and then returning it to the index, the change in index accuracy can be used to determine the contribution each trait makes to the index (Figure 5). Also included were group recorded daily feed intake and intra-muscular fat, but they made no contribution to the index. Nitrogen digestibility makes a significant contribution (36.3%), as well as the feed efficiency traits ADG (27.4%), DFI (7.5%), and FCR (7.5%).
-0,04 -0,03
-0,02 -0,01
0 CB Feed Conversion Ratio (FCR) PB Feed Conversion Ratio (FCR)* CB Average Daily Gain (ADG) PB Average Daily Gain (ADG)* CB Indirect genetic effects of ADG PB Indirect genetic effects of ADG CB Group recorded ADG PB Group recorded ADG CB Daily Feed Intake (DFI) PB Daily Feed Intake (DFI)* CB Group recorded DFI PB Group recorded DFI CB DFI Perturbations PB DFI Perturbations Rate of feed intake Occupation time of feeder Digestibility of energy Digestibility of Nitrogen Digestibility of organic matter Total lesion count Joint lesion count Fecal nitrogen Insulin-like growth hormone
CB Ultimate meat pH PB Ultimate meat pH CB Intra-muscular fat PB Intra-muscular fat
Response for FCR of crossbreds
Tr
ait
ad
d
ed
t
o
b
ase
in
d
ex
Page 15/20
Figure 5. Contribution of each trait (recorded on purebreds only) to the expanded selection index.
Adding traits does not always increase accuracy of the index or response to selection, due to parameters being an estimate with associated errors (Hayes and Hill, 1980). When adding genomic prediction of CBs it is no longer useful to include FCR recorded on PBs therefore it was removed from the index (Figure 6). Adding genomic prediction caused some redistribution of trait contributions, notably was the decrease in the contribution by Nitrogen digestibility.
Figure 6. Contribution of each trait (recorded on purebreds only) to the expanded selection index, with
genomic prediction added (for which a reference population of crossbreds would need to be maintained).
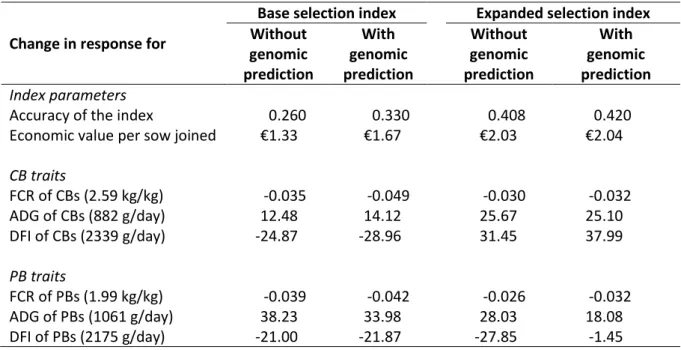
Adding new traits defined in Feed-a-Gene in an expanded index improves selection for CB feed efficiency (Table 5). Information from the new traits in Feed-a-Gene improves both the accuracy of the index (allowing for faster rates of gain), and the economic value of the index (the added value comes from a large increase in ADG at the expense of a small decrease in response to FCR). The increase in DFI is because no economic weight is placed on the trait directly, as FCR and ADG are estimated corrected for DFI, if breeders wish to force a decrease in DFI, they would need to balance the economic weights for the three traits, but the method used here would optimize total feed efficiency. Adding
Nitrogen
Digestibility
36.3%
Average
Daily Gain
27.4%
Feed
conversion
ratio
7.5%
Daily Feed
Intake
7.5%
Insulin-like
growth
hormone
7.0%
Rate of feed
intake
6.5%
Daily feed intake
perturbations 5.5%
Joint lesion
counts
2.5%
Average
Daily Gain
46.9%
Genomic
prediction of
crossbred FCR
29.6%
Insulin-like
growth
hormone
5.2%
Daily Feed
Intake
4.2%
Rate of feed
intake
3.3%
Joint lesion
counts
3.3%
Daily feed intake
perturbations 2.8%
Nitrogen
Digestibility
2.8%
Intra-muscular
fat
1.9%
Page 16/20
genomic prediction for FCR of CB animals has the largest improvement to the accuracy of the index and response to FCR, observed in both the base index and expanded index.
Table 5. Expected changes to the index. Change in response for
Base selection index Expanded selection index Without genomic prediction With genomic prediction Without genomic prediction With genomic prediction Index parameters
Accuracy of the index 0.260 0.330 0.408 0.420
Economic value per sow joined €1.33 €1.67 €2.03 €2.04
CB traits FCR of CBs (2.59 kg/kg) -0.035 -0.049 -0.030 -0.032 ADG of CBs (882 g/day) 12.48 14.12 25.67 25.10 DFI of CBs (2339 g/day) -24.87 -28.96 31.45 37.99 PB traits FCR of PBs (1.99 kg/kg) -0.039 -0.042 -0.026 -0.032 ADG of PBs (1061 g/day) 38.23 33.98 28.03 18.08 DFI of PBs (2175 g/day) -21.00 -21.87 -27.85 -1.45
Considering an average herd of 250 sows, a farmer that uses boars selected using the base index would add €332.5 (250 x €1.33) gross profit per generation. With the expanded index this increases to €507.5 (250 x €2.03). Adding genomic prediction would add €417.5 and €510.0 gross profit per generation, for the base and expanded index, respectively. These changes highlight that implementing genomic prediction increases the gross profit when the base selection index is the starting point, while genomic prediction adds very little if the expanded selection index is already implemented. It is important to note that the changes indicated in Table 5 are additive, cumulative, and permanent, assuming the breeding objective is unchanged. Further work would be needed to determine the net profit, as the cost for genomic prediction and recording of the new traits is not included in this analysis.
The indices presented are comparable because the same economic weights have been used. We have assumed the breeding objective is to maximize the response for feed efficiency of CB pigs. Any index can be refined by adding economic weights for the new traits or to force traits in a desired direction (such as reducing DFI), but this would require to estimate the economic weights for those traits, as these are currently not available.
In conclusion, any new selection strategy for CB feed efficiency should include an economic weight for the CB rather than the PB trait. Given the traits used in this analysis, adding information recorded on CBs is beneficial only if traits from the same category are not recorded on the individual selection candidates. New selection indices should consider adding the new traits described by previous Feed-a-Gene tasks, as they do improve the response to selection of feed efficiency. Which traits to add is dependent on the cost of recording and ability to record phenotypes. However, traits from the following categories are likely to have the largest response in feed efficiency: digestibility, feeding behaviour, and biomarkers. Including genomic prediction is also recommended, however this would require investment to maintain a reference population of CB pigs.
Page 17/20
4. Conclusions
The results generated by the research in Task 5.4 of Feed-a-Gene showed that the phenotypic variance in feed efficiency related traits explained by dominance effects is relatively limited, and it is therefore expected that considering dominance effects will have a limited impact on achieved selection response. Evaluation of published estimated for rpc, the genetic correlation between PB and CB performance, showed that this parameter typically has values between 0.55 and 0.70 for feed efficiency related traits in pigs. Using those parameters in selection index calculations, we showed indeed that using crossbred information in breeding programs can considerably increase the selection response for CB feed efficiency related traits. To accommodate the use of CB information, both phenotypes and genotypes, in genomic prediction, we advise to use a model that includes at least one metafounder for each parental line involved in the crossbred production animals. Such a model is computationally efficient, and yields competitive accuracy and possibly less bias compared to alternative models.
Starting from a base selection index, implementation of genomic prediction is predicted to every year increase gross profit per sow by €0.34. Moreover, including additional traits in the index, measured on purebred selection candidates, especially digestibility, feeding behaviour, and biomarkers, is predicted to every year increase gross profit per sow by €0.70. Once these additional traits are included in the expanded index, then implementation of genomic prediction hardly adds additional genetic gain. Before deciding whether to implement genomic selection, the expanded index, or a combination of both, the reported expected changes in gross profit still need to be adjusted for the costs of genomic prediction and recording of the new traits to evaluate changes in net profit.
Page 18/20
5. References
Bos, J. (2020). Genetic correlation between purebred and crossbred broilers and layers. BSc thesis, Wageningen University, Wageningen.
Brandt, H. and H. Täubert (1998). Parameter estimates for purebred and crossbred performances in pigs. J. Anim. Breed. Genet. 115:97-104.
Calus, M.P.L., J. Vandenplas, I. Hulsegge, R. Borg, J.M. Henshall, and R. Hawken (2019). Assessment of sire contribution and breed-of-origin of alleles in a three-way crossbred broiler dataset. Poult. Sci. 98:6270-6280.
Christensen, O., A. Legarra, M. Lund, and G. Su (2015). Genetic evaluation for three-way crossbreeding. Genet. Sel. Evol. 47:98.
Chu, T.T., S.W. Alemu, E. Norberg, A.C. Sørensen, J. Henshall, R. Hawken, and J. Jensen (2018). Benefits of testing in both bio-secure and production environments in genomic selection breeding programs for commercial broiler chicken. Genet. Sel. Evol. 50:52.
Duenk, P., M.P.L. Calus, Y.C.J. Wientjes, and P. Bijma (2017). Benefits of dominance over additive models for the estimation of average effects in the presence of dominance. G3 (Bethesda). 7:3405-3414.
Goddard, M.E. (1998). Consensus and debate in the definition of breeding objectives. J. Dairy Sci. 81:6-18.
Godinho, R.M., R. Bergsma, F.F. Silva, C.A. Sevillano, E.F. Knol, M.S. Lopes, P.S. Lopes, J.W.M. Bastiaansen, and S.E.F. Guimarães (2018). Genetic correlations between feed efficiency traits, and growth performance and carcass traits in purebred and crossbred pigs. J. Anim Sci. 96:817-829. Gunsett, F.C. (1984). Linear index selection to improve traits defined as ratios. J. Anim. Sci.
59:1185-1193.
Habier, D., K.U. Götz, and L. Dempfle (2007). Estimation of genetic parameters on test stations using purebred and crossbred progeny of sires of the Bavarian Piétrain. Livest. Sci. 107:142-151.
Hayes, J.F. and W.G. Hill (1980). A reparameterization of a genetic selection index to locate its sampling properties. Biometrics. 36:237-248.
Hazel, L.N. (1943). The genetic basis for constructing selection indexes. Genetics. 28:476-490.
Knap, P. and L. Wang (2012). Pig breeding for improved feed efficiency. Pages 167-181 in Feed efficiency in swine. Springer.
Legarra, A., O.F. Christensen, Z.G. Vitezica, I. Aguilar, and I. Misztal (2015). Ancestral relationships using metafounders: finite ancestral populations and across population relationships. Genetics 200:455-468.
Lutaaya, E., I. Misztal, J. Mabry, T. Short, H. Timm, and R. Holzbauer (2001). Genetic parameter estimates from joint evaluation of purebreds and crossbreds in swine using the crossbred model. J. Anim. Sci. 79:3002-3007.
McLaren, D.G., D.S. Buchanan, and R.L. Hintz (1985). Sire ranking based upon purebred versus crossbred progeny performance in swine. J. Anim. Sci. 60:902-912.
Nagyné Kiszlinger, H., J. Farkas, G. Kövér, S. Onika-Szvath, and I. Nagy (2011). Genetic parameters of growth traits from a joint evaluation of purebred and crossbred pigs. Agric. Conspectus Sci. 76:223-226.
Nakavisut, S., R. Crump, M. Suarez, and H. Graser (2005). Genetic correlations between the performance of purebred and crossbred pigs. Pages 99-102 in Proc. Assoc. Advmt. Anim. Breed. Genet.
Page 19/20
Neeteson-van Nieuwenhoven, A.M., P. Knap, and S. Avendaño (2013). The role of sustainable commercial pig and poultry breeding for food security. Anim. Front. 3:52-57.
Rutten, M.J.M., P. Bijma, J.A. Woolliams, and J.A.M. van Arendonk (2002). SelAction: Software to predict selection response and rate of inbreeding in livestock breeding programs. J. Hered. 93:456-458.
Sevillano, C.A. (2018). Genomic evaluation considering the mosaic genome of the crossbred pig. PhD thesis, Wageningen University, Wageningen.
Sevillano, C.A., J. Vandenplas, J.W.M. Bastiaansen, R. Bergsma, and M.P.L. Calus (2017). Genomic evaluation for a three-way crossbreeding system considering breed-of-origin of alleles. Genet. Sel. Evol. 49:75.
Sevillano, C.A., J. Vandenplas, J.W.M. Bastiaansen, and M.P.L. Calus (2016). Empirical determination of breed-of-origin of alleles in three-breed cross pigs. Genet. Sel. Evol. 48:55.
Shull, G.H. (1908). The composition of a field of maize. J. Hered. os-4:296-301.
Stamer, E., W. Brade, and E. Kalm (2007). Genetic correlations between purebred and crossbred performances and different environments in pigs from test stations in Lower Saxony. Zuchtungskunde. 79:298-308.
Standal, N. (1977). Studies on breeding and selection schemes in pigs: VI. Correlation between breeding values estimated from station test and on-farm-test data. Acta Agric. Scand. 27:138-144. Tusell, L., H. Gilbert, J. Riquet, M.J. Mercat, A. Legarra, and C. Larzul (2016). Pedigree and genomic
evaluation of pigs using a terminal-cross model. Genet. Sel. Evol. 48:1-12.
Tusell, L., H. Gilbert, Z. G. Vitezica, M. J. Mercat, A. Legarra, and C. Larzul (2019). Dissecting total genetic variance into additive and dominance components of purebred and crossbred pig traits. Animal 13:2429-2439.
van Grevenhof, E.M., J. Vandenplas, and M.P.L. Calus (2019). Genomic prediction for crossbred performance using metafounders. J. Anim. Sci. 97:548-558.
Vandenplas, J., M.P.L. Calus, T. Brinker, E.D. Ellen, M.C.A.M. Bink, and J. Ten Napel (2017). Single-step GBLUP using metafounders to predict crossbred performance of laying hens. Page 193 in Proc. 68th Annual Meeting of the EAAP, Tallinn, Estonia.
Vandenplas, J., M.P.L. Calus, C.A. Sevillano, J.J. Windig, and J.W.M. Bastiaansen (2016). Assigning breed origin to alleles in crossbred animals. Genet. Sel. Evol. 48:61.
Vitezica, Z.G., L. Varona, J.-M. Elsen, I. Misztal, W. Herring, and A. Legarra (2016). Genomic BLUP including additive and dominant variation in purebreds and F1 crossbreds, with an application in pigs. Genet. Sel. Evol. 48:6.
Wientjes, Y.C.J. and M.P.L. Calus (2017). BOARD INVITED REVIEW: The purebred-crossbred correlation in pigs: A review of theory, estimates, and implications. J. Anim. Sci. 95:3467-3478.
Wong, .C., W.J. Boylan, and W.E. Rempel (1971). Purebred versus crossbred performance as a basis of selection in swine. J. Anim. Sci. 32:605-610.
Xiang, T., O.F. Christensen, and A. Legarra (2017). Technical note: Genomic evaluation for crossbred performance in a single-step approach with metafounders. J. Anim. Sci. 95:1472-1480.
Xiang, T., O.F. Christensen, Z.G. Vitezica, and A. Legarra (2016). Genomic evaluation by including dominance effects and inbreeding depression for purebred and crossbred performance with an application in pigs. Genet. Sel. Evol. 48:92.
Page 20/20
6. Publication list
Aldridge, M.N., R. Bergsma, and M.P.L. Calus (2019a). Investigating novel traits in single trait selection for their potential in selection indexes for feed efficiency of crossbred. Proc. Assoc. Advmt. Anim. Breed. Genet. 23:218-221.
Aldridge, M.N., R. Bergsma, and M.P.L. Calus (2019b). Meta-analysis for selection of feed efficiency in crossbred pigs. Page 287 in Proc. 70th Annual Meeting of the EAAP, Ghent, Belgium.
Calus, M.P.L. and Y.C.J. Wientjes (2017). A review of the purebred-crossbred correlation in pigs: theory, estimates, and reporting. Page 242 in Proc. 68th Annual Meeting of the EAAP, Tallinn, Estonia. Tusell, L., H. Gilbert, Z.G. Vitezica, M.J. Mercat, A. Legarra, and C. Larzul (2019). Dissecting total genetic
variance into additive and dominance components of purebred and crossbred pig traits. Animal 13:2429-2439.
van Grevenhof, E.M., J. Vandenplas, and M.P.L. Calus (2017). Using metafounders to model purebred relationships in genomic prediction for crossbreeding. Page 241 in Proc. 68th Annual Meeting of the EAAP, Tallinn, Estonia.
van Grevenhof, E.M., J. Vandenplas, and M.P.L. Calus (2019). Genomic prediction for crossbred performance using metafounders. J. Anim. Sci. 97:548-558.
Wientjes, Y.C.J. and M.P.L. Calus (2017). BOARD INVITED REVIEW: The purebred-crossbred correlation in pigs: A review of theory, estimates, and implications. J. Anim. Sci. 95:3467-3478.