HAL Id: hal-01383833
https://hal.archives-ouvertes.fr/hal-01383833
Submitted on 19 Oct 2016
HAL is a multi-disciplinary open access
archive for the deposit and dissemination of
sci-entific research documents, whether they are
pub-lished or not. The documents may come from
teaching and research institutions in France or
abroad, or from public or private research centers.
L’archive ouverte pluridisciplinaire HAL, est
destinée au dépôt et à la diffusion de documents
scientifiques de niveau recherche, publiés ou non,
émanant des établissements d’enseignement et de
recherche français ou étrangers, des laboratoires
publics ou privés.
Analysis of Execution Traces
Rémy Dautriche, Renaud Blanch, Alexandre Termier, Miguel Santana
To cite this version:
Rémy Dautriche, Renaud Blanch, Alexandre Termier, Miguel Santana.
TraceViz: a
Visualiza-tion Framework for Interactive Analysis of ExecuVisualiza-tion Traces .
Actes de la 28ième conférence
francophone sur l’Interaction Homme-Machine, Oct 2016, Fribourg, Switzerland.
pp.115-125,
�10.1145/3004107.3004127�. �hal-01383833�
TraceViz: a Visualization Framework for Interactive
Analysis of Execution Traces
Rémy Dautriche
1, 3, Renaud Blanch
1, Alexandre Termier
2, Miguel Santana
31
Université Grenoble Alpes, LIG
2Université Rennes 1, IRISA
3STMicroelectronics
F-38000 Grenoble, France
F-35042 Rennes, France
F-38920 Crolles, France
[email protected]
[email protected]
[email protected]
RÉSUMÉ
Les plateformes matérielles pour systèmes embarqués de-viennent plus puissantes à chaque nouvelle génération grâce à l’intégration de système sur une puce (System-on-Chip ou SoC). Développer des applications pour la lecture de contenu multimedia sur systèmes embarqués de-vient une tâche de plus en plus complexe. Les applications modernes sont massivement parallèles et doivent décoder un flux multimédia en temps réel pour éviter l’apparition d’artéfacts audio et video. Le débogage de ce type de pro-blème ne peut pas être fait avec les outils traditionnels qui interromptent le décodage et perturbent la synchronisa-tion des différents fils d’exécusynchronisa-tion. Une solusynchronisa-tion consiste à enregistrer tous les évènements apparus durant le dé-codage dans une trace et à procéder à l’analyse a poste-riori. Il existe de multiples outils de visualisation pour analyser de telles traces d’exécution. Cependant, leurs li-mites sont atteintes lorsque de grosses quantités de don-nées générées telles que celles au cours de l’exécution d’applications modernes doivent être analysées. Les outils existants fournissent tantôt une vue trop haut niveau pour être réellement utile, tantôt une vue trop détaillée rendant l’exploration des données fastidieuse. Nous proposons une nouvelle plateforme de visualisation interactive pour ré-soudre ces problèmes. Notre contribution consiste en deux volet : (a) nous présentons un nouveau système de stockage pour trace d’exécution suffisamment rapide pour permettre l’exploration interactive de traces volumineuses et (b) un nouvel outil de visualisation pour explorer interactivement les traces à différents niveaux de détails.
Mots Clés
Visualisation ; Interactions ; Trace d’exécution ; Systèmes embarqués ; Débogage ; Application multimedia
ABSTRACT
Hardware platforms of embedded systems are more pow-erful at each new generation thank to the integration of System-on-Chip (SoC). Developing streaming multimedia applications on embedded systems becomes an increas-ingly complex process. Modern applications are highly multi-threaded and have to decode the multimedia stream
© ACM, 2016. This is the author’s version of the work. It is posted here by permis-sion of ACM for your personal use. Not for redistribution. The definitive verpermis-sion was published in Actes de la 28ème conférence francophone sur l’Interaction Homme-Machine, 2016.
http://dx.doi.org/10.1145/3004107.3004127
in real time to prevent the apparition of audio and video artifacts. Debugging this kind of issue cannot be done with traditional debuggers that interrupt the decoding and perturb the synchronization of the different threads. The solution is to record all the events that occurred during the decoding in a trace and perform the analysis post-mortem. There exists many visualization tools to analyze execution traces but they have reached their limits with the amount of data generated by modern applications. They either provide a too generalized representation to be useful, or they show too much details leading to a fastidious data exploration. We propose a novel interaction visualization framework to address these problems. In particular, our contribution is in two parts: (a) we present a new fast back-end suitable for the interactive browsing of huge traces and (b) a new visualization tool to explore the trace at different level of details.
Author Keywords
Visualization ; Interactions ; Execution trace ; Embedded Systems ; Debugging ; Multimedia applications
ACM Classification Keywords
H.5.2. Information Interfaces and Presentation (e.g. HCI): User Interfaces
INTRODUCTION
Smartphones, tablets, set-top boxes and connected televi-sions are some examples of devices broadly used on a daily basis to consume multimedia content. Every few years, a new generation is released making these devices more powerful with a lower energy consumption to improve the quality of the user experience and the overall com-fort. These increased performances are possible thanks to highly integrated System-on-Chip (SoC) that embed many specialized chips for audio and video decoding. To fully use the potential of the new platforms, multimedia applica-tions become increasingly complex, raising the challenge of developing bug-free software. The need of efficient debugging tools is critical for companies which sell those platforms to keep the time and cost of developing multime-dia applications as low as possible.
Execution traces are the most popular method to debug such applications. Typically, a trace is recorded while the application is running and the developers proceed to a post-mortem analysis of the data. The complexity of modern platforms and streaming multimedia applications impact the size of execution traces. Their size is growing at each new generation up to a point where traditional analysis tools deployed in the industry are no longer able to tackle
this volume of data. This problem already exists and will accentuate as the time goes.
To address this issue, one of the solution consists in propos-ing new visualization tools that enable an efficient inter-active exploration and filtering of a large amount of data. In this paper, we propose TraceViz, a novel interactive visualization framework able to tackle the aforementioned problems. TraceViz allows the developers to explore in-teractively huge execution traces from high-level using ag-gregation techniques all the way down to a single event. It makes possible to visually spot regular patterns and trends in the trace, guiding the analyst in the filtering process. In this paper, we draw a state-of-the-art of the tools used in industry to analyze execution traces and we explain the limitations that developers have with these tools (Section 2) and we study the previous research about visualization tools for execution traces (Section 3). We describe the underlying back-end we have implemented for support-ing interactive exploration in TraceViz (Section 4). We continue by detailing its design principles and goals (Sec-tion 5). Next, we describe the graphical interface and the user interactions to efficiently explore the trace (Section 6). Finally, we describe two industrial use cases where TraceViz allows to identify patterns and was used to find bugs (Section 7).
BACKGROUND
In this section, we describe the specificities of debugging a multimedia application on embedded systems and the existing tools to record execution traces. We explain the typical analysis workflow used by the developers when working with traces.
Debugging Multimedia Applications on Embedded Systems
Multimedia applications have several specificities that in-duce the need of a very different debugging methods. In traditional applications, the classical debugging workflow uses breakpoints. The execution stops at the breakpoints from which the developer can investigate the state of the application. Then, there are two different execution strate-gies available: continue the execution normally or enter in a step-by-step mode where the execution stops at each instruction. This debugging method can not be used in the context of multimedia applications on embedded systems. At high-level, a multimedia application receives one or sev-eral encoded streams and has to decode it in real time be-fore sending it to a peripheral that will display the content. The decoding process has to respect some QoS properties so that no audio glitches or video artifacts appear [15]. In this context, using breakpoints to debug the applica-tion would break the real time constraint, modifying the behavior of the decoding.
To circumvent this phenomenon, developers use execu-tion traces to debug multimedia applicaexecu-tions. Using traces allows to do a post-mortem analysis of the execution, there-fore not to break the QoS properties to respect. There are different softwares to capture traces. Some are directly provided by the operating system such as KProbes that comes with the Linux kernel [17]. STMicroelectronics has
implemented its own stack, named KPTrace [24] and is able to capture kernel-land events such as context switches, interrupts, system calls, etc. as well as user-land events that can be any function call at the application level. Ex-ecution traces are text files in which the events are saved sequentially. An entry in the trace corresponds to one event with relevant information such as the timestamp, the event type, the actor that produced the event and more. In com-plex application executions, such events occur many times resulting on a huge amount of data generated in a short amount of time ( 106events per minute). Developers need
performant tool to analyze such data.
Developer Analysis Workflow
In this paragraph, we describe the typical analysis work-flow that developers use to debug streaming applications based on observations made in real situations at STMicro-electronics.
To debug multimedia applications, developers use a large variety of tools. The most basic technique is to instru-ment the kernel function using theprintk function in a similar way than introducingprintf calls in the source code of classical application. When working with develop-ment boards, the output ofprintk is directed on the serial port for minimal intrusiveness. While this method is very primitive, developers still heavily use it for its simplicity. In addition, tracing tools allow to record more precise infor-mation about the system. Many options are available from free tools such as LTTng [4] and Ftrace [3] or proprietary solutions such as KPTrace [24], developed by STMicro-electronics. In case of Multiprocessor System-on-a-Chip (MPSoC), the platform embeds many different specialized chips involved in different stages of the decoding process. The tracing system has to be able to trace all those special-ized components to obtain an accurate representation of the system behavior during the execution, increasing the amount of data to analyze.
In this context, developers have adapted an iterative methodology to minimize the volume of data to analyze. When starting, they may only have a rough approximation of the source of the problem. Thus, the tracing system is configured to record events of all the components, produc-ing a non-detailed overview of the whole system. After investigation, an other trace is recorded, targeting more specifically a subset of the components. This iterative pro-cess is repeated until having the source of the issue. This analysis workflow tends to minimize the size of the trace but also requires efficient tools to quickly explore and filter the data.
In this paper, we propose a new visualization tool, Trace-Viz, to address the interactivity and scalability requirement for exploring and filtering an execution trace in the con-text of debugging multimedia application on embedded systems.
RELATED WORK
Visualization of Execution Traces
There exists many different tools that give a trace overview. To be meaningful, we claim that the overview of an execu-tion trace has to provide data aggregaexecu-tion for both time and
event producers hierarchy (e.g. processes, interrupts, etc.), to show insights on the system load using well-known statistics and to provide user interactions to support fast data exploration and filtering. We describe below the dif-ferent approaches and their drawbacks.
A large panel of visualization tools for traces is based on Gantt charts [11]. When visualizing execution traces, the 2D time series visualization represents the active time windows for each actor. It gives a detailed view of the con-nections between the actors. One of the earliest work to use Gantt Chart for representing traces in parallel systems is Paragraph [13] and many later work do so, from pro-prietary industrial solution [24, 1] to various open source projects such as Eclipse Trace Compass [2] and Frame-SoC [9]. However, due to the high visual clutters of Gantt Charts, aliasing problems quickly arise as the amount of information to represent on the screen increases. Pajé [7] and Eclipse Trace Compass [2] have implemented simple aggregation mechanisms to address this problem. Aggre-gated temporal windows are encoded using different visual attributes such as the shape or the color. By doing so, the developer can be misled in the analysis since the algorithm only compute a visual aggregation instead of data aggrega-tion, and can result in information loss. Smart Traces [20] uses multiple views to show different hierarchical aggrega-tions (threads, modules), minimizing the limitaaggrega-tions of the other tools.
Ocelotl [21, 9] proposes a visualization that aggregates both the actors and the time dimension to obtain an overview of the execution. It comes with user interactions that allow to choose the aggregation level enabling the analyst to explore the macro-behaviors at different scale. However, it lacks interactions to navigate the trace and does not represent meaningful statistics for the developers. Viva [18] has a similar approach by aggregating data of both the actors and the time axis but uses a treemap to show both software and hardware hierarchies. The time dimension is visualized using animation. While this ap-proach is suitable to spot load balancing issues, it is not appropriate in the context of multimedia application where detecting synchronization is crucial.
Other visualizations rely on statistics computed from the trace. KPTrace [24], with the Outline view, and Eclipse Trace Compass [2] propose a bar chart where the whole trace has been aggregated using a statistic like the event density or the CPU load. This kind of view perfectly shows the overall behavior of the system across time but hides the actors details, preventing the developer to observe the behavior of individual actor over time. These tools also provide other views to give the detail of the statistic by actor. However the time space is aggregated making the temporal exploration impossible.
Trace Visualization Tools in the Industry
Despite many visualization tools, developers still largely rely on textual tools to analyze the data. As described above, the visualization tools available are either too high-level, such as the Outline Views [24], or too detailed, such as the Gantt Chart family of tools. The first family of tools gives a good overview of the behavior of the system but it
does not provide enough information to find the source of an issue as the hierarchy is hidden. The Gantt chart family allows to precisely visualize the individual events making possible to spot the problematic suite of events. However, they quickly display a high-level of aliasing as the number of events increase and are not suitable to provide a more general view of the trace. The gap between those two categories is large and there is a need of a new generation of tools to fulfill this need. Such tools must provide a seamless transition from high-level to low-level of details using controlled data aggregation techniques for both the temporal dimension and the hierarchy.
Multiple Time Series Visualization
In this paragraph, we briefly analyze the state of the art of visualization techniques for time series based on line graphs.
Line charts, introduced by Playfair [23], became the most popular visualization technique for time series. The aspect ratio significantly impact their legibility. When represent-ing multiple time series, some legibility problems appear due to the limited screen space. For an optimal legibility, Cleveland recommends an average slope of 45 degrees [8], constraining the aspect ratio but this condition may be satisfied in small space.
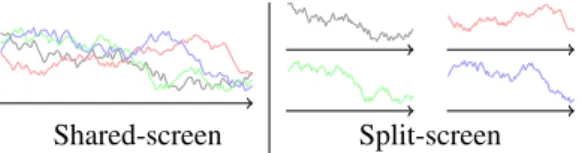
Javed et al. [16] discuss the graphical perception of multi-ple time series visualizations derived from the line graph and identified two categories: the split-screen and the shared-screen techniques. The split-screen techniques rely on the principle of small multiples introduced by Tufte [26]. It consists in splitting the screen space S into N smaller areas of size S/N for each time series. To improve the rep-resentation of the line graphs in limited amount of space, several techniques have been developed [14, 16, 22, 25]. The shared-screen techniques use a different approach: the time series are all represented in the same space and are differentiated using the color visual attribute. Exam-ples of such techniques are ThemeRiver [12], Stacked Graph [5] and Braided Graph [16]. Javed et al. found that split-screen techniques are more suitable for reading global values while shared-screen techniques are better when working on local area of the graphs [16].
DATA
Execution traces contain huge amount of data (⇡ 106
events). For an efficient analysis of the trace, the user must be able to interactively explore the data. Modern com-puters are able to render complex visualizations quickly. Therefore, the limiting factor to provide interactive brows-ing tools when workbrows-ing with huge amount of data is the
Shared-screen Split-screen
Figure 1: With shared-screen techniques, the graphs share the space and with split-screen techniques, the space is equally divided between the graphs.
time for data access. In this section, we describe the back-end developed for TraceViz to enable interactive explo-ration of large execution traces and present its performance measured with an experiment. We finish by detailing the statistics implemented in TraceViz.
Data Storage
Execution traces are composed of a large series of events. Each event has a timestamp at which it occurred, the actor which produced it, typically processes and interrupts, and a type. An event type can be an entry/exit of a system call, an application function or an interrupt, a context switch, etc. As seen previously, developers use an incremental workflow that involves many tools where analysis of ex-ecution traces is part of it. In this context, traces need to be stored in a performant back-end that guarantees a minimal time for data access and processing. Traditional tools use a SQLite database [24, 21]. With recent hard-ware platforms and increased trace size, such database does not scale and developers experience slow data access. Deploying complex architecture with powerful severs is also prohibited since it requires streaming data over the network and remains too complex to achieve in the context of streaming multimedia decoding applications on MP-SoC. To address those constraints, we have developed a back-end based on HDF5, Hierarchical Data Format [10]. HDF5 allows to store huge files in a hierarchical format and comes with powerful memory management for fast access to huge amount of data. Supported by the the HDF Group1, HDF5 is widely used in scientific applications
where high performance and robustness is necessary like in meteorlogy2.
TraceViz stores a trace as follows:
• /events contains an array of all the events in the trace, chronologically sorted,
• /actors is an array of all the active actors, • /types stores all the event types.
Running through the whole trace is done by accessing the array of events. The HDF5 driver handles the main memory and the page faults, providing a high performance data access.
We study the TraceViz back-end performance for import-ing, reading and querying a trace. We compare the results with an SQLite back-end largely used by analysis tools for execution traces. We ran the experiment on a workstation equipped with an quad-core i7 Intel CPU at 3 GHz, 16 GB of RAM and a 256 GB SSD. The design of our experi-ment is largely inspired by the evaluation of the FrameSoC back-end performance conducted by Pagano et al. [21].
Reading Performance
TraceViz aims to provide interactive exploring and filtering techniques for traces. It largely depends on the back-end performance which has to respond in a delay inferior to 100 milliseconds independently on the query to feel interactive to the users [19, 6]. We measured the response time of
1The HDF Group, <https://www.hdfgroup.org>
2NASA scientific satellite Terra, <http://terra.nasa.gov>
Trace size (MB) 2 21 150 431
TraceViz BR (ms) 0.416 0.385 0.383 0.376
TraceViz RR (ms) 0.369 0.301 0.564 0.616
SQLite (ms) 62.09 312.77 1822.95 5800.63
Tableau 1: Read time of 10000 events for different trace size. The first row reports the time to read a block of 10000 consecutive events (BR time). The second row reports the time to read 10000 events randomly chosen in the trace (RR time). The third row is the time to read a block of 10000 events in SQLite.
the data storage for both reading (Table 1) and querying operations to study if this requirement is fulfilled. We measured the reading time in traces of different sizes under two conditions. Firstly, we read blocks 10000 con-secutive events in a randomly chosen part of the trace. We repeated 10 times this step and compute the average time (BR time in Table 1). SQLite performance has been mea-sured under these conditions. Secondly, to minimize the impact of the cache effect of HDF5 and to simulate the result of complex queries we also measured the reading time of 10000 non-consecutive events randomly chosen on the whole trace. (RR time in Table 1). We notice a slight increase for bigger traces but the response time is still under the millisecond.
For both BR and RR measurements, the response time is constant at below 100 milliseconds. For SQLite, the response time grows linearly and shows it cannot provide interactive read time. The performance of the TraceViz back-end allows to browse the trace interactively.
Query Performance
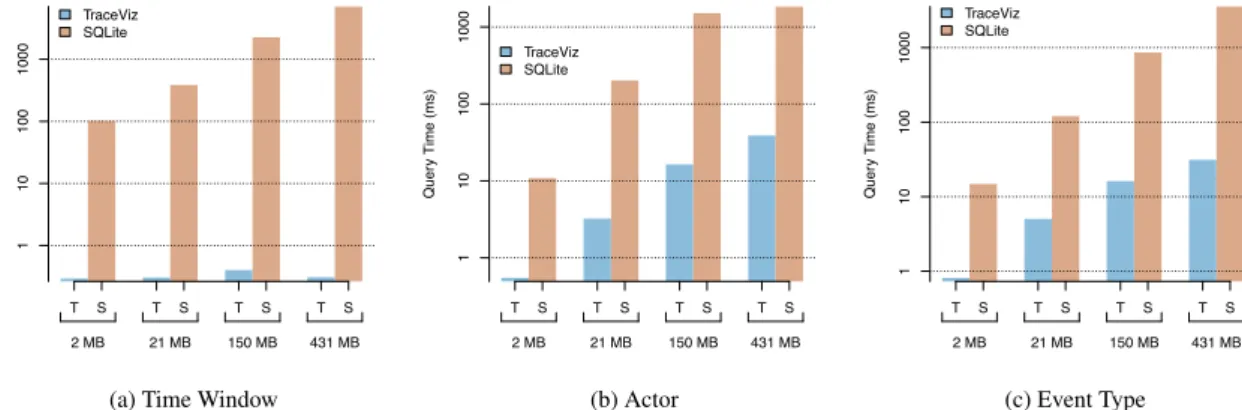
To better measure the back-end performance for filtering tasks, we measured the time to read 20000 events in the result of a query on a time window, an actor and an event type. The results are presented in Figure 2. Querying a time window is constant in time (Figure 2a). This comes from the format used to store the events: they are naturally sorted by their timestamp and indexed by their location in the array, allowing to use fast search algorithms. This shows that the back-end can support interactive pan and zoom. The query performance on the actor and the event type are similar. Both of the query time increase linearly with the trace size (Figure 2b and 2c), shown by a co-efficient of determination respectively equal to 0.99 and 0.97 for the actors and the event types. The response time remains lower than a second under all the conditions, guar-anteeing the users’ cognitive model remains unbroken.
Conclusion on Back-end Performance
The results of the different benchmarks shows that the back-end provides performance suitable for usage in an interactive context. It guarantees an interactive response time for the exploration of a trace and returns the result of a query in a time short enough so that it does not interfere with the users’ understanding.
Statistics and Data Computation
Execution traces are a list of raw low-level events from which different metrics can be computed according to the
Quer y Time (ms) T S T S T S T S 2 MB 21 MB 150 MB 431 MB 1 10 100 1000 TraceViz SQLite
(a) Time Window
Quer y Time (ms) T S T S T S T S 2 MB 21 MB 150 MB 431 MB 1 10 100 1000 TraceViz SQLite (b) Actor Quer y Time (ms) T S T S T S T S 2 MB 21 MB 150 MB 431 MB 1 10 100 1000 TraceViz SQLite (c) Event Type
Figure 2: Read time of 20000 events when filtering on the time window, the actor and the event type. goal of the developers. During our collaboration with the
software developers at STMicroelectronics, we noticed that the analysis mainly involves three metrics: the event density, the activity time and the delay between events. The event density describes the event distribution over time. Using this statistic, the developers can spot an abnormal number of interrupts, system calls or function calls in the application.
The activity time gives insight on the task scheduling on the CPU. For example, the analysts can check if a task has been executed for a abnormally long period blocking other processes. This can result in the violation of QoS constraints [15].
The delay between events allows the checking of QoS con-straints more accurately. Using their domain knowledge, the developers know which calls or interrupts are critical in the decoding process and can check their call frequency. As an example, the video decoder has to decode 25 frames per second to avoid glitches or blanks. Checking the call frequency of the function starting the decoding of a frame is a simple way to approximate the frame rate before fur-ther checking.
In TraceViz, the developers can interactively switch be-tween these statistics. Each statistic is computed separately for every actor present in the execution trace. While it al-ready gives meaningful low-level insights, it is sometimes relevant to perform the checking at higher level of abstrac-tion, requiring to aggregate several actors. The developers may need to check at a component level in charge in a particular step of the decoding process. To do so, it is necessary to aggregate all the actors of this component which can include tasks and interrupts. TraceViz provides simple user interactions to create such aggregates before computing a chosen statistic on its data.
TRACEVIZ DESIGN
Based on the related work and our observations in STMi-croelectronics, we propose TraceViz, a new interactive visualization tool for execution traces.
Design Rationale
• Provide an overview of the trace. Most of the time, developers begin to visualize the global behavior of the system during the execution. TraceViz has to provide an easily understandable overview, yet with enough details to begin the filtering process.
• Support domain related statistics. When debugging, de-velopers use well-established statistics. It is primordial to integrate them into the tool to maximize the semantic of the representation.
• Integrate well-known visualization techniques. To miti-gate the learning curve, we decided to use visualizations for time series based on line graphs, the most widely used time series representation.
• Provide user interactions to explore and filter the data. For an efficient browsing, TraceViz has to support inter-active zooming, sorting, aggregating and filtering. • Visualize behavioral patterns between actors. By nature,
a streaming application repeats the same operations on a regular period. Understanding which actors are synchro-nized as well as visualizing the patterns will help the analyst to quickly spot trends and abnormal behaviors without using complex algorithms.
TraceViz Visualization Principles
Javed et al. stated that the users perform better for global tasks using split-screen techniques and are more effi-cient for local tasks with shared-screen visualizations [16]. TraceViz mixes both to easily visualize overall behavior and make local comparison between actors: it embeds a timeline view and an outline view that share the same time axis (Figure 3).
The timeline area relies on the principle of small multi-ples [26] and belongs to the split-screen techniques. The goal of the timeline area is to visualize the macro-behavior of each actor such as its periodicity or a particular behav-ioral pattern. It also serves to represent the synchronization between different actors and to spot potential patterns at component-level of the application. For m actors in a trace T , m graphs are represented in the timeline view, one graph per actor (see Figure 3). The vertical resolution H (in pixel)
actorm
actor2
actor1
p0 p1 p2 p3 pn 1 pn
Timeline area width W
H m H m H m Timeline area height H time Timeline Outline
Figure 3: TraceViz visualization principles. is sliced into m horizontal areas of heightHm pixels, where the graphs are rendered. The horizontal resolution W (in pixels) gives the number of time slices to use to segment the trace. By doing so, the data is aliased at pixel-level, the smallest aliasing achievable on current display technolo-gies. For each actor a, we compute an histogram histaof
W bins, each bin corresponding to a pixel (see Figure 4). For each pixel pi, we compute the two timestamps ti1and
ti2at its boundaries and extract data contained in this time
window. We have Va=Ta[ti1. . .ti2]with Tabeing all the
events produced by the actor a in the trace T . Next, we compute hista[pi]so that:
hista[pi] =f (ti1,ti2,Vai)
with f being the statistics chosen by the analyst (event density, activity time or delay between events).
The outline area provides a more general overview of the execution to spot local peaks of activity on the system, hard to visualize on the timeline since the information is spread over m graphs. Instead of being juxtaposed, the m graphs are stacked so that the value at pixel piis:
histoutline[pi] = actorm
Â
a=actor1hista[pi]
The integration of the timeline and the outline views pro-vides to the analyst a global overview of the execution, yet with details on the actors while showing temporal pat-terns. It combines the advantages of the existing high and low-level tools. Using the already established statistics as basis for the computation of the histograms minimizes the learning phase and ensures a good readability.
Slick Graphs
By nature, decoding multimedia applications execute peri-odically the same instructions and visualizing this period can help to detect time windows when it has not been re-spected. We developed a novel interactive visualization technique for time series, called Slick Graphs (SLG), to ex-plore the variations of a time series at different frequencies. We integrated SLG to the outline view. SLG is composed
hista
p0 p1 pi 1 pi pi+1 pn 2 pn 1
ti1
Va=Ta[ti1. . .ti2]
ti2 Ta
Figure 4: Building of the histogram histafor an actor a
of an algorithm that smooths a time series and a represen-tation based on a line graph.
The smoothing algorithm applies a Gaussian filter on the data and takes three parameters as entry point: a histogram H, the width in number of pixels p of the space available to display the graph and a smoothing factors which will determine the strength of the smoothing to apply and cor-responds to the Gaussian kernel width. This will define the overall shape of a Slick Graph and shows variations at a given frequency. The value for each pixel influences the neighboring pixels according to a Gaussian convolution centered on that pixel. Thus, the histogram H is convo-luted by a sampled Gaussian kernel, giving the value at each pixel pi: SLG(ti) = (T ⇤ G)(ti) = d3se
Â
n= d3se T (pi n)G(n) (1) with G(n) =p1 2pse n2 2s2.The computation of the convolution in Equation 1 is bounded to the [d 3se;d3se] interval since 99.7% of the values are in three standard deviations of the mean.
High Frequencies Encoding
A side effect of the smoothing step is to remove the high frequencies contained in the data, giving the more general tendency of the data across time. In the case of SLG, when the smoothing factors increases, the range of filtered out frequencies increases and more information is removed from the visualization. To mitigate the loss of this informa-tion, SLG encodes the difference between the smoothed value SLG(pi)and the real value H[pi]in the luminance
channel Lpi of each pixel pi:
Li= 8 > < > : 1
1 +SLG(i)T (i) if T (i) 6= 0
0 if T (i) = 0
It gives:
( Li=0 if SLG(i) T (i)
Li=0.5 if SLG(i) = T (i)
Li=1 if SLG(i) ⌧ T(i)
Thus, the local extrema appear at the exact position as bands of different shades of gray, white being for the local
minimum and black for the local maximum. Figure 7 shows the result of the high frequencies encoding.
TRACEVIZ
In this section, we present the user interface of TraceViz with its components and describe the different interactions implemented.
Layout
The TraceViz interface, shown in Figure 5, consists of three main areas: the tree view, the outline view and the timeline view.
The tree view shows the actors present in the trace initially ordered as a hierarchy according their nature (hardware interrupts, software interrupts and tasks). To visually make corresponding a graph and its label, links are placed be-tween the tree view and the timeline. Their visibility is automatically updated according to the tree label to lever-age the visual clutterness. Each category of the hierarchy has its own color, reported on the links.
The outline view in the top area represents the overall activity of the system. The details of actors statistic are represented using colors, each color encoding one actor. The analyst can choose to switch to the SLG shading for a more precise frequential analysis.
The timeline view visualizes the time series corresponding to the actors. Their order is given by the hierarchy. All the graphs and the outline view have the same time axis and are aligned on the timestamp of the first event of the trace by default. At the start up, the timeline shows the whole trace: it begins on the left at the timestamp of the first event of the trace and finishes on the right at the timestamp of the last event.
The tool bar gives access to different configuration settings of the view such as defining initial filter parameters, the statistic being used to compute the data and the state of the visual functionalities such as the smoothing factors applied on the outline view.
Initial View Configuration
At the beginning of the analytic process, the developer has to choose a statistic to compute the input data used to feed the graphs in the timeline and outline views. The statistics implemented are event density, activity time and delay between events, as described in section 4.2. To improve the clarity of the timeline view and to increase the speed of the filtering process, the developer can select which actors are hidden in the initial configuration and which trace points to ignore. By doing so, the view will directly display the data of interest. This filtering process is also quicker than navigating the tree hierarchy.
Trace Exploration
The hierarchy part of the view provides all the interactions to navigate, reorder, hide, create groups and to aggregate elements. The timeline area provides all the interactions to explore the data. Hovering the timeline area with the mouse cursor updates the hierarchy area. When hovering a graph, the hierarchy automatically scrolls to align the corresponding tree label and highlights it. When scrolling
out, the actors disappear but the labels and connection of the upper levels in the hierarchy remain visible by stacking on the top and bottom. By doing so, the developer always has visible indicators that show the vertical position of the tasks and the interrupts in the timeline helping the exploration for large hierarchy sizes. When the graph of an actor is highlighted, the value under the current pixel is noted in the time cursor. Its corresponding layer in the outline and its label in the hierarchy are focused.
Pan and zoom
Initially, the whole trace is displayed using filters defined in the configuration settings. Depending on the trace size and duration, a pixel can encode a large time window, mak-ing apparent high-level recurrent patterns in the behavior of the different actors. After having visually detected those patterns, the developer may be interested to filter-out re-dundant data to focus on one of those patterns. We provide a drag interaction using the right button to select a time window of interest that will fit the view. It is also possible to continuously zoom in the trace using the mouse wheel. A drag interaction using the left button allows to pan in the trace. While using those interactions, both the timeline and the outline views are refreshed to provide a continuous feedback and to keep a consistent visualization.
The pan and zoom interactions provide a natural way to explore behavioral patterns that can appear at high and low frequencies.
Actor Selection and Aggregation
When hovering the hierarchy, it behaves like a classical tree view with standard interactions: left-click to hide a label and its graph, shift/mouse move to select several con-secutive labels, control/left-click to select non-concon-secutive labels, and right-click to access to different actions such as grouping, aggregating and hiding tree labels and their graphs.
After having selected actors, the user can create a group and name it. From this point, different actions are pos-sible when doing a right-click on the group’s tree label: deleting the group, hiding it or aggregating it. When a group becomes hidden, all the graphs of its children are also hidden on the timeline area. The remaining graphs spans vertically, increasing the vertical resolution. To ag-gregate a group, several operators are available: maximum, minimum, average and median. This operator is used on each pixel to compute the resulting graphs of the aggrega-tion. From this point, the group behaves as any actor in the hierarchy.
Hierarchy Reordering
Besides execution patterns, actors’ graphs can reveal simi-lar periodic behaviors. To better compare their graphs, it is possible to place them side-by-side using a drag interaction on their corresponding tree labels. While dragging, the hi-erarchy stops scrolling automatically to ease the interaction and a visual feedback is displayed as a blue line to indicate where the actor would be moved when the interaction is over. The layer in the outline view are reordered according to the new position. TraceViz provides the possibility to drag an actor, a group and an arbitrary selection of actors.
Figure 5: Overview of TraceViz. TraceViz interface consists of three main areas: the tree view (a), the outline view (b), the timeline view (c) and the links that connect the actors and their corresponding graphs (d).
Implementation
TraceViz is implemented in Java 8 with JavaFX 8 as the interface toolkit. As mentioned in section 4.1, HDF5 is used for the back-end and the data extraction and filtering is implemented using the Stream API of the JDK 1.8. An operational version of TraceViz has been deployed for the developers at STMicroelectronics. This version implements fewer interactions than presented in this paper as the back-end is an SQLite database for compatibility reasons. It has been implemented as an Eclipse plug-in and is internally shipped as a tool of the SoC Traces & Profiling Toolkit (STPTK)3. Part of the interface relies on
the SWT toolkit while the rendering still relies on JavaFX 8.
INDUSTRIAL USE CASE
In this section, we present two use cases that happened in industrial environment at STMicroelectronics. These use cases have been reported to the division in charge of developing the streaming application for set-top boxes.
Use Case 1: Zap
In this use case, we show how TraceViz makes apparent patterns in a trace. The streaming multimedia application
is running under the STLinux4operating system on the
STiH418 SoC for set-top boxes5. A multi-channel stream
is received from the network. The application decodes one of the channel and sends it to an external display through the HDMI port. Changing the channel being decoded is
3SoC Traces & Profiling ToolKit (STPTK), <http://www.
stlinux.com/devel/traceprofile/kptrace#STPTK>
4STLinux, <http://stlinux.com>
5STiH418 SoC description, <http://www.st.com/st-web-ui/
static/active/en/resource/technical/document/data_
brief/DM00123853.pdf>
called a zap. It basically corresponds to the scenario when a user is changing of channel when watching the television, commonly called zapping. When recording the trace, we performed 30 zaps consecutively, separated by a delay of 10 seconds. In Figure 5, TraceViz all of the trace. At a glance, patterns appear.
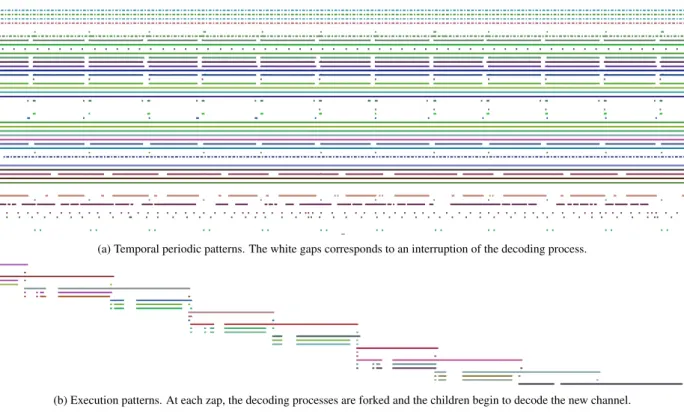
Firstly, temporal patterns are represented on both the out-line and the timeout-line. On the outout-line, regular peaks of activity are apparent. They correspond to the moments when a zap occurred. Abnormal zap executions are quickly detected thank to a suddenly much higher event density. Using the SLG visualization, the zap appear as black ver-tical bands (see Figure 7). The abnormal zaps appear as larger black strips and local maximum on the curve. On the timeline, we can visually recognize which actors are in charge of the decoding process: the decoding is momen-tarily stopped when zapping and the involved processes are not scheduled during these short periods. It appears as gaps on the timeline (see top rectangle in Figure 5, zoomed in Figure 6a).
Secondly, behavioral patterns also appear on the timeline (see bottom rectangle in Figure 5, zoomed in Figure 6b). When a zap occurs, some of the decoding processes are forked. The children will decode the requested channel and the parents which decoded the previous one will stop. This pattern appear 30 times on TraceViz on the timeline. Based on both the temporal and behavioral patterns, the de-veloper is able to efficiently compare different actors, time windows and to filter-out redundant data to dramatically reduce the amount of data to analyze.
(a) Temporal periodic patterns. The white gaps corresponds to an interruption of the decoding process.
(b) Execution patterns. At each zap, the decoding processes are forked and the children begin to decode the new channel.
Figure 6: Patterns appearing on the timeline for the use case Zap
Figure 7: Outline with SLG shading
Use Case 2: HDMI black-outs
This use case is a real issue that occurred at STMicroelec-tronics6. The application is running in the same
environ-ment that the previous use case. It is in charge of decoding a multimedia stream and sending it on an external display via the HDMI output. The issue is reported as sporadic audio and video blanking becoming more frequent under heavy CPU load. It has been reported that the troubleshot occurs independently of the source, whether it is the net-work or the local hard drive.
After this observation, the issue has been artificially repro-duced by decoding a multimedia source from the local disk
while loading it with some heavy I/O using the Unixdd
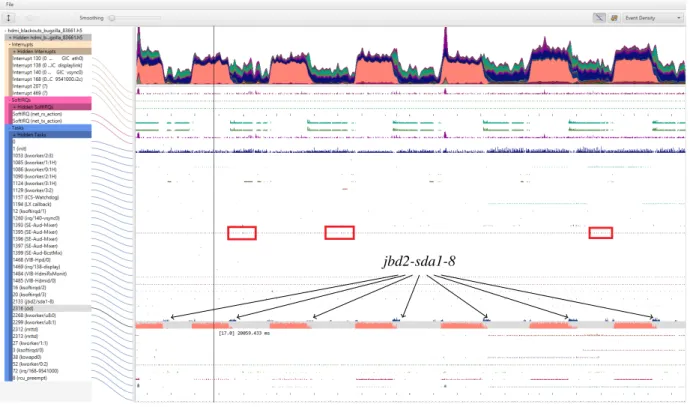
command. The execution trace has been recorded under these conditions. As described in Section 2.2, the first step of the developer workflow is to open the trace in a synthetic view to check the global system behavior. In Figure 8, the trace has been opened in TraceViz. The visu-alization shows the event density over the whole execution. The second step consists in using a more detailed view. With TraceViz opened and set to represent the event den-sity, we instantly spot on the timeline view the dd task loading the system at regular periods (see Figure 8). The task named jbd2/sda1-8 appears to be scheduled on the
6A video demoing TraceViz with this usecase is available at
<https://youtu.be/BmTDzoc70lw>
CPU directly after the dd task and heavily loads the system (see bottom rectangle in Figure 8 and Figure 9).
The interesting time windows are the periods when thedd task is not working. When zooming in one of these time windows (see red rectangles in Figure 8 and Figure 10), the task irq/140-vsync0 has its periodic behavior disturbed. It is the callback of the interrupt request 140 (IRQ): the vertical synchronization (VSync) IRQ on the main out-put. This thread is in charge of the main decoding process. TraceViz shows an abnormal scheduling delay resulting in a delayed decoding of the stream. As consequence, it intro-duces a delay between the frames and creates a starvation on the output to finally result as a black screen. Having found the source of the blackouts, the developers could continue the debugging process by investigating the CPU scheduling, particularly on focusing the task jdb2/sda1-8. Coupled with the developers’ domain knowledge, we showed how TraceViz has helped the discovery of a de-layed issue.
DISCUSSION
We saw how TraceViz has been useful to debug real use-cases that occurred during the development of STMicro-electronics products for set-top boxes. Because Trace-Viz addresses a real user need for its software developers, STMicroelectronics has integrated TraceViz into their de-velopment toolkit STPTK.
The real benefit of TraceViz is its capacity to clearly show the periodic behaviors and synchronization between the actors and to explore the behavioral patterns at different levels of zoom.
jbd2-sda1-8
Figure 8: TraceViz showing an execution when video blanks appeared. The system is artificially loaded with heavy some I/O using thedd Unix command (in orange). The task jbd2-sda1-8 (in blue) is scheduled directly after the dd task (detailed on Figure 9), causing delays on the treatment of the VSync IRQ callback (shown in the red rectangles and zoomed on Figure 10).
Figure 9: The jbd2/sda1-8 task (in blue) is scheduled after the dd task (in brown).
(a) Event density. Delays are represented by visual gaps between the dots (in the rectangles).
(b) Delay between events. After a horizontal gap, a peak appears indicating a much longer delay between consecutive calls (in rectangles).
Figure 10: When the dd task (in brown) is unscheduled, the jbd2-sda1-8 task (in blue) loads the CPU, causing a delay on the treatment of the callback for the VSync IRQ on the main output (in purple).
However, this work has some limitations. First, when the number of actors becomes close to the vertical resolution of the display, some legibility problems can occur: the height of the histograms become close to 1 pixel and the details become difficult to read due to their small size. Second, no user evaluation could be conducted for this work. The targeted users are the software developers
work-ing on set-top boxes at STMicroelectronics. It appears to be very difficult to reach them, even for a quick interview. However, the development of TraceViz has been made it-eratively in collaboration with the team in charge of tools development in STMicroelectronics and informal devel-opers feedback could be collected to adjust the design of TraceViz. Its industrial deployment is a form of validation of this design.
CONCLUSION AND FUTURE WORK
We have presented TraceViz, a novel interactive visual-ization framework to analyze execution traces. First, we described the back-end developed for TraceViz, based on HDF5. Through an experiment, we showed the back-end provides the performances to explore interactively huge traces. Second, we introduce a tool that mixes two cate-gories of visualization techniques for time series, maximiz-ing the efficiency of both local and global analysis. We have integrated the Slick Graphs, a line chart based rep-resentation for exploring the data at different frequencies. We have shown how TraceViz reduces the analysis time by revealing patterns hidden by the existing tools.
We plan to integrate hierarchical clustering methods to automatically group the actors by their similarities. We are also interested by using data mining methods for the detection of anomalies and incorporating the results in the timeline and outline views.
BIBLIOGRAPHIE
1. Arm ds-5 development studio.
http://ds.arm.com/ds-5, Accessed on April 8th, 2016.
2. Eclipse trace compass.http://tracecompass.org, Accessed on April 8th, 2016.
3. Ftrace.http://elinux.org/Ftrace, Accessed on April 8th, 2016.
4. Lttng.http://lttng.org, Accessed on April 8th, 2016.
5. L. Byron and M. Wattenberg. Stacked graphs: Geometry & aesthetics. IEEE Transactions on Visualization and Computer Graphics, 14:1245–1252, 2008.
6. S. K. Card, G. G. Robertson, and J. D. Mackinlay. The information visualizer, an information workspace. In Proceedings of the SIGCHI Conference on Human Factors in Computing Systems, pages 181–186. ACM, 1991.
7. J. Chassin de Kergommeaux. Pajé, an interactive visualization tool for tuning multi-threaded parallel applications. Parallel Computing, 26(10), 2000. 8. W. Cleveland. Visualizing Data. Hobart Press, 1993. 9. D. Dosimont, G. Pagano, G. Huard, and
V. Marangozova-Martin. Efficient analysis methodology for huge application traces. In International Conference on High Performance Computing & Simulation, pages 951–958, 2014. 10. M. Folk, G. Heber, Q. Koziol, E. Pourmal, and
D. Robinson. An overview of the hdf5 technology suite and its applications. In Proceedings of the EDBT/ICDT 2011 Workshop on Array Databases, pages 36–47. ACM, 2011.
11. H. L. Gantt. Work, Wages, and Profits. New York: The Engineering magazine co., 1913.
12. S. Havre, P. Whitney, and L. Nowell. Themeriver: Visualizing thematic changes in large document collections. IEEE Transactions on Visualization and Computer Graphics, 8:9–20, 2002.
13. M. T. Heath and J. A. Etheridge. Visualizing the performance of parallel programs. Software, IEEE, 8(5):29–39, 1991.
14. J. Heer, N. Kong, and M. Agrawala. Sizing the horizon: The effects of chart size and layering on the graphical perception of time series visualizations. In ACM Human Factors in Computing Systems (CHI), 2009.
15. O. Iegorov, V. Leroy, A. Termier, J.-F. Mehaut, and M. Santana. Data mining approach to temporal debugging of embedded streaming applications. In
2015 International Conference on Embedded Software (EMSOFT), pages 167–176. IEEE Computer Society, 2015.
16. W. Javed, B. McDonnel, and N. Elmqvist. Graphical perception of multiple time series. IEEE Transactions on Visualization and Computer Graphics,
16:927–934, 2010.
17. R. Krishnakumar. Kernel korer: Kprobes - a kernel debugger. Linux Journal, 2005(133), 2005. 18. R. Lamarche-Perrin, L. M. Schnorr, and J.-M.
Vincent. Evaluating trace aggregation for
performance visualization of large distributed systems. In Proceedings of the 2014 IEEE Internation
Symposium on Performance Analysis of Systems and Software, 2014.
19. R. B. Miller. Response time in man-computer conversational transactions. In Proceedings of the December 9-11, 1968, Fall Joint Computer Conference, Part I, pages 267–277. ACM, 1968. 20. D. K. Osmari, H. T. Vo, C. T. Silva, J. L. D. Comba,
and L. Lins. Visualization and analysis of parallel dataflow execution with smart traces. In 27th
Conference on Graphics, Patterns and Images (SIBGRAPI), 2014.
21. G. Pagano, D. Dosimont, G. Huard, and
V. Marangozova-Martin. Trace management and analysis for embedded systems. In Proceedings of the
IEEE 7thInternational Symposium on Embedded
Multicore SoCs, 2013.
22. C. Perin, F. Vernier, and J. D. Fekete. Interactive horizon graphs: Improving the compact visualization of multiple time series. In Proceedings of the SIGCHI Conference on Human Factors in Computing Systems, pages 3217–3226, New York, NY, USA, 2013. ACM. 23. W. Playfair. The Commercial and Political Atlas.
London, 1786.
24. C. Prada-Rojas, F. Riss, X. Raynaud, S. De Paoli, and M. Santana. Observation tools for debugging and performance analysis of embedded linux applications. In Conference on System Software, SoC and Silicon Debug-S4D, 2009.
25. T. Saito, H. N. Miyamura, M. Yamamoto, H. Saito, Y. Hoshiya, and T. Kaseda. Two-tone pseudo coloring: Compact visualization for one-dimensional data. In IEEE Symposium on Information Visualization, pages 173–180. IEEE Computer Society, 2005.
26. E. R. Tufte. The Visual Display of Quantitative Information. Graphics Press, Cheshire, CT, USA, 1986.