HAL Id: hal-01819060
https://hal.archives-ouvertes.fr/hal-01819060
Submitted on 19 Jun 2018
HAL is a multi-disciplinary open access
archive for the deposit and dissemination of
sci-entific research documents, whether they are
pub-lished or not. The documents may come from
teaching and research institutions in France or
abroad, or from public or private research centers.
L’archive ouverte pluridisciplinaire HAL, est
destinée au dépôt et à la diffusion de documents
scientifiques de niveau recherche, publiés ou non,
émanant des établissements d’enseignement et de
recherche français ou étrangers, des laboratoires
publics ou privés.
Mesoscale modeling of dynamic recrystallization
behavior, grain size evolution, dislocation density,
processing map characteristic, and room temperature
strength of Ti-6Al-4V alloy forged in the (α+β) region
Hiroaki Matsumoto, Vincent Velay
To cite this version:
Hiroaki Matsumoto, Vincent Velay. Mesoscale modeling of dynamic recrystallization behavior, grain
size evolution, dislocation density, processing map characteristic, and room temperature strength of
Ti-6Al-4V alloy forged in the (α+β) region. Journal of Alloys and Compounds, Elsevier, 2017, 708,
pp.404 - 413. �10.1016/j.jallcom.2017.02.285�. �hal-01819060�
Mesoscale modeling of dynamic recrystallization behavior, grain size
evolution, dislocation density, processing map characteristic, and
room temperature strength of Ti-6Al-4V alloy forged in the (
a
þ
b
)
region
Hiroaki Matsumoto
a,*, Vincent Velay
baDepartment of Advanced Materials Science, Faculty of Engineering, Kagawa University, 2217-20 Hayashi-cho, Takamatsu, Kagawa 761-0396, Japan bUniversit!e de Toulouse, CNRS Mines Albi, INSA, ISAE, ICA (Institut Cl!ement Ader), Campus Jarlard, 81013 ALBI Cedex 09, France
Keywords: Ti-6Al-4V alloy Dynamic recrystallization Microstructural prediction Processing map Finite element simulation
a b s t r a c t
This work focuses on a series of microstructural predictions regarding the dynamic recrystallization (DRX) behavior, change in grain size and dislocation density. Additionally, this study includes the pre-diction of the room-temperature-strength and the processing map characterization of Ti-6Al-4V alloy after forging in the (aþb) region. The experimental tests of the forgings reveal that the mechanism of microstructural conversion depends on the testing conditions. That is, superplastic behavior is exhibited at lower strain rates and higher temperatures. With an increasing strain rate and decreasing tempera-ture, DRX occurs in a continuous manner. A set of constitutive equations that model the microstructural evolution, processing map characteristics and room temperature strengths is established by optimization of experimental data, followed by implementation into the DEFORM-3D software package. There is satisfactory agreement between the experimental and simulated results. Thus, a series of constitutive models (established in this work) is found to enable the reliable prediction of properties of Ti-6Al-4V alloy after forging in the (aþb) region.
1. Introduction
During hot deformation of metallic alloys, dynamic recovery (DRV) and dynamic recrystallization (DRX) occur thereby resulting in microstructural conversion[1]. The types of DRX process include (1) discontinuous dynamic recrystallization (DDRX), in which new grains are formed by heterogeneous nucleation and growth pro-cesses, and (2) continuous dynamic recrystallization (CDRX), in which subgrains with low-angle boundaries are formed that sub-sequently evolve into grains with a high fraction of high-angle boundaries, with increasing plastic strain.
Over the past few decades, phenomenological microstructure-evolution models based on the Johnson-Mehl-Avrami-Kolmogorov (JMAK) formulation[2]have been developed. These models succeeded in microstructural prediction during hot-working[3e7]. Additionally, the Avrami approach often provides
reasonable results. However, these models are usually only applied to specific or relatively narrow ranges with respect to the initial microstructure conditions, testing temperatures, strain rate, and strain. In addition, the physics-based models, such as the cellular-automaton (CA) model, the Monte-Carlo technique, and phase-field simulation have been developed over several years. These models make it possible for developing numerical solutions of the complex problems presented by microstructural evolution during thermomechanical processing within a unified frame. Despite their strengths, there are some drawbacks in that these models require excessive computer power to formulate a solution and the modeling is only applicable to selected local regions[8].
The Ti-6Al-4V alloy has been widely used for aerospace appli-cations due to its excellent properties including high specific strength, fracture toughness and corrosion resistance. With respect to numerical modeling for microstructural prediction under hot working of Ti alloys, a considerable number of studies have been conducted[9e16]since in the 2000s. Among these reports, Ding et al.[9]and Wu et al.[10]simulated the microstructures on the basis of CA model. Furthermore, there are reports that the
*Corresponding author.
mesoscale and microscale internal state variables model can be applied to microstructural prediction[11e13]. Sun et al. succeeded in microstructural prediction for the TA15 alloy based on the developed dislocation-density rate equation[11]. In addition, DRX fraction and grain size have been also successfully predicted ac-cording to the JMAK model[14e16]. With respect to evaluation of hot forging property, processing map technique[17,18]based on dynamic materials model (DMM) has been widely utilized for optimization of the process conditions.
The present work focuses on a series of microstructural pre-dictions (i.e., DRX behavior, the change in grain size and dislocation density) and processing map characteristics for forgings of Ti-6Al-4V alloy in combination with finite-element-method (FEM) anal-ysis. In addition, the 0.2% proof strength (at room temperature) after forging is also estimated on the basis of the simulated microstructural factors and classical strengthening factors accord-ing to the Hall-Petch relation, the Bailey-Hirsch relation, and simple constituent-phase-mixture-rule. This work first experimentally identifies the forging property and microstructural evolution of the Ti-6Al-4V alloy with the equiaxed (
a
þb
) starting microstructure. Next, constitutive formulas for predicting the microstructural evolution are established based on the optimization process from the experimental results, followed by implementation into FEM software (DEFORM-3D, v.10.2).2. Experimental procedures 2.1. Isothermal forging test
The Ti-6Al-4V alloy (hereafter designated as Ti-64 alloy) in this work was a commercial-grade alloy with chemical compositions (in wt.%) of 6.25 Al, 4.30 V, 0.20 O, 0.007 N, and the balance comprised of Ti. The starting microstructure (as shown in Fig. 1) before isothermal forging is an equiaxed (
a
þb
) microstructure having anaverage grain size of 2.25
m
m fora
phase. Theb
fraction for the initial condition is 7%. Isothermal forging was performed using the computer-aided ThermecMastor-Z equipment. During forging, process temperatures were 700"C, 800"C, and 900"C, while thestrain rates range from 10#3s#1to 10 s#1. Samples for forging were
prepared by electron discharge machining to dimensions with a diameter of 8 mm and a height of 12 mm. Induction heating of a specimen was carried out at 10"C/s up to the testing temperature
and maintained for 60 s to ensure the forging had a uniform tem-perature. The heat-up process was followed by forging at constant strain rate and to a height true-strain of approximately 0.7. After a compression test, the obtained stress-strain curves were corrected by a friction correction (based on reports by Li et al.[19,20]) and
adiabatic correction (based on the report by Mataya and Sack-schewsky[21]) in order to obtain accurate stress-strain curves. 2.2. Microstructural analysis
Microstructures were identified by conducting an electron back-scatter diffraction (EBSD) analysis. In EBSD analysis, grain orienta-tions were measured at step sizes of 0.12
m
m and 0.20m
m, and the EBSD data were post-processed by means of the TSL orientation imaging microscopy (OIM) data analysis software. The grain sizes of both high-angle-grains and low-angle-grains were measured using this software. In addition, the fraction of the DRX grain was iden-tified by counting the equiaxed-fine-grain in which the DRX occurred.2.3. Predictions of microstructures and forging properties combined with FEM analysis
Forging properties of Ti-64 alloy with the equiaxed (
a
þb
) microstructure are analyzed by FEM utilizing the DEFORM-3D software package (v. 10.2) through a user-defined subroutine. The forging condition in the simulation is similar to the experimental condition. In FEM simulation, the friction coefficient between the die-tools and the workpiece was set as 0.7. Due to the symmetry of the workpiece (with dimension of 8 mm in diameter and 12 mm in height), a quarter of it was taken as the object and the constraint was applied in the plane of symmetry. The data from the stress-strain curves obtained in this work, after the corrections were implemented, was programed into the FEM code.The constitutive equations for modeling of microstructure and mechanical properties are summarized in Section4.
3. Results and discussion
3.1. Experimental results of forging properties of Ti-64 with the equiaxed (
a
þb
) starting microstructure3.1.1. Stress-strain curves
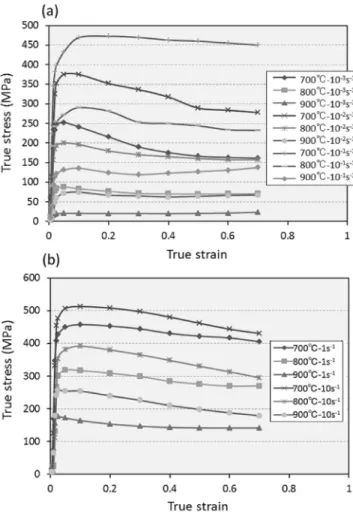
Fig. 2shows the stress-strain curves (tested at 700"C, 800"C,
and 900"C and the strain rates of (a) 10#3s#1, 10#2s#1, 10#1s#1and
(b)1 s#1, 10 s#1) after corrections for friction and increasing
tem-peratures. Extensive flow softening is observed with an increasing strain rate and decreasing testing temperature. For the testing conditions at higher temperature and lower strain rates, a steady stress state is exhibited. This steady state case implies that the DRV or CDRX is the dominant mode for microstructural conversion. Additionally, the continuous flow softening seen at lower temper-atures and higher strain rates may be attributed to flow instability, as already reported in research regarding hot deformation behavior of Ti alloys[22].
Fig. 3shows the relationship between the stress value at a true strain of 0.1 and the strain rate in Log-Log scale. The slope of m given by
ds
/d
_ε fromFig. 3corresponds to strain-rate sensitivity. The m values are also illustrated in Fig. 3, revealing the linear re-lationships at testing temperatures of 700"C. The m value is seen tobe higher with an increasing temperature. At testing temperatures of 800"C and 900"C, there are two slopes at the low strain rate
region and high strain rate region. The m value at 900"C and the
lower strain rate region is noted to exceed 0.3, indicating the occurrence of superplastic behavior.
The apparent activation energy Q for hot deformation is deter-mined by assuming the strain rate follows an Arrhenius type equation as follows:
Fig. 1. Initial microstructure of equiaxed (aþb) microstructure for hot compression test shown by EBSD-phase map image (gray phase:aphase and black phase:bphase).
_ε¼ A
s
nexp!#RTQ "(1)
where A is the material constant, R is gas constant, and n ¼ (1/m) is the stress exponent. The estimated Q value (in the (
a
þb
) region) in this work is 341.7 kJ/mol, which is similar to the Q values previously reported in Ti-64 alloy [22], but much greater than theself-diffusion activation energy (153 kJ/mol) in
b
-titanium alloy[23]. The higher values of Q in this work than the Q (self-diffusion acti-vation energy) are attributable to the occurrence of DRX of thea
phase.
3.1.2. Deformed microstructure after forging
The deformed microstructures are summarized in Fig. 4. The microstructures of the
a
phase are given in the EBSD-grain boundary maps (black line: high angle boundary, green line: low angle boundary). InFig. 4, the black phase corresponds to theb
phase. The microstructures having coarse equiaxed-grains are observed at the testing conditions of 800"C-10#3 s#1, 900 "
C-10#3 s#1 and 900" C-10#2s#1. According to the m values, these
testing conditions correspond to the region where superplasticity occurs. In other testing conditions, the microstructure consists of the deformed grains (in elongated morphology) and fine equiaxed DRX-grains, implying that the DRX is a dominant mode for microstructural conversion. Herein, it can be seen that the fraction of deformed grains (in the elongated morphology) tends to be higher with an increasing strain rate and decreasing temperature. Hereafter, the estimated DRX fractions would be applied to opti-mization of the material parameter in the JMAK formula (as indi-cated in section4.1).
During deformation, a microstructure is recognized to have evolved due to the occurrence of DRX or CDRX[22,24]. Typical deformed microstructures during deformation at 700"C-10 s#1in
this work are given inFig. 5. It can be observed that the subgrain formation (surrounded by low angle boundary) is enhanced with an increasing strain. Furthermore, fromFig. 5(d), the straining is found to result in the formation of fine equiaxed grains with a high angle boundary. Therefore, as similar to the case with other Ti al-loys, the DRX in the Ti-64 alloy with an equiaxed (
a
þb
) startingmicrostructure is enhanced in a continuous manner and accom-panied by subgrain formation and its subsequent rotation.
Hereafter, the Zener-Hollomon (Z) parameter given by
Z ¼ _εexp! QRT "
(2)
(where R is the gas constant (8.314 J/(mol K)), T is the absolute temperature and Q is the activation energy (341.7 kJ/mol) for hot deformation in the (
a
þb
) region), indicating the temperaturecompensated strain rate parameter is used for kinetic analyzing.
Fig. 6summarizes the relationship of DRX-grain size (for both low angle grain and high angle grain) and Z parameter in Log-Log scale. The average grain sizes were determined by measuring the sizes of high-angle-boundary-grains and low-angle-boundary-grains, respectively. Linear relationships are clearly seen for both high-and low-angle-grains, indicating that the grain size itself is dependent on the thermally activated process for controlling fine-grains formation. Furthermore, there is the higher value in the slope for high angle grains in the lower Z region (as shown in plots with empty circle) because the size of the DRX-high-angle-grain in this lower Z region is supposed to be strongly affected by grain growth (under a static and dynamic-manner). FromFig. 6, the re-lationships between the DRX grain size and Z parameter can be summarized as follows:
dDRXðhigh angle grainÞð
m
mÞ ¼ 125:49Z#0:134ðLogðZÞ < 15:2Þ (3)dDRXðhigh angle grainÞð
m
mÞ ¼ 1:847Z#0:013ðLogðZÞ ' 15:2Þ (4)and
Fig. 2. Corrected stress-strain curves at testing temperatures of 700"C, 800"C, 900"C
and strain rates of (a) 10#3s#1, 10#2s#1, 10#1s#1and (b) 1 s#1, 10 s#1.
Fig. 3. Relationship between flow stress (at ε of 0.1) and strain rate in the log-log scale at different testing temperatures.
dDRXðlow angle grainÞð
m
mÞ ¼ 4:004Z#0:061 (5)3.1.3. Processing map
In order to characterize forging property, construction of the processing maps according to the dynamic materials model[17,18]
is available. This model considers that the work piece is a power dissipater and that the instant power dissipated for a given _ε con-sists of two complementary parts: The G content and the J co-content, which are related to the temperature rise and micro-structural dissipation, respectively.
The efficiency of power dissipation
h
with normalizing theinstantaneous J with the maximum value of Jmaxcan be defined as:
h
¼J Jmax¼
2m
1 þ m (6)
According to the criterion proposed by Ziegler[25], continuum criterion for the occurrence of flow instability (
x
ð_εÞ) is given by:x
ð_εÞ ¼vln½m=ð1 þ mÞ)vln_ε þ m < 0 (7)
in which the equation considers the principle of the maximum rate of entropy production. Herein, flow instability occurs when
x
ð_εÞFig. 4. Microstructures (i.e, EBSD-grain boundary images) at the central location of specimen after compression test (at a height true strain of 0.7 and at different testing conditions).
Fig. 5. EBSD-grain boundary images (at central location of specimen) of Ti-64 alloy compressed at 700"C-10 s#1and at a height based on the true strains of (a) 0, (b) 0.1, (c) 0.35 and (d) 0.7.
becomes negative while a value ranging from 0 to 1 for
x
ð_εÞ is judged to be metastable manner. The processing maps were iden-tified by variation ofh
andx
ð_εÞ with deformation temperature and strain rate.Fig. 7summarizes the processing maps (at a true strain of 0.6) of the Ti-64 alloy with the equiaxed (
a
þb
) starting microstructure. Shaded areas represent the metastable domains (#1 <x
ð_εÞ < 0) or the unstable domains (x
ð_εÞ < #1). The obtained processing map characteristic is indeed similar to the case in the previous report on Ti-64 alloy[26,27]. The optimum power dissipation efficiency for Ti alloys can be estimated to be in the range of 40e50% based on the correlation of optimum power dissipation efficiency in the dynamic recrystallization domain with normalized stacking fault energy (SFE) for various metals[17].According to this consideration with the instability map, the optimum processing window can be identified in the region at strain rates less than 10#2s#1for all testing temperatures in which
the process window corresponds to superplastic deformation re-gion. The relatively higher
h
values exhibiting stable- or metastable-tendencies are also given at strain rates ranging from 10#1s#1to 10#2s#1. In fact, this process window corresponds to theregion where DRX (dominated by continuous manner) frequently occurs. In contrast, the region for temperatures below 750"C and at
higher strain rate corresponds to the domain with the lower
h
and unstable region, indicating that adiabatic shear banding deforma-tion is dominant for this condideforma-tion. Indeed, the localized defor-mation zone with shear band fordefor-mation is confirmed in the deformed specimen tested at 700"C-10 s#1. At the higher strainrate region inFig. 7, it can also be noted that the plastic deformation proceeds from unstable manner to stable manner as the testing temperature increases. This implies that the adiabatic effect de-creases with increasing testing temperature, even though the lower power dissipation efficiency remains at the higher strain rate region.
4. Predictions of microstructures and forging properties by FEM analysis combined with various constitutive laws 4.1. Microstructure predicted by FEM analysis combined with various constitutive laws
In this study, the characteristic of DRX behavior is described by Johnson-Mehl-Avrami-Kolmogorov (JMAK) equation in the following[28]: XDRX¼ 1 # exp " #
b
d* ! ε # εc ε0:5 "kd# ðε ' εcÞ (8)where XDRXis the DRX fraction,
b
dand kdare material constants, ε isthe true strain, and εcis the critical strain for DRX initiation. The ε0.5
is calculated as: ε0:5¼ a1dn1 0 _εm1exp!QRT1 " (9a)
b
D¼b
0exp ! #QRT2 " (9b)where _ε is the strain rate, and a1, n1, m1, kd, Q1, Q2,and
b
0are materialconstants. The term d0(
m
m) is the initial grain size beforedefor-mation. The critical strain (εc) is determined by the peak strain (εp)
(which is experimentally identified) as follows:
εc¼ 0:8 * εp (10)
And the critical strain (εc) is summarized by the relationship
with the Z parameter as follows:
εc¼ C1Zn2 (11)
The material constants in the above equations are determined on the basis of the minimization of the sum of the errors between the experimental- and calculated data. The obtained material constants are given inTable 1.
With respect to the modeling of the grain growth, the static grain growth behavior is expressed in the following equation of Eq.
Fig. 6. Relationship between Zener-Hollomon (Z) parameter and the DRXa-grain size for high angle grain and low angle grain. The sizes of high- and low-angle grains are expressed by circle plots and square plots, respectively. The filled circle corresponds to the DRX-grain-size and the hollow circle does the grain size affected by not only the DRX behavior but also the dynamic grain growth behavior.
Fig. 7. Processing map for the Ti-6Al-4V alloy with the equiaxed (aþb) starting microstructure, at a height true strain of 0.6. Shaded areas represent the metastable- or the unstable domains.
Table 1
Material constants for the constitutive models of dynamic recrystallization. a1 n1 m1 Q1(J mol) kd b0 Q2(J mol) C1 n2 0.354 0.0779 0.0361 15973 2 1.071 7008 0.0269 0.0191
(12)according to the Lifshitz-Slyosov-Wagner (LSW) theory[29]. The term da is grain size (
m
m) ofa
ophase. The n value (in the following) is set to 3 because of the deformation condition in this work is in the (a
þb
) region.dna# dna0¼ d3a# d3a0¼ Kdðt # t0Þ (12)
in which the subscript ‘0’ indicates the quantities at the initial stage and Kddenotes the coarsening rate constant. The term Kdis defined
as the temperature dependent material constant and expressed as following Arrhenius relationship:
Kd¼ K0exp
! #QRTgbg
"
(13)
in which K0and Qgbgare the material constants.
It is well recognized that the grain growth rate in dynamic conditions (under plastic deformation) is higher than that in static conditions, due to the strain (or stress) induced effects. Therefore, the dynamic grain growth rate of Kd0is defined by the
multiplica-tion with the weighting factor of n0. The term n0is expressed as
following relationship with Z parameter:
n0¼ C 2Zn3 (14) and K0 d¼ n0 # K0exp!#QRTgbg "$ (15)
Summarizing the above equations, the grain size of the
a
phase (da(growth)) which considers the effect of grain growth can besummarized as following relationship:
%
daðgrowthÞ&3¼#K0exp!#QRTgbg "$ t þ n0#K 0exp ! #QRTgbg "$ t þ d30 (16)
In order to identify the material constants for modeling the grain growth, the grain growth data was referred according to Ref.[30]for static growth and Refs.[31,32]for dynamic growth, followed by optimization of the material constants by non-linear
regression analysis. Additionally, the determined material con-stants are given inTable 2.
Fig. 8summarizes the relationship between the DRX fraction and the true strain for the experimental result, when tested at 700"C (shown by symbols) and the predicted result (shown by
solid line) according to Eq.(8). The results obtained are in a good agreement with the experimental results. The change in the DRX fraction is observed to be dependent on the strain, temperature and strain rate. Additionally, the DRX kinetic curves are characterized by an S-shape.
The microstructural evolution model (as stated above) has been implemented into the finite-element software of DEFORM-3D (ver. 10.2) through a user-subroutine followed by simulation of isothermal compression.Fig. 9shows distributions of (a) effective strain, (b) the predicted DRX ratio and (c) the predicted average grain size (dave) of the
a
phase for compression at 900"C-1 s#1andat the true strain height of 0.7. Herein, the daveis represented by:
dave¼ XDRXdDRXþ ð1 # XDRXÞd0 (17)
where d0is initial grain size of
a
phase of 2.25m
m withconsider-ation of the grain growth in terms of Eq.(17).
As shown inFig. 9(a), there is a heterogeneous distribution that strains are locally accumulated especially at central region. Addi-tionally, the less strain region, called the dead-zone, is seen in Re-gion B. Herein, the effective strain in ReRe-gion A reaches the value of 1.5, and there is a decrease from Region A to the Region C. Although the distributions of effective strain rate and temperature are not given in Fig. 9, heterogeneous distributions have been also confirmed. With respect to the distribution of the DRX ratio (Fig. 9(b)), DRX is found to have frequently occurred 70%e80% in Region A, whereas no occurrence of DRX is in the dead-zone of the Region B. The distribution of the DRX ratio is found to exhibit good correlation with that of the effective strain (Fig. 9(a)). Moreover, with respect to the grain size distribution (Fig. 9(c)), in correlation with the result of the DRX ratio, the finer grain size is seen in Region A where the DRX frequently occurs, while there are coarser size distributions in Regions B and C.
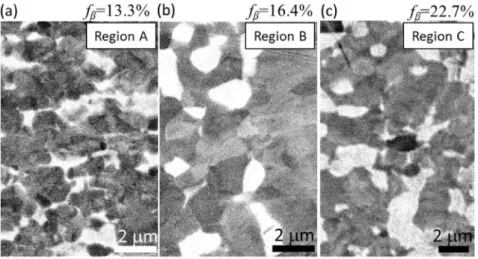
For comparison with the experimental result, microstructures in Regions A, B and C (expressed inFig. 9), as observed by SEM, are given inFig. 10. The DRX accompanied by the fine-grain-formation is seen to be frequently activated in Region A (Fig. 10(a)). On the other hand, equiaxed grain-microstructure having the similar grain size for the initial conditions is observed in Region B (Fig. 10(b)). In addition, the microstructure in Region C exhibits coarser grained microstructure than that in Region A. This reveals that the experi-mental result is in good agreement with the simulated result (Fig. 9). Thus, it can be found that the constitutive models in this work allow to accurately predict the microstructural evolution.
Table 2
Material constants for the constitutive models of grain growth.
k0 Qgbg(J mol) C2 n3
2.62 * 107 220000 0.0093 0.233
4.2. Prediction of processing map characteristic
As abovementioned in Section 3.1.3, the efficiency of power dissipation is expressed in Eq.(6)with parameter of the m value. Hence, m is an important variable for predicting the efficiency of power dissipation. The experimentally determined m values (at true strains of 0.1 and 0.6) are summarized as a function of the Z parameter (in log scale), as shown inFig. 11. There are no apparent changes in m with the change in true strain. Therefore, we can judge that m is not influenced by the change in strain. The spline-fitting curve by approximation (in a cubic polynomial) is also indicated inFig. 11, and the formula of this approximation is as follows:
m ¼ #0:0044ðlog10ðZÞÞ3þ 0:2235ðlog10ðZÞÞ2# 3:824 log10ðZÞ
þ 22:169
(18)
In order to predict distributions of the processing map charac-teristics, the constitutive equations of (6), (7) and (18) were implemented in the DEFORM system. For predicting the processing map characteristics, the m value in the simulation is set to be constant value of 0.5 if the calculated m value obtained by Eq.(18)is above 0.5.Fig. 12(a)(b) illustrates the distributions of (a) the effi-ciency of power dissipation, as calculated by Eq.(6), and (b)the instability criteria, as evaluated by Eq.(7), which is forged for the conditions at 900"C-1 s#1. With respect to the instability criteria
(Fig. 12(b)), plastic deformation is found to occur in a metastable manner in the vicinity of the central region, whereas, the stable manner is given in the dead-zone region. This is due to the corre-lation with the distribution of effective strain rate that the extremely lower effective strain rate exhibits in the vicinity of the
dead-zone. When associated with the distribution of the effective strain rate, it results in an apparent higher efficiency of power dissipation in the vicinity of the dead-zone (edge of specimen) region rather than that at the central region. However, this result does not correlate with the distribution of the microstructures of the DRX fraction and grain size (as shown inFig. 9(b)(c)) since Eq.
(6)does not consider the effect of straining. Therefore, modification of Eq.(6)is required in order to simulate the more reliable
h
, whichalso considers the effect of straining. The modified efficiency of
Fig. 9. Distribution from the FEM analysis for (a) Effective strain, (b) DRX fraction and (c) Average grain size for theaphase at compression of 900"C-1 s#1and a height for the true strain of 0.7.
Fig. 10. SEM micrographs of Ti-6Al-4V alloy after deformation of 900"C-1s#1and a height for the true strain of 0.7: (a) Region A, (b) Region B and (c) Region C inFig. 9.
Fig. 11. Relationship between the strain rate sensitivity (m) and the Zener-Hollomon (Z) parameter (in log scale) for the true strains of 0.1 and 0.6 based on an approxi-mation curve.
power dissipation of
h
0is herein defined as follows:h
0¼h
* f ðεÞ (19)f ðεÞ ¼ 1 # expð # εÞ (20)
where ε is effective strain.
In this equation, the efficiency of the power dissipation is modified by multiplying with the term f(ε) which is a similar type of equation as the JMAK equation. Thus, the efficiency of the power dissipation can contain the effect of the strain through the f(ε) parameter.Fig. 12(c) and (d) show the distributions of the modified efficiency of the power dissipation of
h
0deformed at 900"C-1 s#1and 800"C-1 s#1. Despite the difference when compared with the
distribution of
h
(inFig. 12(a)), the good correlation can be seen betweenh
0 and the occurrence of dynamic recrystallization(Fig. 9(b)). Therefore, in order to express the more reliable pro-cessing map behavior, it seems reasonable to adopt the multipli-cation of
h
by the term f(ε).4.3. Room-temperature-strength (or hardness) after forging During hot deformation, plastic deformation leads to the accu-mulation of dislocations, while DRV annihilates dislocations. In this study, the Kocks-Mecking equation (K-M model) [33] was employed to describe the dislocation evolution. In the K-M model, the dislocation accumulation rate (d
r
/dε) due to plastic deforma-tion is propordeforma-tional tor
1=2, and the dislocation annihilation due to thermal-activated-process of DRV is proportional tor
. The equation of K-M model is as follows:d
r
dε ¼k1pffiffiffi
r
# k2r
(21)where the first and the second term represent the dislocation accumulation by work hardening and dislocation annihilation via DRX, respectively. The terms k1and k2are the rates of dislocation
storage and dislocation annihilation via DRX, respectively. DRV is a thermally activated process induced by dislocation-slip or climb;
hence, the parameter k2in Eq.(21)is a function of the temperature
and strain rate and is expressed as follows:
k2¼ k0_εm2#1exp!#QCL
RT "
(22)
where the QCLis the activation energy for dislocation cross-slip and
recombination.
The macroscopic flow stress (
s
) during isothermal hot compression is related to the average dislocation density, which can be expressed by:s
¼ 0:5m
ðTÞbpffiffiffir
(23)The parameter b is the burgers vector of the
a
phase (¼ 2.95 * 10#10 m) and the parameterm
(T) is the temperaturedependent shear modulus (GPa)[12];
m
ðTÞ ¼ 49:02 #e181=T5:821# 1 (24)
The material constants were optimized on the basis of the cor-rected experimental stress-strain curves by non-linear regression analysis. Herein, the material parameters were determined by assuming the parameter
r
0 (initial dislocation density) to be1.0 * 1010m#2. The determined material parameters of k 1, k2, m2,
and QCL are 3.37 * 1011, 6.33 * 105, 0.937, and 39182 (J/mol)
respectively. The distribution of the dislocation density (
r
) esti-mated by the above K-M model in specimen compressed at 900"C-1 s#1and at a height strain of 0.7 is shown inFig. 13(a). Similar to
the distributions of the effective strain, the DRX ratio, and the average grain size (fromFig. 9) shown in Fig. 13(a) exhibits het-erogeneous distribution where the dislocation accumulates espe-cially within the central region. The higher dislocation density results in a higher stored energy, and leads to an enhancement of the DRX. Hence, the good correlation between the distributions of the dislocation density (
r
) (Fig. 13(a)) and the DRX ratio (Fig. 9(b)) is revealed.As abovementioned, the typical microstructural evolutions of the DRX, the grain size and the dislocation density were
Fig. 12. Distributions from the FEM analysis for (a) Efficiency of power dissipation, (b) Instability map, and (c), (d) Modified efficiency of power dissipation at testing conditions of (a)(b)(c) 900"C-1 s#1and (d) 800"C-1 s#1.
successfully predicted. Hereafter, by considering the above-predicted microstructural data, we work to establish the model for predicting the room temperature strength of the product after forging. In estimation of the yield stress (0.2% proof stress) of the forged product, the classical models of the Hall-Petch relation and the Bailey-Hirsch relation were applied to the estimation of strength. Regarding the effect of grain size on strength, the incre-ment of yield stress (
s
H-P) according to Hall-Petch effect isexpressed as:
s
H#P¼ Kyd#0:5a (25)where Kyand daare the Hall-Petch coefficient and
a
-grains size, respectively. According to previous reports revealing the Hall-Petch effect of Ti-64 alloy[34e36], the Hall-Petch coefficient ranges from 0.135 MPa/(m#1/2) to 0.46 MPa/(m#1/2). This work estimates theHall-Petch relation with the coefficient of 0.25 MPa/(m#1/2). The
dislocation contribution to strengthening (
s
B-H), according to theBailey-Hirsch relation, is stated as follows:
s
B#H¼ 0:5m
br
1=2 (26)It can be summarized the microstructural effect on 0.2% proof stress (
s
0.2) as follows:s
0:2¼s
0þs
H#Pþs
B#H (27)where the
s
0is the friction stress (¼ 760 MPa[36]). The estimated0.2% proof stress after forging at 900"C-1s#1and at a height strain
of 0.7 is given inFig. 13(b), revealing the heterogeneous distribution of strength. The highest proof stress of approximately 1180 MPa is exhibited within the central region where the DRX is frequently activated, while the lower proof stress around 1080 MPa is seen within the dead-zone region (in upper- and downward-region in specimen). In order to compare this simulated result with the experimental strength in the forged specimen, the experimental hardness results obtained by Vickers-hardness testing were con-verted to a yield stress according to Hill's law[37]. The simulated 0.2% proof stress and the experimental yield stress (converted from the Vickers hardness) at the locations along A-B and A0-B0, as
illustrated inFig. 13(b), are summarized inFig. 14. There is a dif-ference of approximately 60 MPae70 MPa between the experi-mental result and the simulated result. The effect of the
b
-fraction on the change in strength is not considered in Eq.(27). As seen inFig. 10, the
b
-fraction is indeed different depending on location in a compressed specimen, which is attributable to the difference in temperature during deformation and the cooling rate after forging. According to the relationship between the 0.2% proof stress and theb
-fraction[38], the effect of theb
-fraction on the strength (s
M-R)can be expressed as following equation:
s
M#R¼ 940:7 # 272:3 fb (28) where the fb isb
#fraction, and the right term of 940.7 MPa corresponds to the 0.2% proof stress ofa
phase. InFig. 13, the results after this modification into Eq.(27)are also given. FromFig. 13, we can confirm that the modification with the effect of theb
phase results in close approximations to the experimental values. More-over, a similar tendency regarding the change in the proof stress along A-B and A0-B0lines is observed for the experimental and thesimulated results. Hence, the room-temperature strength after forging is found to be reasonably simulated by the association with the classical models of the Hall-Petch relation, the Bailey-Hirsch relation, and the simple mixture rule.
As abovementioned, the constitutive models embedded into the DEFORM-3D platform were found to provide an approximate agreement with the experimental results (e.g., microstructures, processing map characteristic, and room temperature strength af-ter forging). For additional, highly accurate prediction of the microstructure, a further direction of this study will be to focus on the appropriate combination of phenomenological models and internal-variable-based constitutive models.
5. Summary
The present work focused on a series of predictions regarding microstructures, DRX behavior, the change in grain size, and dislocation density as well as the processing map characteristic during forging of the Ti-64 alloy at temperatures in the (
a
þb
) re-gion, which is in combination with finite-element-method (FEM)Fig. 13. Distributions from the FEM analysis of (a) Dislocation density and (b) 0.2% proof stress at room temperature after forging. Compression condition is 900"C-1 s#1and a height of the true strain of 0.7.
Fig. 14. Experimental and simulated 0.2% proof stress along the A to B line and A0to B0
analysis. The obtained results are as follows.
(1) Experimental study of the forging of the Ti-64 alloy at the (
a
þb
) region reveals that superplastic behavior is dominant for a condition of lower strain rate and higher temperature, whereas DRX under continuous method is dominant for the relatively higher strain-rate, lower temperature region. The relationship between the DRX grain size and Z parameter exhibits a linear-relationship, indicating that the grain size itself is dependent on the thermally activated process for controlling fine-grains formation. The processing map ob-tained in this work is in good agreement with the behavior of the microstructural conversion. That is, a higher efficiency of power dissipation (h
) is given in the region where DRX frequently occurs.(2) Constitutive models for microstructural prediction, process-ing map characteristics and room temperature strength were established through an optimization process (based on experimental results) of the material parameters. The DRX behavior could be reasonably expressed in terms of the JMAK constitutive equation. The modified equation for efficiency of the power dissipation enables the simulation to more reli-ably correlate with the DRX behavior. Thus, the simulated results according to these constitutive models are in good agreement with the experimental results. Furthermore, it is found that the strength at room temperature after forging can be reasonably simulated by classical constitutive models according to the Hall-Petch relation, the Bailey-Hirsch rela-tion, and simple mixture rule. Additionally, this simulated strength also exhibits satisfactory similarities with the experimental results. Thus, a series of constitutive models, as established in this work, is found to enable the reliable prediction of microstructures and properties of Ti-6Al-4V alloy after forging in the (
a
þb
) region.References
[1] R.D. Doherty, D.A. Hughes, F.J. Humphreys, J.J. Jonas, D. Juul Jensen, M.E. Kassner, W.E. King, T.R. McNelley, H.J. McQueen, A.D. Rollett, Current issues in recrystallization: a review, Mater. Sci. Eng. A238 (1997) 219e274. [2] F.J. Humphreys, M. Hatherly, Recrystallization and Related Annealing
Phe-nomena, Pergamon Press, Oxford, 1995.
[3] C.M. Sellars, Modelling microstructural development during hot rolling, Mater. Sci. Technol. 6 (1990) 1072e1081.
[4] H.J. McQueen, Development of dynamic recrystallization theory, Mater. Sci. Eng. A 387e389 (2004) 203e208.
[5] A. Laasraoui, J.J. Jonas, Recrystallization of austenite after deformation at high temperature and strain rates-analysis and modeling, Metall. Trans. A 22 (1991) 151e160.
[6] S.I. Kim, Y. Lee, D.L. Lee, Y.C. Yoo, Modelling of AGS and recrystallisation fraction of microalloyed medium carbon steel during hot deformation, Mater. Sci. Eng. A 355 (2003) 384e393.
[7] H.S. Jeong, J.R. Cho, H.C. Park, Microstructure prediction of Nimonic 80A for large exhaust valve during hot closed die forging, J. Mater. Proc. Tech. 162e163 (2005) 504e511.
[8] F. Chen, Z. Cui, J. Chen, Prediction of microstructural evolution during hot forging, Manuf. Rev. 1 (6) (2014) 1e21.
[9] R. Ding, Z.X. Guo, Microstructural evolution of a Tie6Ale4V alloy duringb -phase processing: experimental and simulative investigations, Mater. Sci. Eng. 365A (2004) 172e179.
[10] C. Wu, H. Yang, H.W. Li, Simulated and experimental investigation on discontinuous dynamic recrystallization of a near-a TA15 titanium alloy during isothermal hot compression inbsingle-phase field, Trans. Nonferrous Met. Soc. China 24 (2014) 1819e1829.
[11] Z.C. Sun, H. Yang, G.J. Han, X.G. Fan, A numerical model based on internal-state-variable method for the microstructure evolution during hot-working process of TA15 titanium alloy, Mater. Sci. Eng. A 527 (2010) 3464e3471. [12] X.G. Fan, H. Yang, Internal-state-variable based self-consistent constitutive
modeling for hot working of two-phase titanium alloys coupling micro-structure evolution, Int. J. Plast. 27 (2011) 1833e1852.
[13] E. Alabort, D. Putman, R.C. Reed, Superplasticity in Tie6Ale4V: characterisa-tion, modelling and applications, Acta Mater. 95 (2015) 428e442. [14] G.Z. Quan, G.C. Luo, J.T. Liang, D.S. Wu, A. Mao, Q. Liu, Modelling for the
dy-namic recrystallization evolution of Tie6Ale4V alloy in two-phase tempera-ture range and a wide strain rate range, Comput. Mater. Sci. 97 (2015) 136e147.
[15] D.L. OuYang, M.W. Fu, S.Q. Lu, Study on the dynamic recrystallization behavior of Ti-alloy Tie10Ve2Fee3Al inbprocessing via experiment and simulation, Mater. Sci. Eng. A619 (2014) 26e34.
[16] K.L. Wang, M.W. Fu, S.Q. Lu, X. Li, Study of the dynamic recrystallization of Tie6.5Ale3.5Moe1.5Zre0.3Si alloy inb-forging process via finite element method modeling and microstructure characterization, Mater. Des. 32 (2011) 1283e1291.
[17] Y. Prasad, T. Seshacharyulu, Modeling of hot deformation for microstructural control, Int. Mater. Rev. 43 (1998) 243e258.
[18] Y. Prasad, Modeling of dynamic material behavior in hot deformation: forging of Ti-6242, Metall. Mater. Trans. 15A (1984) 1883e1892.
[19] Y. Li, E. Onodera, A. Chiba, Friction coefficient in hot compression of cylindrical sample, Metall. Mater. Trans. 51A (2010) 1210e1215.
[20] Y. Li, E. Onodera, H. Matsumoto, Y. Koizumi, S. Yu, A. Chiba, Development of novel methods for compensation of stress-strain curves, ISIJ Int. 51 (2011) 782e787.
[21] M. Mataya, V. Sackschewsky, Effect of internal heating during hot compres-sion on the stress-strain behavior of alloy 304L, Metall. Mater. Trans. 25A (1994) 2727e2752.
[22] I. Weiss, S.L. Semiatin, Thermomechanical processing of alpha titanium alloysdan overview, Mater. Sci. Eng. A 263 (1999) 243e256.
[23] I. Weiss, S.L. Semiatin, Thermomechanical processing of beta titanium alloysdan overview, Mater. Sci. Eng. A243 (1998) 46e65.
[24] S. Zherebtsov, M. Murzinova, G. Salishchev, S.L. Semiatin, Spheroidization of the lamellar microstructure in Tie6Ale4V alloy during warm deformation and annealing, Acta Mater. 59 (2011) 4138e4150.
[25] H. Ziegler, in: I.N. Sneddon, R. Hill (Eds.), Progress in Solid Mechanics, vol. 4, 1965, pp. 91e193.
[26] T. Seshacharyulu, S.C. Medeiros, W.G. Frazier, Y.V.R.K. Prasad, Hot working of commercial Tie6Ale4V with an equiaxed aeb microstructure: materials modeling considerations, Mater. Sci. Eng. A284 (2000) 184e194.
[27] J. Luo, P. Ye, M.Q. Li, L.Y. Liu, Effect of the alpha grain size on the deformation behavior during isothermal compression of Ti-6Al-4V alloy, Mater. Des. 88 (2015) 32e40.
[28] C.M. Sellars, J.A. Whiteman, Recrystallization and grain growth in hot rolling, Metal. Sci. 13 (1979) 187e194.
[29] J.W. Martin, R.D. Doherty, B. Cantor, Stability of Microstructure in Metallic System, Cambridge University Press, Cambridge, United Kingdom, 1997. [30] C.H. Johnson, S.K. Richter, C.H. Hamilton, J.J. Hoyt, Static grain growth in a
microduplex Tie6Ale4V alloy, Acta Mater. 47 (1999) 23e29.
[31] C.A. Sargent, A.P. Zane, P.M. Fagin, A.K. Ghosh, S.L. Semiatin, Low-temperature coarsening and plastic flow behavior of an alpha/beta titanium billet material with an ultrafine microstructure, Metall. Mater. Trans. 39A (2008) 2949e2964.
[32] S.L. Semiatin, P.N. Fagin, J.F. Betten, A.P. Zane, A.K. Ghosh, G.A. Sargent, Plastic flow and microstructure evolution during low-temperature superplasticity of ultrafine Ti-6Al-4V sheet material, Metall. Mater. Trans. 41A (2010) 499e512. [33] U.F. Kocks, H. Mecking, Physics and phenomenology of strain hardening: the
FCC case, Prog. Mater. Sci. 48 (3) (2003) 171e273.
[34] R. Armstrong, I. Codd, R.M. Douthwaite, N.J. Petch, The plastic deformation of polycrystalline aggregates, Phil. Mag. 7 (1962) 45e58.
[35] Y. Long, H. Zhang, T. Wang, X. Huang, Y. Li, J. Wu, H. Chen, High-strength Tie6Ale4V with ultrafine-grained structure fabricated by high energy ball milling and spark plasma sintering, Mater. Sci. Eng. A 585 (2013) 408e414. [36] J. Thomas, M. Groeber, S. Ghosh, Image-based crystal plasticity FE framework
for microstructure dependent properties of Tie6Ale4V alloys, Mater. Sci. Eng. A 553 (2012) 164e175.
[37] R. Hill, The Mathematical Theory of Plasticity, Oxford University Press, 1967. [38] Y. Sun, W. Zeng, Y. Han, Y. Zhao, G. Wang, M.S. Dargusch, P. Guo, Modeling the correlation between microstructure and the properties of the Tie6Ale4V alloy based on an artificial neural network, Mater. Sci. Eng. A 528 (2011) 8757e8764.