HAL Id: hal-00748893
https://hal.archives-ouvertes.fr/hal-00748893
Submitted on 12 Nov 2012HAL is a multi-disciplinary open access archive for the deposit and dissemination of sci-entific research documents, whether they are pub-lished or not. The documents may come from teaching and research institutions in France or abroad, or from public or private research centers.
L’archive ouverte pluridisciplinaire HAL, est destinée au dépôt et à la diffusion de documents scientifiques de niveau recherche, publiés ou non, émanant des établissements d’enseignement et de recherche français ou étrangers, des laboratoires publics ou privés.
Monitoring industrial pharmaceutical crystallization
processes using acoustic emission in pure and impure
media.
Nesrine Gherras, Eric Serris, Gilles Févotte
To cite this version:
Nesrine Gherras, Eric Serris, Gilles Févotte. Monitoring industrial pharmaceutical crystallization processes using acoustic emission in pure and impure media.. International Journal of Pharmaceutics, Elsevier, 2012, 439 (1-2), pp.109-119. �10.1016/j.ijpharm.2012.09.048�. �hal-00748893�
Monitoring Industrial Pharmaceutical Crystallization Processes Using Acoustic
Emission in Pure and Impure Media.
GHERRAS Nesrinea, SERRIS Erica et FEVOTTE Gillesa,b∗ a
Ecole des Mines de Saint Etienne, centre SPIN, LPMG, FRE CNRS 3312.
5
158, cours Fauriel. 42000 Saint Etienne (France) b
Université de Lyon, Université Lyon 1, 43 bld du 11 Novembre 1918. 69100 Villeurbanne (France)
Abstract.
Acoustic Emission (AE) which has been successfully applied for monitoring a rather wide variety of
10
solids elaboration processes was almost never evaluated in the field of industrial pharmaceutical crystallization. Few papers reported that solution crystallization processes give rise to acoustic emission signals that could be related to the development of the basic crystallization phenomena. This study is intended to demonstrate new perspectives opened up by the possible use of Acoustic Emission (AE) as a non-intrusive and non destructive sensor for monitoring solution crystallization
15
with a particular focus being put on the presence of impurities in real industrial processes. The wealth of acquired AE information is highlighted and it is suggested that such information could allow the design of innovative multipurpose sensing strategies. It is shown notably that AE provides a very early detection of nucleation events, much before the onset of the so-called “nucleation burst”. It is also shown that AE brings new insight into the effect of impurities on both the development of
20
the crystallization process and the quality of the crystallized product.
Keywords: Acoustic emission, Crystallization, In situ sensors, Impurities, Nucleation, Monitoring.
25
2
1. Introduction
The pharmaceutical industry is set against strong requests on behalf of both consumers and regulatory agencies to improve the quality of its products as well as its manufacturing practices. As most Active Pharmaceutical Ingredients (APIs.) are delivered in solid forms, improving the monitoring and control of industrial crystallizers is therefore an important current industrial concern
30
(Sistare et al., 2005; Yu et al., 2004, 2007; Birch et al., 2005). In fact, it is well known that controlling the particulate properties of APIs is in strong connection with mastering the properties of solid Active Pharmaceutical Ingredients (APIs.)
Crystallization is widely used as a separation and purification process, and also as a means of generating particles with specified end-use properties. Many particle features are connected to the
35
drug end-use properties, such as the Crystal Size Distribution (CSD), crystal habit, chemical purity, crystallinity, polymorphic state, etc. These latter properties can exert a significant impact on the therapeutic efficacy of APIs. However, despite its apparent simplicity, crystallization is a complex process as many concomitant, changeable and competitive phenomena take place simultaneously during its progress. Basic mechanisms such as primary and secondary nucleation, crystal growth,
40
attrition and/or agglomeration are likely to occur in a poorly reproducible way during crystallization operations, and can result in undesirable batch-to-batch variability of the product. In particular, it is recognized that the unavoidable presence of impurities in industrial crystallization media can cause major irreproducibility in both the development of crystallization operations and in the quality of the final solid products.
45
One of the possible means of improving the quality of pharmaceutical products is to apply advanced process monitoring and control strategies which, obviously, strongly rely on the development of efficient, robust and practical sensors. Among others, this observation explains why
the US Federal Drug Administration (FDA) promoted the PAT initiative (Process Analytical
50
Technology) which aimed at encouraging the pharmaceutical industry to collect real time process information, detect and control possible undesirable variations of unit process operations and branch out new means of analyzing and correcting past operations. As far as crystallization control is concerned, it can roughly be said that two kinds of measurements were developed during the past 15 years: measurements of variables characterizing the liquid continuous phase, among which
55
supersaturation is a parameter of great importance, and measurements of variables describing the dispersed solid phase, the size distribution of particles notably.
Acoustic Emission (AE) is widely used as a nondestructive sensing method, it has been applied to a wide variety of real time process monitoring applications, even though it was less frequently envisaged in pharmaceutical process industry. Monitoring various chemical engineering processes
60
was reported (Boyd and Varley, 2001) including fluidized bed granulation (Leskinen et al., 2010), fluidized bed coating, drying (Vervloet et al., 2010), powder compaction (see e.g. Wadley & Mehrabian, 1984; Sawada et al., 1985; Waring et al. 1987; Serris et al. 2002). However, few studies deal with the AE monitoring of crystallization processes (Sawada et al, 1985; Ersen et al., 2006, Lube & Zlatkin, 1989)
65
The AE equipment is based on a transducer acoustically coupled to materials undergoing dynamic changes. The sensor detects the elastic energy of acoustic waves propagating from the physical source of AE and thus acquires information about the dynamic changes taking place in the AE sources (Grosse & Ohtsu, 2008). Thanks to its non-intrusive and non-destructive features, and to the possibility of developing in-line applications, it is shown below that acoustic emission (AE)
70
might be a very attractive technique for monitoring batch cooling solution crystallization operations. The objective of this work is thus to evaluate the potential for using acoustic emission to monitoring polythermal batch crystallization in pure solvents and in the presence of impurities.
4
A basic concept behind AE monitoring of industrial processes is that the phase transitions occurring during crystallization in solution induce local physicochemical changes in the suspension
75
yielding release of energy (Wade, 1990). Acoustic elastic waves are thus generated and propagate in the liquid medium. Meanwhile, as crystal particles are generated, the elastic properties of the dispersed phase change. Changes of suspension properties affect the acoustic emission caused, for example, by the generation of new crystal phases, particle collision impacts and inter-particles and/or particles-wall frictions. The elasticity of crystals and their kinetic energy are also affected by many
80
other properties such as size, shape, hardness, density, uniformity of composition which can be affected by the many process operating conditions.
2. Material and method
2.1 Experimental set-up
85
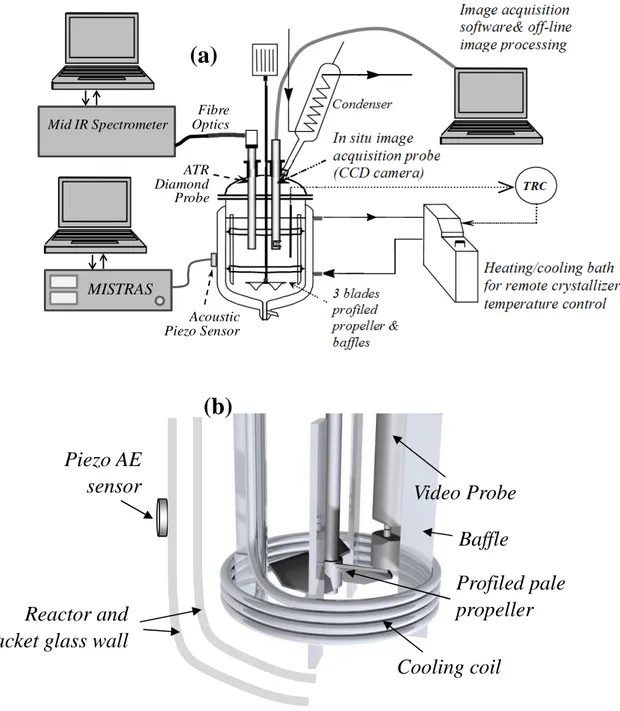
The solute selected for the study is Ammonium Oxalate monohydrate referred to as AO in the following. AO was commercially available from Acros Organics with a purity level of 99+%. The powder was used without further purification. Crystallization experiments were performed in distilled water, AO was dissolved in water with a concentration of 0.1 kg/kg solution. A schematic of
90
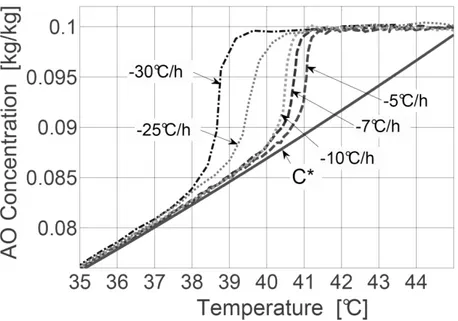
the crystallizer is shown in Fig.1a while Fig.1b presents a 3D representation of devices inserted in the glass vessel. The initial temperature was about 42°C, a temperature at which the solution was undersaturated. Figure 2 displays the solubility curve. The experiments were carried out with various cooling rates until the final batch temperature of 20°C was reached. Nucleation occurred during the batch unseeded experiments at a temperature depending on the cooling rate, as shown in Fig.2. In
95
order to evaluate the effect of operating conditions on the crystallization process, varying constant cooling rates were applied during the experiments: R= dT/dt= -2;-5;-7;-10;-20;-25 and -30°C/h. A
schematic of the experimental setup is presented in Fig. 2. More details about the overall experimental design were reported by Gherras and Fevotte (2012).
100 Mid IR Spectrometer MISTRAS ATR Diamond Probe Acoustic Piezo Sensor Fibre Optics
Figure 1. (a) Schematic of the lab-scale crystallization setup: temperature controlled batch
105
crystallizer equipped with ATR-FTIR probe, in situ image acquisition probe and acoustic emission testing devices. (b) Drawing of the set of equipments inside the reactor, the piezo-sensor is stuck on the glass reactor wall with coupling grease.
(a)
Video Probe
(b)
Cooling coil
Baffle
Profiled pale
propeller
Piezo AE
sensor
Reactor and
jacket glass wall
6 110
Figure 2. Typical concentration profiles measured using ATR FTIR in situ spectroscopy during the cooling solution crystallization of AO in pure water. The solubility curve C* was also measured using ATR FTIR .
The volume of the glass vessel was 2.5 L. The reactor was equipped with a jacket and a
115
condenser. The temperature in the reactor was controlled by manipulating the set-point temperature of a heating bath containing water and glycol. The temperature control error was about ± 0.05°C. The jacket was baffled in order to increase the flow-rate of the fluid circulating in the thermostated bath and thus, to improve the heat transfer capacity. Stainless steel baffles and a high efficiency propeller (Mixel TT TM) were set in the crystallizer so as to maintain a good homogeneity of the particles in
120
suspension. The whole operating device was instrumented and computer controlled to track linear temperature trajectories.
The initial solution was prepared by dissolution of AO (0.1 kg AO/ kg water) in 1.8 L water. A temperature of 50°C was then maintained during two hours in order to ensure complete dissolution of the solute. Batch experiments were carried out in pure water and with varying dissolved Nickel
125
Sulphate concentrations (0.5%, 1% and 5.4% in weight). The crystals were withdrawn at the end of the process, filtered, washed with acetone and dried during 24 hours at about 35°C.
2.2 Instrumentation
The ATR FTIR technology (Attenuated Total Reflectance Fourier Transform InfraRed
130
Spectroscopy) was used as an in situ sensor enabling supersaturation monitoring during solution crystallization since about 1995 (Dunuwila and Berglund, 1997; Fevotte, 2002; Togkalidou, 2001). Since the early pioneering works many successful applications of ATR spectroscopy to crystallization control were reported in the open literature. With the present system, calibrating the sensor for solute concentration measurements proved to be a rather heavy task, especially because of
135
the non-isothermal operating conditions. Indeed, the sensitivity of the spectral variations to temperature variations, the presence of CO2 and water in the atmosphere, or possible displacements of the probe required to be cautiously taken into account. As reported elsewhere (Gherras and Fevotte, 2012), chemometrics (PLS: Partial Least Squares) together with preprocessing of the spectral data allowed obtaining a satisfactory calibration model , and reliable and accurate
140
measurements of the solute concentration C(t) were thus computed from the acquired ATR FTIR data. Measurements of the time variations of C(t) together with the acquisition of AE signals were then performed to investigate the development of batch cooling solution crystallization operations. It was thus possible to relate accurately the evolutions of acoustic waves to the development of the crystallization process. Typical measurements of the solute concentration C(t) are presented in Fig. 2.
145
These measurements allowed computing the time variations of supersaturation which is defined through the following relative expression:
β(t)=(C(t)-C*(t))/C*(t) (1)
where C*(T(t)) is the solubility at temperature T(t)
The “EZProbe”, an in situ imaging probe developed in the University of Lyon (France) was
150
8
and estimating the Crystal Size Distribution thanks to “home-developped” image processing softwares, on the other hand. The 2D size measurements approach which was developed for monitoring specifically the AO crystallization was reported by (Ahmad et al.; 2011)
155
2.3. Acoustic emission
The AE measuring equipment consists of a piezoelectric sensor fixed on the wall of the crystallizer. Coupling grease was used to improve the transmission of acoustic waves from the crystallizer to the sensor. AE signals produced by physical events such as nucleation or crystal growth are transmitted from the physical source of emission, via the solution, the crystallizer wall
160
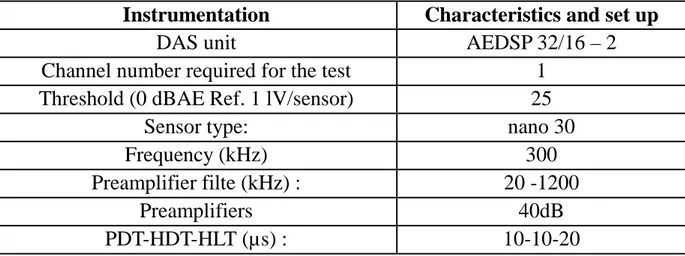
and the heating/cooling external fluid, to the sensor where they are converted into an electronic signal. The acoustic signal is then conditioned, amplified, filtered and processed by a specific Data Acquisition System (DAS from EuroPhysical Acoustics S.A) connected to the probe. Table 1 summarizes the mains features of the EA equipments.
165
Table 1: Characteristic and set-up parameters for the AE acquisition.
Instrumentation
Characteristics and set up
DAS unit
AEDSP 32/16 – 2
Channel number required for the test
1
Threshold (0 dBAE Ref. 1 lV/sensor)
25
Sensor type:
nano 30
Frequency (kHz)
300
Preamplifier filte (kHz) :
20 -1200
Preamplifiers
40dB
PDT-HDT-HLT (µs) :
10-10-20
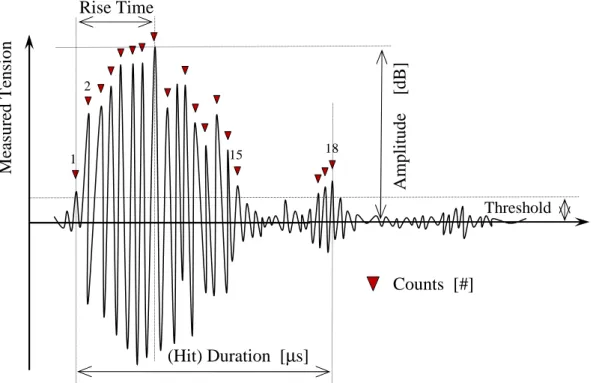
The acoustic emission can be considered as a sequence of “hits”. The main features of hits are
170
(about 600 atto-Joules) and a threshold power ratio value (30 dB) were first determined from “blank” measurements performed to get rid of insignificant signals emitted by the electromagnetic environment, the stirring and the flow of coolant in the jacket of the crystallizer.
A significant amount of AE parameters, such as the integrated absolute energy or the number
175
of counts (the amplitude of 18 peaks exceed the threshold value in the typical hit displayed in Fig.3) were recorded. The integrated Absolute Energy (IAE) is a measure of the true energy and is derived from the integral of the squared voltage signal divided by the reference resistance (10 k1) over the duration of the AE signal. IAE provides a global view of the phenomena occurring during crystallization, it differs from the absolute energy of hits which characterizes a physical event
180
generating a given acoustic emission.
A basic parameter used to characterize the level of acoustic signals in the time domain is the root mean square value (RMS) defined as follows:
1
− = 2 1 t t 2 1 2 rms p(t) dt t t 1 p (2) 185where p(t) is pressure magnitude of a continuous acoustic wave taken between times t1 and t2.
From a practical point of view, as displayed in Fig.3 , p(t) is evaluated as an electrical voltage u(t) emitted by the acoustic transducer and amplified by the sensing device, such that: u(t)∝ p(t). Eq.(2) can therefore equally be applied in terms of a voltage-RMS.
190
The amplitude is defined as the maximal voltage of the AE signal divided by the reference voltage of the sensor equal to 1 µV. So we have:
) u / u log( 20 AdB = max ref (3)
The average frequency f 1 is defined as the average ratio between the number of counts 1 and the duration of the burst:
10
d / n
f = 22 2 2 2 2 2 2 2 2 (4)
The peak frequency, fˆ expressed in kilohertz, is defined as the point in the power spectrum at which the peak magnitude is observed, and the frequency centroid ~f , also in kilohertz, is the barycentre computed from the sum of the frequencies balanced by the magnitude of the wave, it is thus equivalent to a first moment of inertia:
200 =
2
2
j j i i iE / E f f ~ (5)The absolute energy, in atto-Joule (1 aJ=10-18 J) is defined from the integration of the output voltage u(t) of the transducer, α being inversely proportional to the electrical resistance of the measuring circuit :
2 =
1
u(t)2dt absE
α 2 2 222 2 22 2 2 2 (6)205
The cumulative absolute energy, referred below to as
1
E
abs is obtained through the integration ofE
abs over the time period τ=0 to t :1
1
= t0 abs abs(t)
E
( )d210
215
220
Figure 3. Main characteristic parameters of a typical AE hit.
3. Results and discussion
225
The relationship between the AE variables and the development of crystallization mechanisms can be more thoroughly investigated thanks to the scrutiny of the many parameters describing the acoustic waves (e.g., number or amplitude of hits, frequency, duration, etc.) These parameters can be analyzed as a function of the development of the basic mechanisms occurring during the cooling process. Meanwhile, the latter can be simulated using both the PBE (Population
230
Balance Equation) model and the solute concentration measurements (i.e. primary and secondary nucleation, crystal growth, etc.) The PBE modeling approach was reported in a previous paper (Gherras & Fevotte, 2012.) In particular, using the available solute concentration measurements C(t), it is easy to compute the time variations of the crystallized solid CS(t) which is a good quantitative
1 2 15 18 M ea su re d T en si o n Rise Time (Hit) Duration [µs] A m p li tu d e [ d B ] Counts [#] Threshold
12
indication of the crystallization advancement, and therefore to make use of a worthwhile means of
235
confronting the development of AE signals with the development of the solid generation process:
CS(t)=Co- C(t) (8)
3.1 Crystallization of pure ammonium oxalate, preliminary experimental observations.
Preliminary experiments were carried out to specify the features and origins of the different
240
acoustic signals emitted during the cooling crystallization of AO aqueous solutions. The ability of AE to detect the generation of the solid phase during crystallization was also evaluated. Figure 4 shows the simultaneous time-evolutions of the acoustic absolute energy and of the relative supersaturation computed from in situ ATR FTIR data. These experimental data were collected during the cooling crystallization of oxalate ammonium monohydrate in pure water. The cooling rate
245
R= dT/dt=-30°C.h-1, was kept constant during the batch, until a temperature of 20°C was reached. The development of the batch run can roughly be divided into five parts denoted by letters A to E in Figs 4 and 5. Surprisingly, during Phase A, discrete-time early acoustic emission events were recorded. Phase A precedes significantly the onset of the primary nucleation burst. To the best of our knowledge, no sensor has already been reported to provide such an early detection of crystallization
250
precursor events, which suggests that AE might be related to very basic nucleation phenomena. The so-called “primary nucleation peak” takes place during Phase B. The insert in Fig. 4 shows that much before reaching the so-called limit of metastable zone, the nucleation rate is not nil, which is quite consistent with the classical nucleation theory and, notably, is predicted by the PBE model mentioned above. Phase C follows the concentration decrease which is usually associated with the
255
general concept of “primary nucleation burst” (i.e., attainment of some maximal supersaturation value corresponding to the maximal rate of nucleation, immediately followed by significant solute consumption resulting from the growth of newly crystallized particles). During Phase C, the acoustic
emission appears as a continuous signal releasing exponentially increasing energy levels. At the end of phase C, a relatively sharp peak of absolute energy is reached. During the final Phase D, the
260
acoustic energy decreases continuously and reaches a plateau. At first glance, the latter decrease (between times 5500 and 6000 s) cannot clearly be related to any particular supersaturation variation and, consequently, cannot easily be attributed to any basic crystallization phenomenon. During the final batch period, a rather constant level of acoustic absolute energy is observed together with low constant final supersaturation value.
265
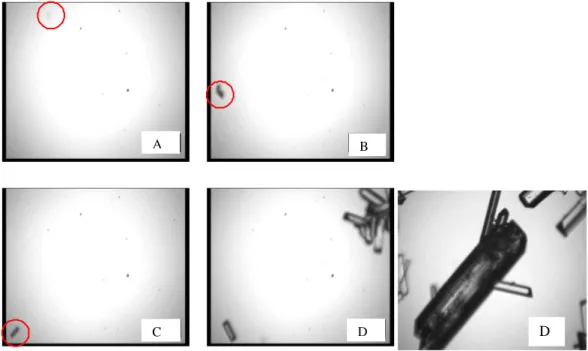
In order to get an additional point of view on the crystallization process, the suspension was monitored using in situ video imaging; typical pictures are displayed in Fig. 5. The images taken during Phase A (Figures 5a and 5b) show that though they are rare, ammonium oxalate crystals are already present in suspension. Pictures 3c and 3d correspond to the onset of the primary nucleation burst (time ≈ 3360 s). The pictures highlight the onset of significant intensification of both nucleation
270
and growth processes. Figure 3e shows that during the final period D, bigger crystals are present in suspension.
To conclude the preliminary qualitative analysis of the batch experiments, it appears that the energy of AE is undeniably related to the development of crystallization (i.e. crystal nucleation and/or growth), even though it seems difficult to identify any clear relationship between the
275
contributions of basic phenomena governing the batch process and the recorded acoustic signal. In particular, it was outlined above that despite similar supersaturation levels, the time variations of energy released through AE exhibit major differences during phases C and D. One could reasonably assume that, for similar supersaturation values, differences in the way of converting the dissolved solute into solid phase might result in the observed variations of AE energy. For example, it is likely
280
that during phase D primary nucleation is replaced by secondary nucleation as the prevailing nucleation mechanism while, due to the almost constant supersaturation level, the growth rate is expected to be rather constant. Moreover, during the same final batch period, it is likely that
inter-14
particle shocks play a key-role in the emission of acoustic signals, due to the significant amount of solid in suspension.
285
Figure 4. Relative supersaturation ratio β measured using ATR FTIR spectroscopy and absolute acoustic energy measured during the cooling crystallization of ammonium oxalate. The cooling rate was dT/dt=-30°C.h-1
290
1234 1254
1264 1274
Figure 5. In situ video pictures acquired during the different phases of the batch crystallization operation presented in Fig. 4.
D D
C
B A
295
3.2 Is crystallization the source of acoustic emission?
The previous experimental results raise an obvious important preliminary question: it could be argued that many potential sources might cause the experimental phenomenon of acoustic emission and, consequently, that no specific and valuable crystallization information could be
300
inferred from the AE data. To answer this essential question, it should firstly be underlined that, as explained above, AE not only precedes the starting of crystallization, but announces it earlier that no other means of detection. This observation has been made for the many batch experiments performed during the study. It is therefore reasonable to relate the onset of AE signals to the process of solid generation, including the very first moments of the primary nucleation process.
305
Now, in order to determine if the development of crystallization generates an acoustic signal apart from any other phenomenon (i.e. stirring, inter-particle shocks or shocks of particles against impellers or reactor wall); the cooling crystallization procedure was performed as previously, except stirring was turned off. Figure 6 shows the recorded acoustic emission expressed as the absolute energy of discrete-time waves. AE takes place simultaneously with the development of
310
crystallization even though, without stirring, the “acoustic activity” is much less intense than with stirring: as displayed in Fig.6, the average level of AE absolute energy is only of the order of 1 or 2 aJ while it was about 100 aJ in Fig.4. In the absence of stirring the level of AE was obviously expected to be significantly weaker: both the mass and heat transfers involved by the growth of solid are drastically limited by diffusion. In other words, without stirring the acoustic emission is expected
315
to be significantly reduced firstly because shocks between particles are suppressed and secondly because the solid generation process is significantly slowed down due to the poor mass transfer capacity. This observation is also consistent with the delayed onset of primary nucleation: under stirring, the first occurrence of AE is recorded after 2888s while without stirring the first AE event is recorded after 5000s.
16
It should also be outlined that the very basic experiment performed without stirring does not mean that the generation of crystal structure is the only source of AE (under stirring, one may argue that a major part of the emission is due to stirring effects, particles/impeller shocks, in particular), but it clearly demonstrates that some fundamental crystallization processes give rise to a noticeable acoustic activity. Provided that some emission specific to the crystallization process itself could be
325
extracted from the overall signals, this preliminary observation suggests that AE signals could be related to the advancement of basic crystallization phenomena.
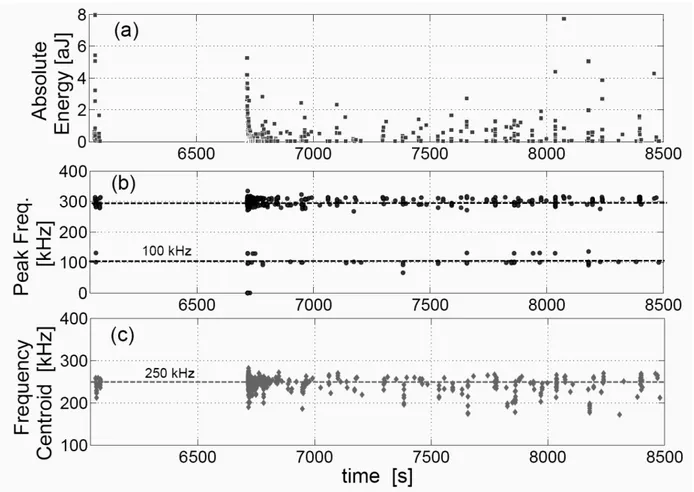
Figure 6. Absolute energy versus time during ammonium oxalate crystallization performed at a
330
cooling rate of -30°C.h-1 without stirring.
Figure 6 shows that the acoustic emission of unstirred cooling crystallization process is characterized by two main sustained frequencies located around 100 kHz and 300 kHz. Actually, it is shown below that all the batch operations performed under stirring are also characterized by the same
two continuous frequencies, plus another frequency band located around 125 kHz. As shown below, stirred and unstirred experiments have in common the fact that identical peak frequency values dominate the AE. However, no straightforward conclusion can be drawn from the observation of the frequency peaks in question as they partly result from the transfer function of the sensor (i.e. the measurements result from the convolution of the “true” crystallization emission with the propagation
340
of the wave through the suspension and the reactor wall, and with the dynamic/frequency features of the sensor.)
3.3. Evolution of AE characteristic variables during crystallization.
345
The AE parameters presented above were recorded during batch solution experiments performed with varying constant set-point cooling rates. Two kinds of AE experimental variables convey information about the development of crystallization processes: frequency and acoustic energy variables.
350
It seems reasonable to argue that the AE variables related to the energy of hits might conceal quantitative information about the time-development of the crystallization; in particular the solid-generation process itself and, through inter-particle shocks, features of the dispersed solid.
As outlined above (see e.g. Fig. 4), the measured time variations of most AE features confirm that the first manifestations of acoustic emission occur significantly earlier than the time at which the
355
limit of metastable zone is reached (i.e. the moment when the burst of nucleation, usually referred to as the limit of metastable zone, takes place.) To underline this point, Fig. 8 displays the time evolution of 4 important acoustic variables measured during the operation presented in Fig. 4. A comparison between the variation of supersaturation, time recorded amplitude, peak frequency, frequency centroid and number of counts, confirms that the onset of acoustic signals takes place
360
18
In addition to AE measurements and ATR FTIR supersaturation estimates, simulated information was also available during this study. The simulation results and the concentration measurements can be useful to understand the development of AE: the time evolutions of AE can be analyzed in the light of crystallization parameters that cannot be measured (e.g. nucleation rates) but are predicted by
365
the simulation model. The detailed dynamic simulation model in question was reported by Gherras and Fevotte (2012), it is based on the mathematical formalism of Population Balance Equations (PBEs) and allows, notably, to simulate the time evolution of the Crystal Size Distribution.
370
3.3.1. Experimental evolutions of AE frequency variables 3.3.1.1 Crystallization in pure water
A magnification of the scatter plot of the time-varying values of peak frequencies is presented in Fig. 7. As already observed (see Fig. 6), the discrete-time values of the computed peak-frequencies
375
are related to the natural frequency response of the sensor. However, the computation of time moving averages of the recorded discrete-time frequencies provides a continuous measurement of the AE hit frequency which might be related to the development of the crystallization process. Two typical trajectories of the average peak frequency together with time variations of the frequency centroid are thus displayed in Fig. 9, in the case of pure solvent.
380
Figure 7 shows that the same 3 constant peak frequencies fˆ are observed during batch i
cooling operations performed with different cooling rates. The moment of onset of the three peak frequency clusters differs slightly with the rate of cooling while the order of onset of the different frequencies and the relative number of occurrence of the same frequencies follow the same order, whatever the experiment considered. In other words, the bands which are referred to as π1 to π3 in
Fig.8 appear successively during the batch time and the numbers of hits corresponding to a given frequency πi are increasing with index i.
Figure 7. Time evolutions of the peak frequency for 3 different batch experiments performed at varying cooling rates in pure water (the different marks correspond to dT/dt=-20, -25 and -30°C/h).
390
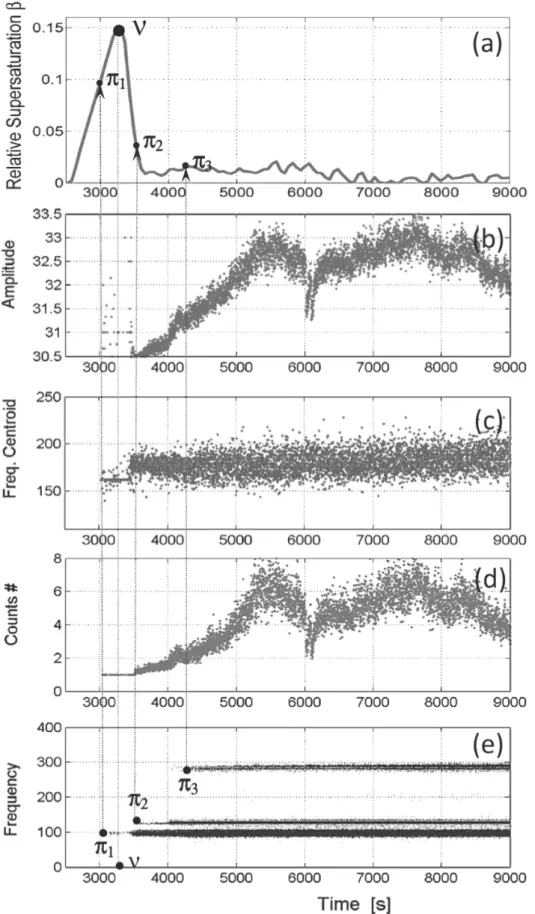
Another view on the frequency features of the AE data obtained after the batch run presented in Fig. 4 is shown in Fig.8. Figure 8a displays the supersaturation profile measured using ATR FTIR during the same experiment. The AE emission starts at time π1=3040 s while the limit of metastable
395
zone is reached at time ν=3360 s. Fig.8d shows that the AE bursts are characterized by single peaks (one count exceeding the threshold) between time π1 and π2=3510 s. Time π2 is characterized by the onset of bursts exhibiting several counts. It can be noticed that around t=5500s, the maximum number of counts reaches 170 (the discrete-time variations of the number of counts is not shown here), even though the average number of peaks never exceeds 8 counts/hit (see Fig. 8d). Every time
400
π1 to π3 thus corresponds to the appearance of a new frequency band lasting until the end of the batch experiments: times π1 to π3 are related to the appearance of frequencies fˆ =100, 125 and 285 kHz, i respectively. Moreover, times π1 and π2 are related to increasing number of counts while π3 does not
20
clearly correspond to any discontinuity, neither in the number of counts, nor in the supersaturation profile displayed in Fig.8a. Fig.8c also shows that in the average, the frequency centroid increases
405
with the batch time. This feature is fully consistent with the development of the three main frequency bands outlined in Fig.7.
As already explained, in addition to supersaturation measurements, model-estimates of the main basic crystallization phenomena were computed using a PBE approach. The PBE model was based on kinetic estimates of nucleation and growth kinetics of ammonium oxalate published elsewhere
410
(Gherras and Fevotte, 2012). Comparing the model-predicted time variations of nucleation and growth phenomena might help in understanding, for example, the shape of the acoustic absolute energy displayed in Fig.4. From this point of view, it is interesting to note that the variations Eabs(t) exhibit a rather sharp and unexpected peak at t≈5500s. Indeed, putting in contrast the time variations of Eabs with either the simulated nucleation rate or the rate of solid generation (not shown in the
415
present paper), does not allow explaining the onset of the peak in question. Further work should therefore be undertaken to relate the observed AE variables to the development of basic crystallization phenomena.
420
Figure 8. Time variations of AE variables during a batch cooling crystallization in pure solvent: (e) Peak frequency and (c) Frequency centroid (kHz), (b) Amplitude and (d) Number of counts as compared with the time-variations of (a) Supersaturation.
22 425
3.3.1.2. Crystallization in the presence of dissolved impurities
In order to investigate more deeply the physical meaning of the AE peak frequencies, identical batch cooling experiments were performed in the presence of Nickel Sulfate as dissolved impurity. Nickel Sulfate was in fact selected owing to its well-known and well-documented ability to inhibit the crystallization of Ammonium Oxalate (Sangwal and Palczynska, 2000; Sangwal and
430
Mielniczekbrzoska, 2004; Sangwal, 2007). The time variations of both the frequency centroid f~ and peak frequency fˆ were measured and compared for two experiments performed in pure solvent and two other experiments performed in impure solvent (i.e. with 0.5% dissolved NiSO4). The results of the computation of moving averages of fˆ
and
~f are displayed in Fig.9. The same cooling rates were applied (i.e. dT/dt=-20 and -30°C/h) during the presented unseeded crystallizations operations,435
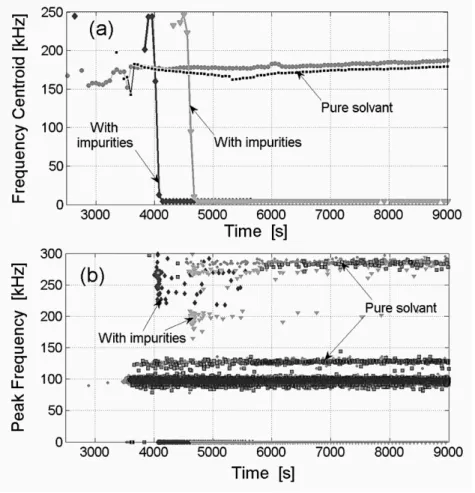
Figure 9a shows that while the average frequency centroid ~f remains almost constant when the crystallization is performed in pure solvent (i.e. ~f ≈180 kHz), ~f falls close to zero from the very beginning of the crystallization performed in the presence of impurities. Obviously, from a physical point of view, measuring ~f =0 has no clear meaning. Such a value actually arises from the fact that, with impure solvent, so many bursts exhibit a very limited number of counts that the EA signal
440
appears to be almost continuous. The acquisition/processing system is thus overburdened and relates nil frequencies to uncharacterized hits.
In impure solvent, the AE measurements presented in Fig. 9b also reveal that, when compared to the experimental results obtained in pure medium, the peak frequency bands are significantly altered with respect to the measurements obtained in pure water. In the presence of impurities, most acoustic
445
events are related to very low values of the frequency centroid
,
and the main observed frequency bands are very fuzzy and distorted. Again, considering the detrimental effect of the impurity on thecrystal sizes and shapes, these results suggest that the frequency measurements might be indicative of the quality and/or of the CSD of the final product. Should they be more clearly interpreted, such results could obviously be highly valuable for industrial quality monitoring purposes. For example,
450
one could envisage the delivery of early diagnosis of the granulomeric quality of the product, of its chemical purity and perhaps of some crystal shape features, during the batch process.
455
Figure 9. Time variations of the moving averaged frequency centroid and of the peak frequency for experiments performed with two different cooling rates, with and without the presence of dissolved impurity. Legend: (1 & 1) for dT/dt=-30°C/h; (2 &1) for dT/dt=-20°C/h.
24
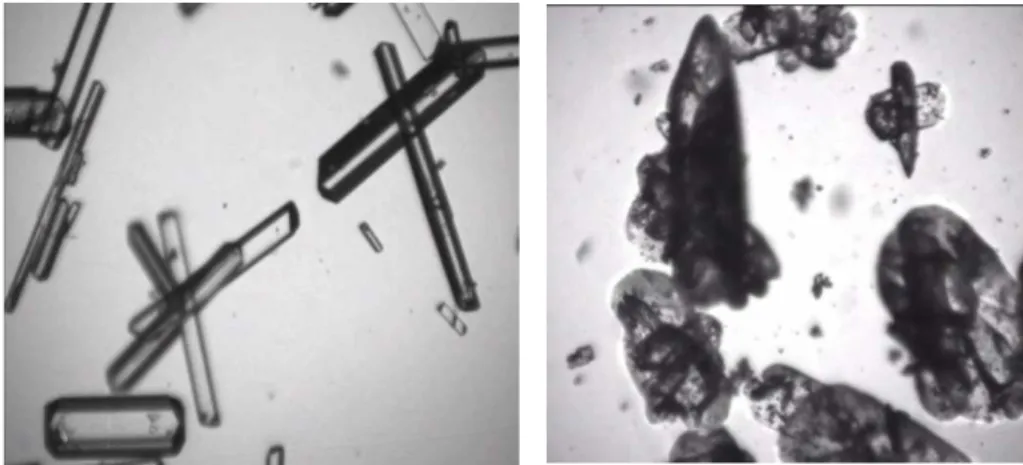
Figure 10. Typical video pictures of ammonium oxalate crystals in suspension. (a) Pure water; (b) Water containing dissolved Nickel Sulfate as impurity.
465
In order to support the preceding assumptions, Fig. 10 presents two typical pictures taken during crystallization operations performed in pure solvent and in the presence of impurities. The pictures were obtained thanks to the use of the immersed video probe presented in Fig.1; they undeniably show that, as a whole, the quality of particles grown in the presence of NiSO4 is impaired: the crystal surface is rough and covered with small broken pieces of crystals. It can also be
470
observed that the regular shape of monocrystals grown in pure water is lost. The significant changes in the frequency features of AE could therefore be related to the degradation of the quality of crystals. Again, it can be expected that AE measurements could be used as a means of monitoring the properties of particles.
475
3.3.2. Evolution of AE energy variables
In addition to frequency variables, the acoustic emission can be quantitatively evaluated through the many characteristic parameters which are directly or indirectly related to the energy of the acoustic signal. Among these variables, four important parameters are displayed in Fig.11, for 4
480
First of all, it is worth noting that the range of variation of most measured AE variables changes significantly from one experiment to the other. Such variability can reasonably be attributed to the very irreproducible way of sticking the piezo-sensor on the crystallizer wall (See Figure 1b.) In particular, it makes no doubt that the sticking pressure and the thickness of the layer of contact
485
grease is not batch-to-batch reproducible. To enable a comparative viewing of the acoustic measurements, the experimental data displayed in Fig.11 were thus normalized with respect to their maximal measured value:
|Eabs(t)|= Eabs.(t)/ max(Eabs,)) (9)
490 0 1000 2000 3000 4000 5000 6000 0 0.2 0.4 0.6 0.8 1 Time [s] C u m u la ti v e A b s o lu te E n e rg y [-] 0 1000 2000 3000 4000 5000 6000 0 0.2 0.4 0.6 0.8 1 Time [s] A v e ra g e N u m b e r o f C o u n ts 0 1000 2000 3000 4000 5000 0.2 0.4 0.6 0.8 1 Time [s] A v e ra g e R M S [-] 0 1000 2000 3000 4000 5000 6000 0 0.2 0.4 0.6 0.8 1 Time [s] A v e ra g e A b s o lu te E n e rg y [-] dT/dt=-10°C/h, impure dT/dt=-20°C/h, pure dT/dt=-30°C/h, pure dT/dt=-20°C/h, impure (a) (b) (c) (d)
Figure 11. Time variations of important characteristic AE parameters acquired during batch cooling crystallization experiments performed with varying cooling rates, with and without the presence of dissolved impurity. The experimental data were normalized with respect to their maximal value.
495
Generally speaking, erratic variations of most instantaneous AE variables can be observed. A typical example of such variations lies in the time variations of absolute energy and number of
26
counts displayed in Figs11b and 11d. However, both the variations of the cumulative absolute energy and of the RMS exhibit rather regular evolutions and shapes which appear to depend on the presence
500
or absence of impurities during the crystallization. These features are quite interesting because, as previously observed, they allow discriminating between batch operations performed with and without impurities. Indeed, as displayed in Fig.11a, the integral of the normalized absolute energy released through AE increases more rapidly when impurities are present in solution than when the crystallization takes place in pure solvent. In the same way, Fig11c shows that the time evolutions of
505
the RMS are much steeper in the presence of impurities.
Now, considering that the release of acoustic energy results mainly from the process of solid generation leads to think that the effect of impurities on the time variations of the cumulative absolute energy should better be analyzed through the plot of
1
E
abs against CS(t) (the amount ofsolid in suspension), rather than against time. Fig. 12b presents such plots obtained after two
510
different cooling rates were applied to the batch crystallizer with and without dissolved impurities. Fig.12a displays the corresponding time variations of the solid concentration computed from ATR FTIR measurements. As expected, the rate of solid production changes significantly when either the impurity content or the cooling rate are changed. For example, it is not surprising that without impurities (i.e. in the absence of inhibiting effects), the highest cooling rate results in the highest rate
515
of solid generation (see curve 2). Now, Fig.12b shows very clearly that the shapes of the trajectories
1
E
abs(CS(t)) are similar for similar concentration of dissolved impurities, whatever the cooling rate (see curves 3’ and 4’). From a physical point of view, it is therefore reasonable to think that measuring the time variations of the acoustic parameter1
E
abs(CS(t)) might allow some evaluation of the solid generation process in with and without inhibiting effects of impurities present520
in solution. For example, it is well known that impurities present in industrial mother liquor entail apparent final supersaturation thresholds and, consequently, lead to the reduction of the yield of solid
(Kubota et al., 2003; Kubota, 1997). In such a context, AE might provide data for estimating the inhibiting effects of impurities on the overall crystal growth and, therefore, allow designing appropriate feedback control policy for reducing losses of final solid.
525
Figure 12. (a) Time variations of the solid concentration measured using ATR FTIR spectroscopy during batch operations performed with varying cooling rate and impurity content. (time t=0 does not correspond to the beginning of the crystallization process, but to the onset of primary
530
nucleation). (b) Corresponding time variations of the cumulative absolute energy
1
E
abs(t)as a function of the solid concentration.4. Conclusions
The present study shows that several interesting applications regarding the industrial
535
monitoring and control of solution crystallization processes are made possible by the development of acoustic emission as in-line sensing technique. Indeed, the experimental results presented here
28
suggest that AE might be valuable for the control of industrial crystallization as, in addition to its invaluable non-intrusive features, it provides information on both the liquid and the dispersed solid phase evolving in suspension. Among other features, the following attractive potential applications
540
have been suggested in this paper:
- The generation of acoustic signals occurs significantly earlier than the onset of the primary nucleation peak (i.e. before reaching the so-called limit of metastable zone.) Considering that, according to the classical nucleation theory, the latter should not be confused with the first nucleation outbreaks, this fact clearly demonstrates that, more than other usual sensors, AE is undeniably
545
sensitive to basic phenomena arising from the nucleation of the dispersed solid phase.
- The experimental results obtained in both pure and impure media suggest that the parameters of the AE measurements provide information on the chemical purity of the crystallizing medium. It might therefore turn out to be possible to obtain early real time information on the crystal purity during the process. As industrial pharmaceutical batch crystallization processes are always performed in the
550
presence of unavoidable impurities, this latter feature of AE would be particularly valuable for the development of innovative monitoring policies of APIs crystallization.
- The cumulative absolute energy and the RMS variables were shown to exhibit specific time trajectories related to the crystallization advancement and depending on the presence of dissolved impurities. This experimental observation also opens up the perspective of designing new in-line
555
sensing approaches allowing to assess the impact of impurities of the kinetic advancement of the crystallization process and on the final quality of crystallized APIs.
Références
Ahmad, O.S. ; Debayle, J.; Gherras, N.; Presles, B.; Fevotte, G.; Pinoli, J.C. 2011. Recognizing overlapped particles during a crystallization process from in situ video images for measuring their size distributions. Dans J. Pinoli et al., éd. 10th International Conference on Quality
565
Control by Artificial Vision. Bellingham: Spie-Int Soc Optical Engineering.
Birch, M.; Fussel, S.J.; Higginson, P.P.; McDowall, N.; Marziano, I., 2005. Towards a PAT-Based Strategy for Crystallization Development. Organic Process Research & Development, 9, 3, p.360-364.
Dunuwila, D.D. and Berglund, K.A., 1997. ATR FTIR spectroscopy for in situ measurement of
570
supersaturation. Journal of Crystal Growth, 179(1-2), p.185-193.
Ersen, A.; Smith, A. and Chotard, T., 2006. Effect of malic and citric acid on the crystallisation of gypsum investigated by coupled acoustic emission and electrical conductivity techniques. Journal of Materials Science, 41(21), p.7210-7217.
Fevotte, G, 2002. New perspectives for the on-line monitoring of pharmaceutical crystallization
575
processes using in situ infrared spectroscopy. International Journal of Pharmaceutics, 241(2), p.263-278.
Gherras, N. and Fevotte, G., 2012, On the use of process analytical technologies and population balance equations for the estimation of crystallization kinetics. A case study. AIChE Journal. Available at: http://onlinelibrary.wiley.com/doi/10.1002/aic.12776/.
580
Grosse, C.U. & Ohtsu, M., 2008. Acoustic emission testing, 406p. Springer, Heidelberg, Deutchland. Kail, N., Briesen, H. and Marquardt, W., 2008. Analysis of FBRM measurements by means of a 3D
optical model. Powder Technology, 185(3), p.211-222.
Kubota, N, 1997. Supersaturation dependence of crystal growth in solutions in the presence of impurity. Journal of Crystal Growth, 182(1-2), p.86-94.
585
Kubota, Noriaki et al., 2003. A Mathematical Model for Crystal Growth Rate Hysteresis Induced by Impurity. Crystal Growth & Design, 3(3), p.397-402.
Leskinen, J.T.T. ; Okkonen Matti-Antero H.; Toviainen Maunu, M et al., 2010. Labscale fluidized bed granulator instrumented with non-invasive process monitoring devices. Chemical Engineering Journal, 164(2-3), p.268-274.
30
Lube, E.L. and Zlatkin, A.T., 1989. In-process monitoring of crystal perfection during melt growth. Journal of crystal growth, 98(4), p.817-826.
Sangwal, K and Mielniczekbrzoska, E., 2004. Effect of impurities on metastable zone width for the growth of ammonium oxalate monohydrate crystals from aqueous solutions. Journal of Crystal Growth, 267(3-4), p.662-675.
595
Sangwal, K. 2007. Additives and crystallization processes: from fundamentals to applications, John Wiley and Sons.
Sangwal, K. and Palczynska, T., 2000. On the supersaturation and impurity concentration dependence of segregation coefficient in crystals grown from solutions. Journal of Crystal Growth, 212(3-4), p.522-531.
600
Sawada, T.; Gohsi, Y.; Abe, C.; Furuya, K., 1985. Acoustic emission from phase transition of some chemicals. Anal. Chem., 57(8), p.1743-1745.
Serris, E.; Perrier-Camby, L.; Thomas, G.; Desfontaines, M.; Fantozzi, G., 2002. Acoustic emission of pharmaceutical powders during compaction. Powder Technology, 128(2-3), p.296-299. Sistare, F.; Berry, L. and Mojica, C., 2005. Process analytical technology: An investment in process
605
knowledge. Organic Process Research & Development, 9(3), p.332-336.
Togkalidou, 2001. Solute concentration prediction using chemometrics and ATR-FTIR spectroscopy. Journal of Crystal Growth, 231(4), p.534-543.
Vervloet, D., Nijenhuis, J. and van Ommen, J.R., 2010. Monitoring a lab-scale fluidized bed dryer: A comparison between pressure transducers, passive acoustic emissions and vibration
610
measurements. Powder Technology, 197(1-2), p.36-48.
Boyd, J. and Varley, J., 2001. The uses of passive measurement of acoustic emissions from chemical engineering processes. Chemical Engineering Science, 56(5), p.1749-1767.
Wade, A.P., 1990. Acoustic emission: Is industry listening? Chemometrics and Intelligent Laboratory Systems, 8(3), p.305-310.
615
Wadley, H. and Mehrabian, R., 1984. Acoustic emission for materials processing: a review. Materials Science and Engineering, 65, p.245-263.
Waring, M.J.; Rubinstein, M.H. ; Howard, J.R., 1987. Acoustic emission of pharmaceutical materials: the effect of compression speed, ejection, lubrication and tablet weight. International Journal of Pharmaceutics, 40, p.15-22.
620
Yu, L.X.; Lionberger, R.A. ; Raw, A.S.; D’Costa, R.; Wu, H.Q.; Hussain, A.S., 2004. Applications of process analytical technology to crystallization processes. Advanced Drug Delivery Reviews, 56(3), p.349-369.
Yu, Z.Q.; Chew, J.W.; Tan, R.B.H., 2007. Recent Advances in Crystallization control: An Industrial Perspective. Chemical Engineering Research and Design, 85(7), p.893-905.
625
Acknowledgement :
We greatly acknowledge the French research agency ANR for the support granted to the project “IPAPI” (Improving the Properties of Active Pharmaceutical Ingredients), ref.07-BLAN-0183.