OATAO is an open access repository that collects the work of Toulouse
researchers and makes it freely available over the web where possible
Any correspondence concerning this service should be sent
to the repository administrator:
tech-oatao@listes-diff.inp-toulouse.fr
This is an author’s version published in: http://oatao.univ-toulouse.fr/20477
To cite this version: Morin, Mathieu
and Pecate, Sébastien
and Masi, Enrica
and Hemati, Mehrdji
Kinetic study and
modelling of char combustion in TGA in isothermal conditions.
(2017) Fuel, 203. 522-536. ISSN 0016-2361
Full Length Article
Kinetic study and modelling of char combustion in TGA in isothermal
conditions
Mathieu Morin
a,⇑, Sébastien Pécate
a, Enrica Masi
b, Mehrdji Hémati
aaLaboratoire de Génie Chimique, Université de Toulouse, CNRS, INPT, UPS, 4 allée Emile Monso, 31432 Toulouse, France
bUniversité de Toulouse, INPT, UPS, IMFT (Institut de Mécanique des Fluides de Toulouse), 2 allée du professeur Camille Soula, 31400 Toulouse, France
h i g h l i g h t s
!Experimental study of biomass char combustion in TGA in isothermal conditions. !Operating conditions: T < 400 !C, 5065 Pa < PO2< 21,273 Pa, dp= 25lm.
!Response of the TGA to a concentration step included in the kinetic modelling. !The GM and the RPM are the more appropriate models to represent kinetic data. !Activation energy of 124 kJ/mol and reaction order with respect to oxygen of 0.74.
Keywords: Combustion Char Kinetic TGA Mass transfer
a b s t r a c t
The purpose of this work is the kinetic study of biomass char combustion in isothermal conditions in TGA. This char was obtained from fast pyrolysis of beech bark pellet in a fluidized bed reactor at 850 !C and atmospheric pressure. Kinetic study of isothermal char combustion was performed for temperatures up to 400 !C, oxygen partial pressures ranging from 5065 to 21,273 Pa and a char particles size of 25lm. Mass transfer effects around and within the crucible were thoroughly characterized by
naph-thalene vaporization. Oxygen diffusion was found to have no effect on char combustion for temperatures below 400 !C. A novel method including the transfer function of the TGA which describes the variation of oxygen partial pressure just after switching the gas from inert to reactive in the TGA was taken into con-sideration in the kinetic modelling. Two kinetic models (the Grain Model and the Random Pore Model) were used to determine kinetic parameters. The Grain Model was found to be in very good agreement with experimental data. Values of activation energy and reaction order with respect to oxygen are respec-tively equal to 124 kJ/mol and 0.74. Besides, the maximum combustion rate commonly observed in the literature during char combustion was found to be the result of the non-uniform oxygen partial pressure in the TGA at the initial stage of the char combustion.
1. Introduction
With the growing environmental concern, biomass gasification is a promising alternative to fossil fuel for power generation. Recently, an increasing interest was showed for the production of methane via Methanation process and ‘‘Biomass to Fisher-Tropsch Liquids”. Biomass gasification is a thermochemical conversion occurring at high temperatures with many simultane-ous reactions. It occurs in two stages: (i) a fast pyrolysis step above
350 !C in which the biomass undergoes a thermal conversion lead-ing to the formation of volatile products either condensable (steam and tars) or non-condensable (H2, CO, CO2, CH4and C2Hx) and a
solid residue called char[1]; (ii) a gasification step in which the char reacts with steam and carbon dioxide at temperatures greater than 700 !C to produce syngas.
Biomass gasification is an endothermic process. To maintain a fixed temperature in the reactor, a contribution of energy is required. Two types of technology exist for biomass gasification according to the method of heat transmission[2–5]. On the one hand, the heat can be provided by ‘‘in situ” combustion. This pro-cess includes the fixed bed gasifiers (co- and counter-current) and the ‘‘bubbling fluidized bed” gasifiers. In these types of reactor, the biomass undergoes drying, pyrolysis and partial combustion of ⇑Corresponding author.
E-mail addresses:mathieu.morin18@gmail.com(M. Morin),sebastien.pecate@ ensiacet.fr (S. Pécate), emasi@imft.fr (E. Masi), mehrdji.hemati@ensiacet.fr
volatile matters and char and finally the gasification of char. On the other hand, the heat can be supplied by ‘‘ex-situ” combustion of char. One of the most promising technologies which uses ‘‘ex-situ” combustion is dual or twin fluidized bed (FICFB: Fast Internally Circulating Fluidized Bed)[6]. Its principle relies on the circulation of a medium (sand, olivine or catalyst particles) which acts as a heat carrier between an endothermic reactor and an exothermic reactor. In the former (called gasifier) which operates around 750 !C–850 !C, biomass gasification is carried out to pro-duce syngas. In the exothermic reactor (called combustor) which proceeds at 900 !C–950 !C, a part of the char from the gasifier is burned to produce heat.
During biomass gasification, especially with FICFB, char reacts with steam and carbon dioxide in the gasifier and oxygen in the combustor. Information regarding the kinetic of char combustion is then essential to better understand phenomena occurring inside the combustor and to design this process.
Char combustion corresponds to a complex chemical transfor-mation which occurs in several steps: the external transfer of oxy-gen from the bulk to the external surface of the particle, the diffusion of oxygen within the pores of the solid, the oxygen chemisorption on an active site (adsorption), the intrinsic chemical reaction and finally the products desorption[7,8]. These different steps are strongly affected by the physicochemical properties of char, the combustion temperature, the oxygen partial pressure and the size of the solid particles.
A previous study was carried out to highlight the effect of pyrol-ysis operating conditions on the physicochemical properties and reactivity of two biomass chars[9]. We showed that the physico-chemical structure of char is strongly dependent on the pyrolysis conditions (heating rate, pyrolysis temperature and the nature of the biomass). These parameters influence hydrogen, oxygen, car-bon and ash content in the char as well as the presence of aromatic and amorphous carbon. The presence of inorganic matters (i.e. ash) in the char matrix was found to catalyze the reaction of combus-tion[9]. In addition, bibliographic works showed that:
1) An increase in the particle heating rate during biomass pyrolysis increases the reactivity of char[10–14].
2) A higher pyrolysis pressure yields to a decrease of char reac-tivity[11,15].
3) The effect of the soaking time is not well understood yet. The soaking time represents the residence time of char at final pyrolysis temperature. This parameter was found to decrease char reactivity for certain authors [12,16] and to have no effect on char reactivity for other researchers
[14].
4) A raise of the final pyrolysis temperature leads to a decrease of char reactivity. The char reactivity greatly depends on the nature of the biomass. It is strongly influenced by the char chemical structure and ash content[9].
The reaction of combustion may be divided into three main regimes according to the temperature, the oxygen partial pressure and the particles size[8]. In Regime I, the intrinsic reactivity of the solid is low with respect to oxygen diffusion inside the pore and external transfer around the particle. The concentration of oxygen is considered as uniform inside the particle and equal to that in the bulk gas stream. The intrinsic chemical reaction is then the limiting step. The Regime II is the transition regime where both the diffu-sion of oxygen and the intrinsic chemical reaction play a significant role. These two phenomena must be taken into account to repre-sent the char reactivity. In Regime III, the intrinsic reactivity of the solid is very high and oxygen molecules react at the particle surface as soon as they have passed the boundary layer around the particle. Therefore, the concentration of oxygen at the external surface of the particle is zero and the reaction rate is controlled by external mass transfer. Hence, to determine char-O2 combustion
kinetic, many authors[17,18]minimized mass and heat transfers. This can be achieved by carefully choosing the combination of combustion temperature, oxygen partial pressure and particles size so that char combustion occurs in chemical kinetic controlled regime (Regime I).
Nomenclature
A pre-exponential factor
AGM pre-exponential factor for the Grain Model (mol.m"2.Pa"n.s"1)
ARPM pre-exponential factor for the Random Pore Model (m.Pa"n.s"1)
CsO2 oxygen concentration at the surface of char particles (mol.m"3)
C1
O2 oxygen concentration in the bulk (mol.m
"3)
DO2"CO2 diffusion coefficient of oxygen into carbon dioxide
(m2.s"1)
DO2"N2 diffusion coefficient of oxygen into nitrogen (m
2.s"1)
dg elementary grain diameter of char particle (m) dpore average pore diameter (m)
Ea activation energy (J.mol"1) f ðXÞ structure function (–) H height of the crucible (m)
Kc global mass transfer coefficient (m/s) L0 Initial pore length per unit volume (m.m"3) Mc molar weight of carbon (kg.mol"1)
n reaction order with respect to oxygen (–) n0 initial amount of char in the crucible (mol) PO2;s oxygen partial pressure at the particle surface (Pa)
R gas constant (J.mol"1.K"1)
Rapp apparent reaction rate at X = 0.5 (s"1) Rc unreacted core of the char particle (m)
rg elementary grain radius of char particle (m) Scrucible crucible surface (m2)
S0 internal surface area per unit volume (m2.m"3) Sp0 external surface area per unit volume (m2.m"3) Tp particle temperature (K)
Vcrucible crucible volume (m3) wðtÞ temporal sample weight (kg) wash final sample weight (kg) wi Initial sample weight (kg) X conversion rate (–)
xc mass fraction of carbon in the char particle (–) YiO2 normalized fraction of oxygen at the outlet of CSTR i
(i = 1, 2) (–) Greek letters
dc height of the char layer in the crucible (m) dC10H8 height of the naphthalene layer in the crucible (m)
e
porosity of the char layer in the crucible (–)e
p particle porosity (–)q
a apparent density of grinded char particles (kg.m"3)q
t;c true density of char particle (kg.m"3)s
tortuosity of the char layers
¼ ffiffiffi 2 p(–)
s
CSTR residence time of the CSTR (s)The influence of oxidative temperature, oxygen partial pressure and particles size on the kinetic of biomass char combustion was widely investigated in the literature. The oxidative temperature
[17,19–22]and the oxygen partial pressure[17,19,21,23–25]were found to have a strong impact on the rate of combustion which increases by raising these two parameters. Several authors
[17,18,26,27]studied the influence of particles size on the char reactivity in gasification and combustion. They concluded that char particles size affects the diffusion of the gaseous reactant which may lead to a non-uniform concentration in the particle. Hence, for a fixed temperature and reactant partial pressure, the particles size influences the regime of reaction (i.e. Regime I, II). For instance, in the case of CO2gasification at 950 !C and a CO2partial
pressure of 0.1 MPa, Kovacik et al.[18]reported that a particle size up to 105
l
m enables to achieve a chemically controlled reaction.This is in good agreement with the works of Standish et al.[26]
who concluded that the time for a complete carbon conversion with CO2increases with the initial particles size.
The presence of ash in the char also has an influence on its reactivity in combustion [9,17,28]. However, its effect is not well-established yet. According to Zolin et al.[28], the presence of inorganic materials in the char matrix may involve either a raise in the number of active sites in the char or a decrease in the acti-vation energy. For example, in the case of combustion of straw and leached straw chars, they found that straw char has a significantly higher reactivity than leached straw char for temperatures up to 1000 !C. As no difference in activation energies between the two chars was observed, the authors concluded that the difference in
reactivity is due to the catalytic effect of ash which involves an increase in the number of oxidation sites. In a previous work[9], we showed that the higher amount of ash in the beech bark pellet char might explain its higher oxidative reactivity compared to beech stick char. Nevertheless, other researchers[29]mentioned that the structure of char plays a more dominant role than the cat-alytic effect of ash for char combustion reactivity.
The literature on the kinetic of coal char combustion is exten-sive and has been discussed in several reviews[7,30]. The combus-tion kinetic of char from pyrolysis of biomass is less studied and some works are given inTable 1in the case of non-isothermal char combustion and inTable 2in the case of isothermal char combus-tion.Tables 1 and 2show that a wide range of biomasses (wood, straw, RDF, paper, bagasse and lignin) as well as pyrolysis condi-tions (temperature ranging from 500 to 1400 !C and heating rate between 3 and 18,000 !C/min) were applied to produce char. The char combustion experiments were performed mostly in TGA with heating rates between 0.5 and 20 !C/min, maximum temperatures in the range of 300–1000 !C, various oxygen partial pressures (283–21,273 Pa) and char particles size less than 500
l
m.Reactivity of char with oxygen can be described by the rate of a solid-state reaction according to the following expression[31,32]:
dX
dt ¼kðTpÞ ( hðPO2;sÞ ( f ðXÞ ð1Þ where X; PO2;sand Tpare respectively the conversion rate, the
oxy-gen partial pressure at the particle surface (Pa), and the particle
Table 1
Literature review on kinetic of biomass char combustion in non-isothermal conditions.
Ref. Pyrolysis conditions Combustion operating conditions Kinetic expression Reactor Temp. (!C) Heating rate
(!C/min)
Diam. (lm) O2(%) dXdt(s"1), A (s"1), Ea(J/mol)
[17] Flash carbonization reactor Corncob 1.4 MPa TGA 300–530 5–25 5–13 20, 100 dX dt " "dev¼ 7:08 ( 10 6 ( exp "111;000RT # $ P0:63O2 ð1 " XÞ dX dt " "BO1¼ 1:26 ( 10 8 ( exp "137;000RT # $ P0:7O2ð1 " XÞ 0:41 dX dt " "BO2¼ 1:17 ( 109( exp "151;000RT # $ P0:53 O2 ð0:83 þ XÞ 3:72 ð1 " XÞ0:82 "dm dt¼ 0:1 (dXdt " "de vþ 0:3 ( dX dt " "BO1þ 0:47 (dXdt " "BO2 [22] TGA, 527 !C, 5–15 !C/min Olive Husks (OH) Wheat straw (WS) Grape Residues (GR) Pine Wood (PW) TGA 400–600 10 60–150 21 OH:dX dt¼ 1:22 ( 10 5 ( exp "83;500RT # $ ð1 " XÞ1:1 WS:dX dt¼ 1:66 ( 10 4 ( exp "71;200RT # $ ð1 " XÞ1:5 GR:dX dt¼ 6:44 ( 10 4 ( exp "78;000RT # $ ð1 " XÞ2 PW:dX dt¼ 1:51 ( 10 6 ( exp "108;400RT # $ ð1 " XÞ1:2 [23] RDF, Fixed bed, 60 !C/min 500 !C 600 !C 700 !C 800 !C TGA 600 10 – 6–21 500 !C:dX dt¼ 1:08 ( 10 10 ( exp "162;000RT # $ P0:64O2 ð1 " XÞ 600 !C:dX dt¼ 4:58 ( 10 9 ( exp "162;000RT # $ P0:64O2 ð1 " XÞ 700 !C:dX dt¼ 2:84 ( 10 9 ( exp "162;000RT # $ P0:64O2 ð1 " XÞ 800 !C:dX dt¼ 1:89 ( 10 9 ( exp "162;000RT # $ P0:64 O2 ð1 " XÞ [24] Black paper, TGA
550 !C, 0.5–5 !C/min TGA 550 0.5–5 – 0.28–21 dX dt¼ 5:67 ( 10 9 ( exp "160;000RT # $ P0:78O2 ð1 " XÞ
[25] Bagasse, ASTM test TGA 600 15 90–125 1–21 dX
dt¼ A ( exp "180;000RT
# $
P0:65 O2 ð1 " XÞ [28] Wheat straw, TGA,
45 !C/min 700 !C 900 !C 1000 !C 1200 !C 1400 !C TGA 1000 1–20 <150 10 700 !C:dX dt¼ 1:31 ( 10 8 ( exp "134;000RT # $ ð1 " XÞ 900 !C:dX dt¼ 4:87 ( 10 6 ( exp "114;000RT # $ ð1 " XÞ 1000 !C:dX dt¼ 6:04 ( 10 5 ( exp "106;000RT # $ ð1 " XÞ 1200 !C:dX dt¼ 1:1 ( 10 7 ( exp "150;000RT # $ ð1 " XÞ 1400 !C:dX dt¼ 4:54 ( 10 9 ( exp "208;000RT # $ ð1 " XÞ
[43] Fruit Hulls, vertical furnace 600 !C, 10 !C/min
TGA 900 5–20 200–500 21 dX
dt¼ 1:485 ( exp "70;500RT
# $
ð1 " XÞ
[44] Beech, Furnace, 527 !C TGA 600 5–15 <80 21 dX dt " "De vol¼ 1:22 ( 10 7 ( exp "114;500RT # $ ðb " XÞ dX dt¼ 1:4 ( 10 11 ( exp "182;600RT # $ ð1 " b " XÞ0:9
temperature (K). fðXÞ is the reaction model also known as the struc-ture function. hðPO2;sÞ is the oxygen partial pressure function which
represents the effect of oxygen partial pressure on the reaction rate. kðTpÞ is the temperature dependent rate constant which is
described by the Arrhenius equation:
kðTpÞ ¼ A ( exp "
Ea
RTp
% &
ð2Þ
where A is the pre-exponential factor, Eais the activation energy
(J.mol"1), R is the gas constant (J.mol"1.K"1). The oxygen partial
pressure function can be given in the form of a power law:
hðPO2;sÞ ¼ P n
O2;s ð3Þ
where n is the reaction order with respect to oxygen.
In the literature, most of the authors employed Eqs.(1)–(3)to represent the kinetic of biomass char combustion[33]. However, some researchers[34,35]have used a Langmuir-Hinshelwood for-mulation which describes the competition between adsorption and desorption phenomena on the char surface. It provides a descrip-tion of the O2adsorption and CO (CO2) desorption process during
carbon oxidation from the writing of elementary reaction steps
[30,36]. The simplest Langmuir-Hinshelwood formulation is expressed as follow:
kðTpÞ ( hðPO2;sÞ ¼ Rglobal¼
kdkaPO2;s
kaPO2;sþ kd ð4Þ where kdand ka are the rate constants for desorption and
adsorp-tion process respectively and follow an Arrhenius law.
The Langmuir-Hinshelwood formulation predicts an effective reaction rate which varies with oxygen partial pressure and tem-perature. This form exhibits the two following limiting cases at a given pressure: when the adsorption process is the limiting step then Rglobal¼ kaPO2;s(first order of Eq.(3)) and when the desorption
process is the limiting step then Rglobal¼ kd(zeroth order of Eq.(3)).
According to Hurt and Calo[30], measured activation energies for desorption are in the range of 160–400 kJ/mol. These last values are much greater than those for adsorption which are comprised between 10 and 125 kJ/mol.
The structure function f ðXÞ represents the reactive surface of the particle. Its evolution during the gasification or combustion reactions is difficult to predict and is subject to discussion in the literature[14]. Due to the complex char structure, several kinetic models are reported in the literature to represent the structure
function. According to Tables 1 and 2, the most commonly used models for char combustion are the Power Law Model (PL) and the Volumetric Model (VM)[37]. The Power Law Model is totally empiric in nature while the Volumetric Model assumes a homoge-neous reaction throughout the particle. In the case of char gasifica-tion with carbon dioxide or steam, the Shrinking Core Model (SCM)
[38]is also frequently used to represent kinetic data[39,40]. These three models (i.e. PL, VM and SCM) describe a decrease in reaction rate with conversion. Finally, the Random Pore Model (RPM) pro-posed by Bathia et al.[41]has received much interest due to its ability to predict a maximum reaction rate which is often observed during combustion and gasification of char. This model introduces a structural parameter by considering that the char particle is por-ous and the reaction occurs at the internal surface of the pores. As the reaction proceeds, a random overlapping of the pores occurs which can increase or reduce the reactive surface area. This model was largely used for gasification of char with CO2and steam[39]. A
very few authors[17,19]also found that the Random Pore Model satisfactorily fitted the reaction rate of biomass char combustion. In some cases, some authors[42]represented the structure func-tion with a 6th order polynomial funcfunc-tion which is totally empiric in nature.
As it can be observed inTables 1 and 2, the majority of research-ers[22–25,28,43]considers a global kinetic model for char com-bustion with activation energies ranging between 70,500 and 182,600 J/mol and reaction orders with respect to oxygen between 0.53 and 0.85. According to Di Blasi [33], this dispersion in the kinetic parameters is caused by different biomasses and char prop-erties, pyrolysis conditions, amount and composition of ash, oper-ating conditions and device of the experiments. It is important to note that several authors[20,22,28]incorporated the dependence of reactivity on the oxygen partial pressure into the pre-exponential factor so that the results are only valid for the gaseous mixture (air) used in the experiments[33].
However, some authors[17,44]have reported two zones on the curve of conversion rate versus temperature during non-isothermal combustion: a shoulder at low temperatures followed by a sharp peak. They attributed these two peaks to two phenom-ena which occur in parallel, a devolatilization step and a combus-tion step. During the kinetic study of beech char combuscombus-tion, Branca et al.[44]concluded that a two-steps reaction mechanism which takes into account both devolatilization and combustion reactions provides a good description of measured data. According to these authors, the devolatilization stage is well described by a Table 2
Literature review on kinetic of biomass char combustion in isothermal conditions.
Ref. Pyrolysis conditions Combustion operating conditions Kinetic expression Reactor Temp. (!C) Diam (lm) O2(%) dXdt(s"1), A (s"1), Ea(J/mol)
[19] Prosopis Alba (PA) Prosopis caldenia (PC) Nothofagus Pumilio (NP) Lignin (L) Furnace, 610 !C, 3 !C/min TGA 350–550 < 88 2–18 PA:dX dt¼ S0 1"pk0( exp " 84;850 RT # $ P0:74 O2 ð1 " XÞ ( ffiffiffiffiffiffiffiffiffiffiffiffiffiffiffiffiffiffiffiffiffiffiffiffiffiffiffiffiffiffiffiffi 1 " 5lnð1 " XÞ p PC:dX dt¼1"S0pk0( exp " 93;200 RT # $ P0:8 O2ð1 " XÞ ( ffiffiffiffiffiffiffiffiffiffiffiffiffiffiffiffiffiffiffiffiffiffiffiffiffiffiffiffiffiffiffiffiffiffiffiffi 1 " 2:6lnð1 " XÞ p NP:dX dt¼1"S0pk0( exp " 124;600 RT # $ P0:85O2 ð1 " XÞ ( ffiffiffiffiffiffiffiffiffiffiffiffiffiffiffiffiffiffiffiffiffiffiffiffiffiffiffiffiffiffiffiffiffiffiffiffi 1 " 2:6lnð1 " XÞ p L:dX dt¼ S0 1"pk0( exp " 81;100 RT # $ P0:8O2ð1 " XÞ ( ffiffiffiffiffiffiffiffiffiffiffiffiffiffiffiffiffiffiffiffiffiffiffiffiffiffiffiffiffiffiffiffi 1 " 5lnð1 " XÞ p [20] Wire mesh, 850 !C Pine (P) Oak (O) Eucalyptus (E) Almond shell (AS) Olive stone (OS)
TGA 300–550 100–200 Air P:dX dt¼ 3:8 ( 10 7 ( exp "140;000RT # $ ð1 " XÞ0:4 O:dX dt¼ 4:3 ( 10 7 ( exp "136;000RT # $ ð1 " XÞ1:1 E:dX dt¼ 9:2 ( 10 6 ( exp "142;000RT # $ ð1 " XÞ0:9 AS:dX dt¼ 5 ( 10 7 ( exp "142;000RT # $ ð1 " XÞ1:1 OS:dX dt¼ 3 ( 10 7 ( exp "134;000RT # $ ð1 " XÞ [21] Pine wood Screen heater reactor 600 !C, 300 !C/s
TGA Packed bed 300–450 80–106 2.25–36 dX dt¼ 5:3 ( 10 5 ( exp "125;000RT # $ P0:53 O2 ð1 " XÞ 0:49
relatively low activation energy compared to the one of char com-bustion[17,44].
In the literature, isothermal combustion of char in TGA is achieved by employing a switching gas method[19,21]. It consists in heating the reactor under an inert atmosphere to the desired reaction temperature before switching the gas from inert to reac-tive to perform the combustion. This technique is also employed for isothermal char gasification with H2O[45] or CO2 [18,39]in
TGA. After the switching gas method, the newly introduced agent has to diffuse and replace the former gas in the apparatus. It is known that the time necessary for totally replacing the inert gas is likely to affect the char combustion rate[46]as it would cause a continuous change in the oxygen concentration or partial pres-sure in the TGA. For example, Zeng et al.[47]mentioned that it required 5–10 min for the TGA to reach a steady state after switch-ing the gas from N2to CO2. Therefore, it appears essential to take
into account the variation of oxygen partial pressure in the TGA for determining the kinetic of char combustion.
The aim of the present study is to determine the combustion kinetic of biomass char in isothermal conditions. This char was obtained by fast pyrolysis of beech bark pellet in a fluidized bed reactor and thoroughly characterized in a previous paper to under-stand its physicochemical properties and reactivity[9].
This article is divided into two parts:
1) The first part of this paper focuses on the production of char and the determination of its physicochemical properties. The TGA protocol is defined and the TGA response time just after switching the gas from inert to reactive is investigated. The purpose is to observe and to model the evolution of oxygen partial pressure as it directly influences the kinetic of char combustion.
2) The second part of this article is the kinetic determination of isothermal char combustion in TGA. Experiments are carried out at atmospheric pressure and various temperatures ranging from 330 to 850 !C and oxygen partial pressures ranging from 5065 to 21,273 Pa. The response time of the TGA is integrated in the kinetic modelling so that the variation in the oxygen partial pressure is taken into consideration. Several kinetic models are tested and the most appropriate one is selected to represent the combustion reactivity of char in Regime I. Finally, the influence of mass transfer phenomena in the TGA is investigated.
2. Experimental section 2.1. Char preparation
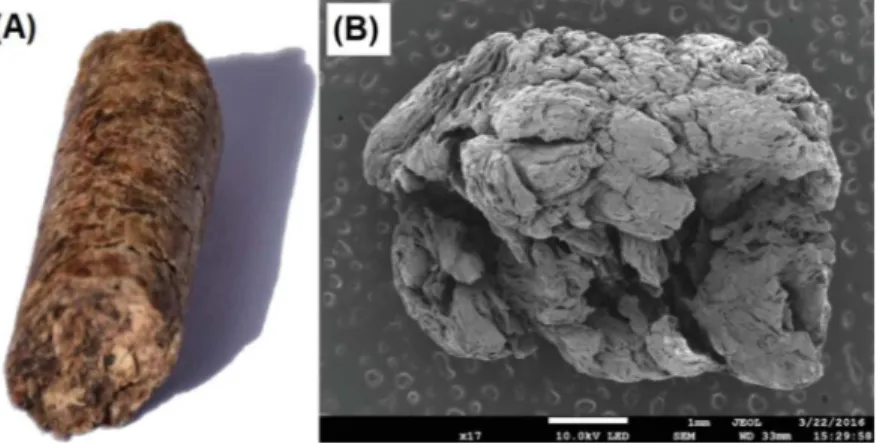
The biomass used in this work is cylindrical pellets of beech bark (D = 6 mm, L = 15 mm) obtained by mechanical compaction
of sawdust. A picture of the raw material is given in Fig. 1(A). The proximate analysis of the biomass was carried out following the standard test method for chemical analysis of wood charcoal D 1762-84. The results are given inTable 3. The apparent density of the biomass was measured from the weight and volume of five single particles and is equal to 1050 * 11 kg/m3.
Fast pyrolysis of the biomass was carried out under an inert atmosphere of nitrogen by instant immersion of a fixed mass of biomass particles in a batch dense fluidized bed reactor containing 5 kg of sand particles. The experimental details have been given elsewhere[9]. Briefly, the reactor consists of a refractory steel tube with 125 mm inner diameter and 1110 mm height equipped with a perforated plate distributor. It is surrounded by two electric fur-naces delivering 6 kW electric powers. The fluidizing gas flow rate is measured by a rotameter before feeding the bed. A cyclone and a condenser collect respectively the elutriated particles and con-densable vapors at the outlet of the reactor. The biomass injection system is made of a cylindrical tube of 25 mm diameter with the lower end located inside the fluidized bed. An injected biomass mass of 20 g was chosen to prevent a temperature decrease supe-rior to 5 !C.
The experiments are carried out with a fixed nitrogen mass flow rate of 7 kg/h, corresponding to 7 times the minimum fluidization velocity of sand at 850 !C.
The fast pyrolysis of the beech bark pellet was performed at 850 !C and at atmospheric pressure. This temperature was chosen since 850 !C is the operating condition of the gasifier in FICFB pro-cess. After reaching the pyrolysis temperature, about 20 grams of biomass are introduced inside the fluidized bed and the operation is repeated at least 5 times to produce a significant amount of chars. After the pyrolysis, the produced chars are cooled under a flow of nitrogen before being recovered the day after by sieving. A picture of the obtained chars is given in Fig. 1(B). The soaking time at bed temperature was approximatively 3 h. The produced char was stored inside a pill-box until it was analyzed. The appar-ent density of char particles just after the pyrolysis process is equal to 333 * 24 kg/m3.
The physical and chemical properties of the biomass and its associated char are summarized in Table 4. True density was obtained by helium pycnometer.
2.2. Mercury porosimetry analysis
Char particles obtained from fast pyrolysis of biomass are known to be porous particles containing numerous pores. These pores are usually classified as micropores (dpore< 2 nm),
meso-pores (2 nm < dpore< 50 nm) and macropores (dpore> 50 nm).
Mer-cury porosimetry analysis enables to quantify the volume of pores larger than 3 nm by injecting mercury into the grinded chars under
increasing pressure from 0 to 4000 bars. This analysis was carried out on PEL850 with an AUTOPORE IV apparatus from Micromerit-ics. Prior to this analysis, the char was grinded to ensure that all particles have approximatively the same diameter (sauter diame-ter equal to 25
l
m).Fig. 2(A)presents the results of the cumulativeintrusion volume versus pressure. For pressure equal to 2 bars, the cumulative intrusion volume corresponds to the filling of intersti-tial area between the grinded char particles. From this result, the apparent density
q
a of grinded char particles can be calculated and is equal to 827 kg/m3. For pressures above 2 bars, thecumula-tive intrusion volume represents the filling of pores with a diame-ter greadiame-ter than 3 nm. As mentioned by several authors[14], one of the main problems of mercury porosimetry analysis is that char structure might be broken during the increase of pressure. There-fore, results reported may be affected by a large degree of uncer-tainty. Results of mercury porosimetry are given inTable 5. The true density given in this table takes into account both macro-and mesopores macro-and does not consider the presence of micropores. The porosity
e
pof grinded char particles is calculated from Eq.(5)and is equal to 55%. From the value of the true density given in
Table 5, the porosity related to macro- and mesopores can be cal-culated and is equal to 13%.
e
p¼ 1 "q
aq
t;c ð5ÞPhysical nitrogen adsorption at 77 K was also carried out in order to determine the total char surface area. During this experi-ment, nitrogen diffusion was very slow and we could not obtain exploitable results. It is well-known in the literature that nitrogen cannot penetrate deeply into micropores and sometimes equilib-rium cannot be achieved in such experiments[7]. This indicates that PEL850 contains some micropores. Nevertheless, as oxygen molecules have similar molecular diameter compared to the one of nitrogen molecules, the presence of micropores in the char does not influence the combustion kinetic since oxygen molecules can-not diffuse inside.
SEM picture of grinded particles of PEL850 is presented inFig. 2
(B) and showed that this char is composed of elementary very fine char grains with a diameter less than 1
l
m. Besides, mercuryporosimetry revealed that the average pores diameter is equal to 723 nm. This average pores diameter can be considered as a hydraulic diameter in which the oxygen diffuses toward the ele-mentary grains. This hydraulic diameter represents the interstitial space of an agglomeration of elementary grains with a diameter dg.
Table 3
Proximate analysis of the beech bark pellet (wt%, dry basis).
Biomass Moisture (%) Volatile matters (%) Fixed carbona(%) Ash (%)
Beech bark pellet 10.9 75.13 11.15 2.82
a by difference.
Table 4
Ultimate analysis and physicochemical properties of the produced char.
Pyrolysis conditions True densityqt;c(kg/m3) Ultimate analysis (db, wt%) Chemical Formula
Material Pyrolysis Temp. (!C) He pycnometer C H O Ash –
PEL – 1433.3 44.79 6.09 47.29 2.82 CH1.63O0.79 PEL850 850 1832.5 75.49 0.56 6.06 17.89 CH0.09O0.06 0 0.5 1 1.5 2 0.01 0.1 1 10 100 1000 10000 Cumulative intrusion (mL/g) Pressure (bar)
(A)
Fig. 2. (A) Cumulative pore volume versus pressure from mercury porosimetry analysis of PEL850, (B) SEM picture of grinded char particle.
Table 5
Physicochemical properties of the grinded char particles, results from mercury porosimetry analysis. Char Apparent density
qa(kg/m3)
True density (kg/m3)
Mean pore diameter dpore(nm)
Porosityep(%) Porosity of meso and
macropores (%)
Surface area (m2/g)
The elementary grain diameter is then calculated according to the following expression: dg¼ 6 4 (
e
p 1 "e
p dpore ð6Þwhere dgis the elementary char grain diameter (m),
e
pis theporos-ity of the grinded char particles and dporeis the average pore
diam-eter of the grinded char particles (m).
From Eq.(6), the elementary char grain diameter was found to be equal to 0.9
l
m which is in good agreement with resultsobserved inFig. 2(B). Hence, it can be assumed that the elementary grains are made of micropores which are not accessible for oxygen molecules.
2.3. Isothermal TGA combustion tests 2.3.1. TGA protocol
Char reactivity in combustion was measured using isothermal TGA analyses with a TGA Q600 analyzer from TA Instruments. The grinded particles with a sauter diameter of 25
l
m are used.Preliminary, tests with various sample weights ranging from 2 to 15 mg confirmed that 8–10 mg is the optimum sample weight which enables to achieve accurate and repeatable results. Conse-quently, about 8 mg of PEL850 were introduced inside an alumina crucible (inner diameter and height of the crucible equal to 5.5 mm and 4 mm, respectively) for each test. The height of the char layer is dc¼ 0:7 mm. The experimental protocol is divided into two
stages. The first one, carried out under high-purity nitrogen flow (100 NmL/min), consists in:
! an initial period of 15 min at ambient temperature used to ini-tialize the system,
! a linear heating rate of 10 !C/min from ambient temperature to the combustion temperature,
! a period of 15 min at the combustion temperature to stabilize the system.
The second stage is the isothermal combustion of char carried out by switching nitrogen to a mixture of N2/O2with the same flow
rate. Temperatures in the range of 330 to 450 !C were tested and a final analysis was carried out at a temperature of 850 !C. Oxygen partial pressure was varied between 5065 and 12,273 Pa. All of the gas mixtures of N2/O2were purchased from Air Liquide and
have an accuracy of 0.1%.
During the first stage carried out under pure nitrogen, a mass loss less than 5% was observed for each experiment and combus-tion temperature up to 450 !C. Klinghoffer et al.[48]reported sim-ilar mass losses in the char when heated under nitrogen in TGA. They attributed this mass loss to several phenomena:
! Water loss due to the presence of adsorbed water in the char pores since the char was stored at atmospheric conditions. ! The loss of volatile products which are still present in the char.
The conversion rate is calculated via the following equation:
X ¼wwi" wðtÞ
i" wash ð7Þ
where wi, wðtÞ and washare the initial, temporal and final sample
weight, respectively.
The apparent reaction rate was defined as the derivative of the evolution of the conversion rate versus time, for a conversion rate of 50%: Rapp¼ dX dt " " " " X¼0:5 ð8Þ
2.3.2. Response of the TGA to a concentration step
The purpose of this section is to observe the time necessary to the reactive gas to completely replace the inert gas just after switching the gas from inert to reactive. As mentioned by some authors, this time interval depends on the reactor geometry, the reactor volume and gas flow rate[49]. In our case, inner diameter and length of the cylindrical TGA furnace are respectively 22.86 mm and 174 mm. This study was carried out by connecting a paramagnetic gas analyzer SERVOMEX to the outlet of the TGA. This apparatus provides high performance oxygen monitoring and enables oxygen quantification after switching the gas from N2to a mixture of N2/O2. Before entering the analyzer, the gas line
is cooled into a gas cooler. The response time of the sampling gas lines and analyzer to an oxygen concentration step is given in
Fig. 3. It consists in a pure delay of 1 min followed by a substantial increase of the oxygen fraction which can be considered as a con-centration step.
To examine the time necessary to completely replace the inert gas by the reactive gas in the TGA after the switching gas method, blank experiments without char in the crucible were performed at three different temperatures (330, 500 and 850 !C). They consist in heating the TGA in inert atmosphere to the run temperature, a per-iod of 15 min at the run temperature and then switching the gas from N2to air. The switching method is considered as a
concentra-tion step and the oxygen molar fracconcentra-tion is continuously measured at the outlet of the TGA. The result of the temporal variation of the normalized oxygen fraction during an experiment at 500 !C is given inFig. 3. Other experiments at 330 and 850 !C showed that the oxygen fraction profile is independent of the TGA temperature. It can be seen that the response of the TGA to a concentration step can be divided into two parts:
! A pure delay for approximatively two minutes which is associ-ated with the response of a plug flow tubular reactor. During this period, the partial pressure of oxygen is equal to zero. ! A continuous increase of the oxygen fraction to a constant
value. This profile is attributed to the behavior of a continuous flow stirred-tank reactor and represents the evolution of oxygen partial pressure around the crucible.
Consequently, during our isothermal char combustion experi-ments in thermogravimetric analyzer, it takes about 25 min for the mixture of N2/O2to completely replace the inert gas in the
apparatus after the switching gas method. Oxygen partial pressure
Fig. 3. TGA response time at 500 !C. (– –) Oxygen molar fraction of the sampling gas lines and analyzer, (!!) Oxygen molar fraction at the TGA outlet, ( ) and ( ) oxygen molar fractions at the outlet of the continuous flow stirred-tank reactors 1 and 2, respectively.
can no longer be considered as constant during the initial part of char combustion. In the following, the pure delay of 1 min due to the gas sampling and analyzer was removed. In order to take into consideration this effect for determining char combustion kinetics, we chose to represent the transfer function of the TGA by the asso-ciation of ‘‘n” continuous flow stirred-tank reactors in series with the same residence time according to the following differential equations system: dY1O2 dt ¼ 1 sCSTR( ðY in O2" Y 1 O2Þ dY2O2 dt ¼ 1 sCSTR( ðY 1 O2" Y 2 O2Þ .. . dYnO2 dt ¼sCSTR1 ( ðY n"1 O2 " Y n O2Þ 8 > > > > > > > > < > > > > > > > > : ð9Þ
where YO2is the normalized molar fraction of oxygen which
repre-sents the measured oxygen percentage divided by the maximum oxygen percentage, Yin
O2is the normalized molar fraction of oxygen
at the inlet of the TGA (Yin O2¼ 1Þ, Y
1 O2. . .Y
n
O2 are the normalized
molar fractions of oxygen at the continuous flow stirred-tank reac-tors outlet 1. . . n respectively and
s
CSTRis the residence time of thecontinuous flow stirred-tank reactors.
The parameters n and
s
CSTRare identified by solving Eq.(9)usingan explicit Runge Kutta (4,5) formula and applying the nonlinear least-squares curve fitting problem. Hence, the parameters n and
s
CSTR were found to be 2 and 3.3 min respectively.Fig. 3presentsthe corresponding transfer function by taking two continuous flow stirred-tank reactors with a residence time of 3.3 min each. The model well represents experimental results. Therefore, in the fol-lowing, the response time of the TGA will be taken into account for modelling the oxygen partial pressure in the kinetic expression (Eq.(1)).
2.3.3. Mass transfer within the crucible
The aim of this part is to evaluate the diffusional effects of oxy-gen which take place around and within the crucible. Indeed, dur-ing char combustion in TGA, a boundary layer is formed at the upper surface of the crucible. In this zone, the transfer of oxygen proceeds through convection. Besides, some authors [50–52]
observed the presence of a stagnant gas region between the upper surface of the crucible and the surface of char particles. In this region, the oxygen may transfer through diffusion. These two diffu-sional effects can lead to significant gradients of oxygen concentra-tion which decrease char reactivity in combusconcentra-tion.
Diffusional effects inside the crucible were estimated by vapor-izing a small amount of about 15 mg of fine naphthalene (C10H8)
particles at 110 !C in isothermal conditions. After loading about 15 mg of naphthalene particles in an alumina crucible (height of the naphthalene layer equal to 1 mm), the TGA was heated up with a linear heating rate of 50 !C/min up to 110 !C under high purity flow of nitrogen. A period of 1 h at 110 !C was maintained to totally vaporize naphthalene. From the recorded mass loss, naphthalene evaporating mass flow rate was calculated and plotted versus time for different nitrogen volume flow rates (i.e. 50, 100 and 150 NL/min) in the TGA. It was observed that naphthalene vaporization mass flow rate substantially increases (during the non-isothermal period) before reaching a constant value. Besides, this mass flow rate was found to be independent of the nitrogen volume flow rate. This indicates that transfer resistance through convection is negli-gible compared to transfer resistance through diffusion inside the crucible. From the constant naphthalene mass flow rate, the global mass transfer coefficient is determined and is equal to 3.67(10"3m/s. This value is very close to the term
DC10H8"Air=ðH " dC10H8Þ which corresponds to the diffusion of
naph-thalene through the stagnant zone in the crucible. DC10H8"Air
repre-sents the diffusion coefficient of naphthalene into air (m2/s). This
coefficient is dependent on the temperature and is calculated from ref[53].
Therefore, during naphthalene vaporization in TGA, mass trans-fers mainly occur through diffusion inside the stagnant zone in the crucible. Besides, naphthalene transfer through convection at the upper surface of the crucible is not the limiting step and can be neglected compared to naphthalene diffusion.
Consequently, during char combustion in TGA, oxygen mass transfers around and within the crucible can be modelled by pure diffusion phenomena of oxygen into N2in the stagnant zone.
3. Results and discussion
3.1. Effect of combustion temperature
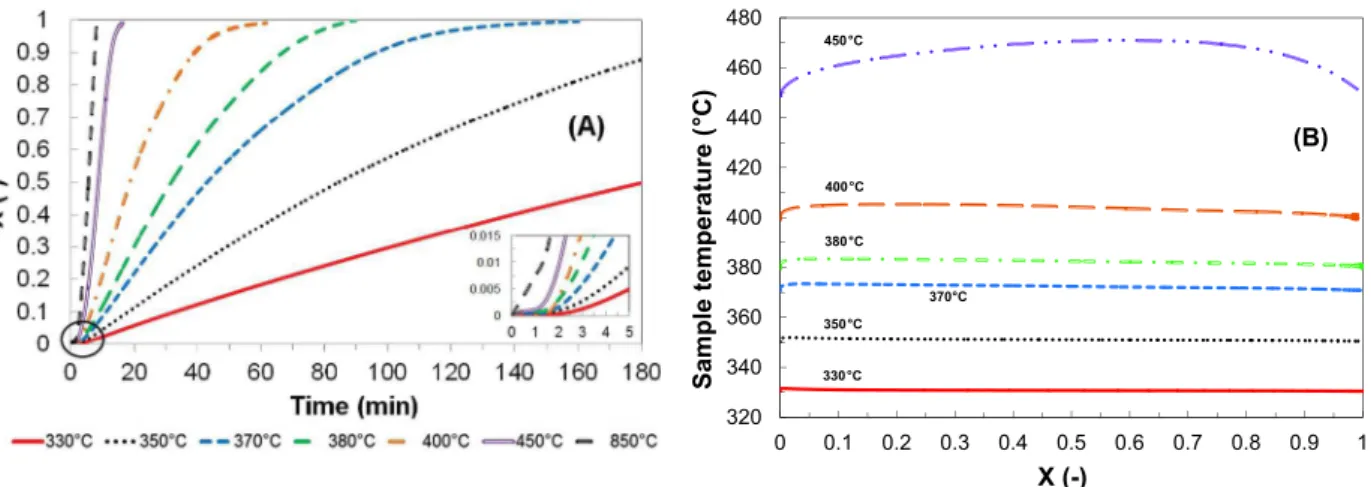
Fig. 4presents the effect of combustion temperature on the con-version rate and the sample temperature profile during the com-bustion of PEL850 in the TGA.
First, it can be seen that the conversion rate is highly dependent on the combustion temperature, especially for temperatures up to 400 !C. This result is well-established in the literature for both combustion and gasification of char[39]. For instance, at a given conversion rate of 0.5, it requires a much shorter reaction time at a higher combustion temperature (181 min, 84.5 min, 43.0 min, 31.8 min, 18.8 min for temperatures of 330 !C, 350 !C, 370 !C, 380 !C and 400 !C respectively). For higher temperatures, this effect is less significant and the reactivity is very high. It takes 8.8 min and 5.6 min for temperatures of 450 !C and 850 !C respec-tively). Fig. 4(A) also shows that a pure delay is noticed at the beginning of the reaction. Indeed, the conversion rate is equal to zero for approximatively 1 min before gradually increasing. This can be explained by the response time of the TGA (see Sec-tion2.3.2). During this pure delay of 1 min, the oxygen partial pres-sure is null and the combustion has not begun. The steady state of oxygen partial pressure is obtained 25 min after the switching gas method. Consequently, the combustion is strongly impacted by the TGA response time.
Fig. 4(B) reports the sample temperature profile in the TGA dur-ing the combustion. For each experiment, the sample temperature first substantially increases before gradually decreasing to the pre-set combustion temperature. For temperatures up to 400 !C, the temperature raise is less than 5 !C. Consequently, the combustion can be considered as isotherm in this range of temperatures. Nev-ertheless, above 400 !C, the strong exothermicity of the combus-tion leads to a significant increase in the sample temperature (about 20 !C at 450 !C) and a faster reaction. The combustion is no longer isotherm. Therefore, in the following, the kinetic study is performed in isothermal conditions for temperatures up to 400 !C.
Intrinsic reactivity and kinetic of char combustion correspond to the intrinsic chemical transformations which occur when the chemical reaction is the limiting step compared to external mass and heat transfers. Hence, the oxidative reaction must occur in Regime I[8].Fig. 5shows the logarithm of the apparent reaction rate (Eq.(8)) versus 1/T for the combustion of PEL850 under a con-stant partial pressure of oxygen (21,273 Pa). The reaction of com-bustion can be divided into three main regimes. Regime I occurs for temperatures up to 400 !C. Considering Eqs.(1)–(3)and from the slope of the straight line, it is possible to determine activation energy without considering any reaction models. Its value is equal to 125 kJ/mol. However, this method is still subject to discussions as activation energy may be dependent on the level of conversion
intrinsic activation energy of char combustion. Regime II takes place for temperatures between 450 and 600 !C. In this regime, the apparent activation energy is much lower compared to the one obtained in Regime I. Finally, Regime III arises for higher tem-peratures and is associated with an apparent activation energy close to zero[8].
It is important to note that, in the case of char combustion with air in FICFB process, the reactor operates at 950 !C. According to
Fig. 5, the combustion should occur in Regime III. However, the oxygen partial pressure in the reactor is much lower than 0.21 bar because of oxygen consumption and carbon dioxide pro-duction during the char combustion. Hence, a low value of the oxy-gen partial pressure strongly decreases the char reactivity and the chemical reaction cannot be considered as negligible compared to external mass transfers. Therefore, in these types of reactor, it is necessary to take into account both mass transfers and intrinsic kinetic of char combustion. This is why, in this work, determina-tion of intrinsic kinetic is carried out in Regime I. This occurs for temperatures up to 400 !C.
3.2. Effect of oxygen partial pressure
The influence of oxygen partial pressure was performed at 400 !C and the results are shown inFig. 6. A raise of the oxygen partial pressure leads to a higher combustion rate. A short delay at the beginning of the reaction can still be observed inFig. 6(A) indicating that the effect of the TGA response time is still present
for various oxygen partial pressures. Again, considering Eqs.(1)– (3)and from the slope of the straight line ofFig. 6(B), it is possible to determine the reaction order with respect to oxygen. Its value is equal to 0.67.
3.3. Combustion rate profile
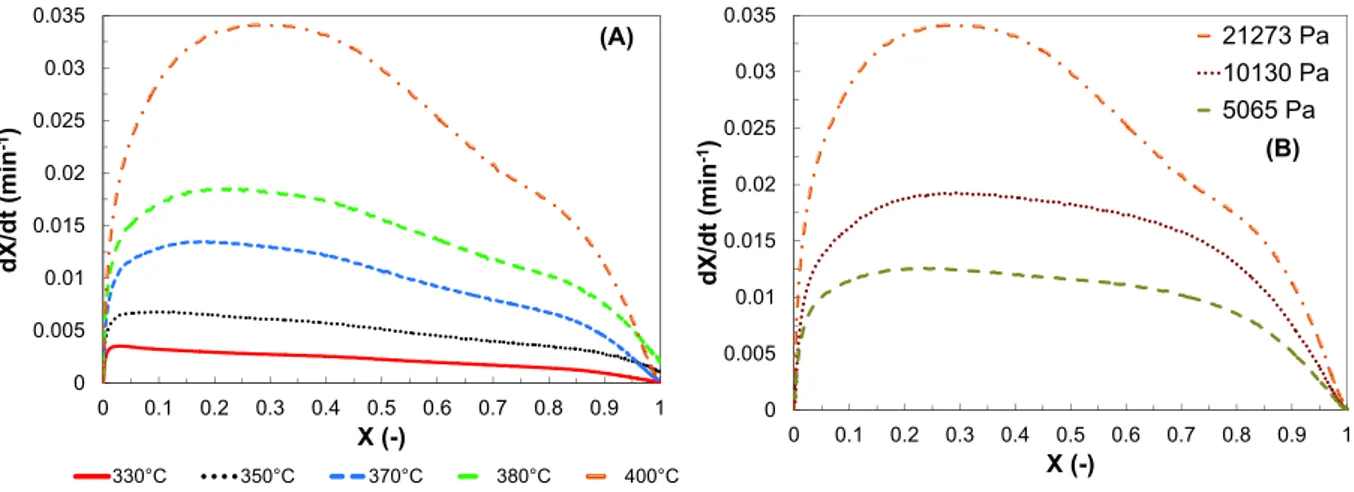
Fig. 7illustrates the effect of temperature and oxygen partial pressure on the combustion rate profile during the isothermal combustion of PEL850 in TGA in Regime I. It can be seen that, for each experiment, the combustion rate first increases before reach-ing a maximum value followed by a gradual decrease. This maxi-mum is frequently observed during char gasification
[46,47,49,55]and combustion[19,21]. Two different points of view can be found in the literature. First, some authors [49,55,19,21]
attributed the maximum reaction rate to a change of the char reac-tive surface during the reaction. Hence, they attempted to repre-sent the reaction rate profile using the Random Pore Model proposed by Bathia et al.[41]. In this model, the change of pore surface area of the particle during the reaction can explain the exis-tence of a maximum combustion rate. Indeed, an increase in the combustion rate is due to the growth of pores surface area while a decrease is attributed to the coalescence of neighboring pores. A maximum combustion rate occurs when the second effect over-shadows the first effect. Finally, the second point of view is that the maximum reaction rate is due to the low gasification agent content in the reactive atmosphere just after switching the gas from inert to reactive. For instance, in the case of CO2and steam gasification
of coal char, some researchers[46,47,49]concluded that the time necessary to reach a maximum reaction rate is independent of the type and partial pressure of the gasifying agent for a constant gas flow rate in the TGA. This time is then related to a dispersion phenomenon and is not associated with changes on the char sur-face during gasification[46].
A slow increase in the combustion rate is also observed inFig. 7. This phenomenon occurs at a conversion of about 0.7 for every combustion temperatures and oxygen partial pressures. According toTable 4, PEL850 contains a large amount of ash which is com-posed of 39% of silica, 40% of calcium, 2% of sodium, 12% of potas-sium and 7% of magnepotas-sium. The significant ash content can lead to a catalytic effect during char combustion. Therefore, the slow increase of the combustion rate observed for conversion above 0.7 can be associated with the catalytic effect of ash.
In the literature, several kinetic models were used to represent the kinetic of char combustion. They have been presented in the introduction. Among them, the Power Law Model, the Volumetric
320 340 360 380 400 420 440 460 480 0 0.1 0.2 0.3 0.4 0.5 0.6 0.7 0.8 0.9 1 S a m p le t e m p e ra tu re ( °C ) X (-) °C °C °C (B) 330 350 380 400°C 450°C 370°C
Fig. 4. (A) Conversion rate versus time, (B) Sample temperature versus conversion rate, (effect of temperature – PO2= 21,273 Pa).
-7 -6 -5 -4 -3 -2 -1 0.75 1 1.25 1.5 1.75 ln ( Ra p p ) 1000/T (K-1) X = 0.5
Fig. 5. Logarithm of the apparent reaction rate versus 1/T at a given conversion rate of 0.5 during the combustion of PEL850 in TGA in air.
Model and the Shrinking Core Model are classified into decelera-tory models which represent a decrease of the combustion rate versus conversion. Other models such as the Avrami-Erofeyev (A) Models[32]can be found which are based on nucleation and nuclei growth models. These last models as well as the Random Pore Model are known as sigmoidal models which show a bell-shapes relationship between reaction rate and conversion rate[32]. These models are able to predict a maximum combustion rate and according to the shape of the curve inFig. 7may have much inter-est to represent kinetic of char combustion.
3.4. Kinetic modelling 3.4.1. Kinetic models
In this work, a large amount of models were tested (i.e. PL, VM, SCM, RPM and Avrami-Erofeyev (A) Models). Two models were found to be in good agreement with experimental data: the Shrink-ing Core Model[38]and the Random Pore Model[41]. These two models are presented below.
The SCM[38]assumes that the reaction takes place at the out-side surface of a non-porous particle with an initial radius R0in
isothermal conditions. As the reaction proceeds, the surface moves into the interior of the solid leaving behind an inert ash. By consid-ering a spherical particle and a pseudo-steady-state regime, the reaction rate can be expressed as:
dX dt ¼ Sp0Mc
q
t;cð1 "e
pÞxc AGM( exp " Ea RTp % & ( PnO2;i( ð1 " XÞ 2=3 ð10Þwhere Sp0is the external surface area of the initial char particles per unit volume (m2/m3), M
cis the molar weight of carbon (kg.mol"1),
q
t;cis the true density of the char (kg.m"3), xcis the mass fraction ofcarbon in the char particle and AGM is the pre-exponential factor
(mol.m"2.Pa-n.s"1).
In the case of a spherical porous char particle, each particle is considered as made up of a large number of non-porous spherical grains of uniform radius rg. It is then assumed that the reaction of
each grain proceeds from the outside toward the center so that the reaction front within each grain exhibits spherical symmetry[8]. Hence, Eq.(10)obtained for a reaction of a non-porous char parti-cle applies directly to the individual grain and is called the Grain Model (GM)[8]. Hence, the difference between the SCM and the Grain Model arises from the expression of the external surface area. In our case, we showed that PEL850 is a porous char particle made of numerous non-porous grains. Hence, the Grain Model is used and the external surface area is expressed as:
Sp0¼
3 rg
for the Grain Model ð11Þ
where rg¼ 0:45
l
m. The value of Sp0is equal to 6.66.106m2.m"3. Todetermine kinetic parameters (i.e. pre-exponential factor, activation energy and reaction order with respect to oxygen), most of the authors[39]in the literature use a graphical resolution by integrat-ing Eq.(10)and plotting the left hand side versus time:
1 " ð1 " XÞ1=3 ¼ KGM( t ð12Þ 0 0.1 0.2 0.3 0.4 0.5 0.6 0.7 0.8 0.9 1 0 20 40 60 80 100 120 140 160 X ( -) Time (min) 21273 Pa 10130 Pa 5065 Pa (A) -4.6 -4.2 -3.8 -3.4 8 8.5 9 9.5 10 10.5 ln ( Rapp ) ln (PO2) (B)
Fig. 6. (A) Conversion rate versus time, (B) logarithm of apparent reaction rate versus logarithm of oxygen partial pressure, (effect of oxygen partial pressure – T = 400 !C).
0 0.005 0.01 0.015 0.02 0.025 0.03 0.035 0 0.1 0.2 0.3 0.4 0.5 0.6 0.7 0.8 0.9 1 d X /d t (m in -1) X (-) 330°C 350°C 370°C 380°C 400°C (A) 0 0.005 0.01 0.015 0.02 0.025 0.03 0.035 0 0.1 0.2 0.3 0.4 0.5 0.6 0.7 0.8 0.9 1 d X /d t (m in -1) X (-) 21273 Pa 10130 Pa 5065 Pa (B)
From the slope of the straight line (Eq.(12)), kinetic parameters can be determined for various combustion temperatures and oxy-gen partial pressures.
The RPM[41]was performed since the char is characterized by the presence of fine pores[9]. This model considers that the reac-tion takes place at the surface of the pores of a solid particle. As the reaction progresses, it is assumed that neighboring surface inside the particle will intersect one another and pores will overlap. By considering a spherical particle, the reaction rate is given by:
dX dt ¼ S0 1 "
e
p ARPM( exp " Ea RTp % & ( PnO2;i( ð1 " XÞ ffiffiffiffiffiffiffiffiffiffiffiffiffiffiffiffiffiffiffiffiffiffiffiffiffiffiffiffiffiffiffiffiffi 1 "u
lnð1 " XÞ q ð13Þwhere S0 is the initial internal surface area per unit volume (m2.
m"3),
e
p is the initial porosity of the particle, ARPM is the
pre-exponential factor (m3.m"2.Pa-n.s"1) and
u
is a structural parameterrelated to the pore structure of the initial char. The value of
u
can be expressed by the following equation:u
¼4p
L0ð1 "e
pÞS20 ð14Þ
where, L0is the initial pore length per unit volume (m.m"3). A value
of
u
equal to 0 represents the volumetric model while value ofu
equal to 1 is close to the Shrinking Core Model[41]. Hence, a max-imum reaction rate arises when the value of the parameter
u
is large (above 2). Besides, the larger the value ofu
, the more acute is the peak. In the literature, some authors[55]used a graphical approach to determine both the structural parameteru
and the kinetic parameters (K0, Eaand n) according to Eqs.(15) and (16).u
¼2 lnð1 " X2maxÞ þ 1 ð15Þ
where Xmaxis the conversion rate related to the maximum
com-bustion rate. An integration of Eq.(13)gives the following relation
[41]: 2
u
( ffiffiffiffiffiffiffiffiffiffiffiffiffiffiffiffiffiffiffiffiffiffiffiffiffiffiffiffiffiffiffiffiffiffi 1 "u
lnð1 " XÞ q " 1 - . ¼ KRPM( t ð16ÞA linear evolution of the left hand side of Eq.(16)versus time for different temperatures and oxygen partial pressures enables to determine the kinetic parameters from the slope of the line. 3.4.2. Modelling
The graphical method described above for the two models was not employed in this work since the oxygen partial pressure cannot be considered as uniform in the first 25 min of the char combus-tion. To obtain kinetic parameters, a differential equations system was defined which takes into consideration both the response time of the TGA and the intrinsic kinetic of char combustion (GM or RPM). It is given in the following expression:
The kinetic parameters AGM, ARPM, Ea and n are estimated by
solving Eq.(17)using an explicit Runge Kutta (4,5) formula and applying the nonlinear least-squares curve fitting problem. It
con-sists in minimizing the sum of the difference between each exper-imental data and the one corresponding to the model for all temperatures and oxygen partial pressures according to the fol-lowing expression: min x kf ðxÞk 2 2¼ minx X N i¼1 fiðxÞ 2 ! ð18Þ
where fiðxÞ ¼ Xexp" Xmod, x represents the kinetic parameters and N
corresponds to the number of experimental data.
In the case of the Grain Model, the values of pre-exponential factor, activation energy and reaction order with respect to oxygen are given inTable 6. It can be seen that activation energy is similar to that obtained in Section3.1. Its value is also in good agreement with those obtained in the literature[33]. Likewise, reaction order with respect to oxygen is also in the same order of magnitude com-pared to some previous works (seeTables 1 and 2). Comparisons between experimental data and results obtained from the Grain Model including the response time of the TGA are given inFigs. 8 and 9. The intrinsic GM for a combustion temperature of 400 !C is also reported inFig. 9. A very good agreement is found between experimental and predicted results.Fig. 9shows that, taking into
account the non-uniform oxygen partial pressure in the initial stage of the combustion enables the GM to predict a maximum in the reaction rate.
0 0.1 0.2 0.3 0.4 0.5 0.6 0.7 0.8 0.9 1 0 100 200 300 400 500 X ( -) Time (min) 330°C 350°C 370°C 380°C 400°C
GM + TGA response time
Fig. 8. Comparison between conversion rate obtained from char combustion in TGA and the conversion rate obtained from the Grain Model including the response time of the TGA.
TGA Response Time
dPO2;1 dt ¼sCSTR1 ( ðPO2;in" PO2;1Þ dPO2;2 dt ¼sCSTR1 ( ðPO2;1" PO2;2Þ 8 < : Kinetic Models dX dt¼ Sp0Mc qt;cð1"epÞxcAGM( exp " Ea RTp # $ ( PnO2;2( ð1 " XÞ 2=3 for the GM dX dt¼ S0 1"epARPM( exp " Ea RTp # $ ( PnO2;2( ð1 " XÞ ffiffiffiffiffiffiffiffiffiffiffiffiffiffiffiffiffiffiffiffiffiffiffiffiffiffiffiffiffiffiffiffiffiffi 1 "
u
lnð1 " XÞ p for the RPM 8 > < > : 8 > > > > > > > > < > > > > > > > > : ð17Þ Table 6Kinetic parameters obtained with the Grain Model by solving the differential equation system given in Eq.(17).
Char type AGM(mol.m"2.Pa-n.s"1) Ea(J/mol) n (–) min
x kf ðxÞk 2 2
In the case of the Random Pore Model, the values of pre-exponential factor, activation energy, reaction order with respect to oxygen and structural parameter are given inTable 7. Compar-isons between experimental data and results obtained from the Random Pore Model including the response time of the TGA are given inFig. 10. The structural parameter is larger than 2 indicating that a maximum reaction rate arises during the char combustion. In the literature, several authors[17,19]mentioned that the Ran-dom Pore Model satisfactorily fitted the experimental combustion rate. During the isothermal combustion of lignin and three hard-woods, Magnaterra et al. [19] found a value of the structural parameter equal to 2.6 and 5 according to the type of chars, reac-tion orders with respect to oxygen in the range of 0.7–0.82 and activation energies between 78 and 128 kJ/mol. In the case of com-bustion of coal char in TGA, Kajitani et al.[56]concluded that the
ideal value of u is 14, reaction order with respect to oxygen and activation energy were found to be equal to 130 kJ/mol and 0.68, respectively.
Table 7also indicates the values of pre-exponential factor, acti-vation energy and reaction order with respect to oxygen obtained for a constant value of
u
equal to 1. As mentioned above, whenu
is equal to 1, the structure functions of both the RPM and the GM are very close to each other. This result is highlighted inFig. 11which shows that combustion rate obtained with the GM is very close to the one obtained with the RPM with u equal to 1. From the results given inTable 6andTable 7, it is then possible to calculate the ini-tial internal surface area per unit volume S0of PEL850. Its value isobtained by dividing the value of K0fromTable 7by the value of
½McAGM=ð
q
axcÞ- from Table 6. Thus, S0 was found to be6.55 ( 106m2.m"3which is close to the value of the external surface
area Sp0considering an initial radius rg.
0 0.01 0.02 0.03 0.04 0.05 0 0.1 0.2 0.3 0.4 0.5 0.6 0.7 0.8 0.9 1 d X /d t (m in -1) X (-) 330°C 350°C 370°C 380°C 400°C Intrinsic GM (400°C) GM + TGA response time
(A) 0 0.01 0.02 0.03 0.04 0 0.1 0.2 0.3 0.4 0.5 0.6 0.7 0.8 0.9 1 d X /d t (m in -1) X (-) 21273 Pa 10130 Pa 5065 Pa
GM + TGA response time (B)
Fig. 9. Comparison between combustion rate obtained by isothermal combustion of PEL850 in TGA and the combustion rate from the GM including the response time of the TGA, (A) at various temperatures in air, (B) at different oxygen partial pressures at 400 !C.
Table 7
Kinetic parameters obtained with the Random Pore Model by solving the differential equations system given in Equation(17).
Char type K0¼1"S0epARPM(Pa-n.s"1) Ea(J/mol) n (–) u(–) min
x kf ðxÞk 2 2 PEL850 1638.13 123,140 0.72 2.9 19.90 PEL850 1992 124,040 0.74 1 47.47 0 0.1 0.2 0.3 0.4 0.5 0.6 0.7 0.8 0.9 1 0 100 200 300 400 500 X ( -) Time (min) 330°C 350°C 370°C 380°C 400°C
RPM + TGA response time
Fig. 10. Comparison between conversion rate obtained from char combustion in TGA and the conversion rate obtained from the Random Pore Model (u = 2.9) including the response time of the TGA.
0 0.01 0.02 0.03 0.04 0.05 0 0.1 0.2 0.3 0.4 0.5 0.6 0.7 0.8 0.9 1 d X /d t (m in -1) X (-)
RPM + TGA response time RPM + TGA response time GM + TGA response time
( = 2.9 ) ( = 1 )
Fig. 11. Comparison between the Random Pore Model with values of u = 2.9 and 1 and the Grain Model including the response time of the TGA, combustion at 400 !C under air.
3.4.3. Comparison between the two models
Comparing the kinetic parameters obtained with the GM and the RPM, it can be seen that activation energies and reaction orders with respect to oxygen are similar for both models. This indicates that the difference arises from the values of pre-exponential factor and
u
parameters.Another aspect is that the value of min
x jjf ðxÞjj 2
2is slightly smaller
for the RPM than the GM. This indicates a more accurate modelling for the RPM compared to the GM. However, the larger amount of unknown kinetic parameters to identify for the RPM can explain the superior precision during the modelling. To our viewpoint, the difference between the two models is negligible and the RPM does not lead to a better accuracy of the modelling. Finally, consid-ering its less number of unknown kinetic parameters, the GM can be chosen to represent the combustion kinetic of PEL850.
Moreover, since the differential equations system including the response time of the TGA and the GM well represents the TGA data and the maximum combustion rate (Fig. 9), it can be concluded that this maximum is only due to the switching gas method during the isothermal combustion in TGA.
3.4.4. Effect of oxygen diffusion within the crucible
This section aims to verify whether the diffusion of oxygen in the crucible plays a significant role during isothermal char com-bustion in TGA.
By considering a uniform concentration of oxygen in the char layer, the oxygen balance in the char layer leads to the following equation:
where
e
is the porosity of the char layer (e
¼ 0:4Þ, Scrucibleis thecru-cible surface (m2), Cs O2and C
1
O2are the oxygen concentration at the
surface of the char particles and in the bulk respectively (mol/m3),
n0is the initial amount of char (mol) and Kcis the global oxygen
transfer coefficient (m/s).
In Section 2.3.3., it has been demonstrated that, during char combustion in TGA, oxygen transfer effects through convection at
the upper surface of the crucible can be neglected compared to oxygen diffusion within the stagnant zone in the crucible. Conse-quently, the oxygen transfer coefficient can be expressed as follow:
Kc¼
DO2"N2
H " dc ð20Þ
where DO2"N2 is the diffusion coefficient of oxygen into nitrogen
(m2/s). This diffusion coefficient is dependent on the combustion
temperature and is calculated from ref[57].
Fig. 12(A) presents the conversion rate versus time for the intrinsic GM and the GM taking into account oxygen diffusion given in Eq. (19) during the isothermal combustion of char at 350 !C. At 350 !C, oxygen diffusion in the stagnant zone within the crucible yields to a decrease of the char reactivity. This effect is increased by raising the combustion temperature. A parameter his defined by the following equation:
h¼t50%ðGM þ ODÞ " tt 50%ðGMÞ
50%ðGMÞ ð21Þ
where t50% is the time at 50% of conversion for the intrinsic
GM and the GM plus oxygen diffusion (GM + OD). This parameter highlights the effect of oxygen diffusion within the stagnant zone during char combustion. A low value of parameter h indicates a small impact of mass transfer on the char combustion.
Several authors in the literature[52]have considered diffusion of oxygen in the interstitial space within the char layer. This effect is considered by adding a second resistance to oxygen diffusion in the stagnant zone to represent oxygen balance. In this case, the global mass transfer coefficient is expressed using the following equation: Kc¼ H " d c DO2"N2 þ
e
=s
dc ( DO2"CO2 % &"1 ð22Þwhere
s
is the tortuosity and DO2"CO2is the diffusion coefficient ofoxygen into carbon dioxide (m2/s). For fixed bed particles, a value
of
s
¼ ffiffiffi 2 pcan be assumed[58].Fig. 12(A) also presents the
conver-0 0.1 0.2 0.3 0.4 0.5 0.6 0.7 0.8 0.9 1 0 40 80 120 160 200 240
X
(
-)
Time (min)
(A)
Fig. 12. Isothermal combustion of char: (A) Comparison between intrinsic GM (—), GM with oxygen diffusion in the stagnant zone ( ) and ( ) GM with oxygen diffusion in the stagnant zone and within the char layer, combustion at 350 !C, (B) effect of oxygen transfer versus temperature, (d) Oxygen transfer through diffusion in the stagnant zone, ( ) oxygen transfer through diffusion in the stagnant zone and within the char layer.
Accumulation of oxygen in the char layer
% &
¼ consumed by the reactionFlux of oxygen
% &
þ entering the charlayerFlux of oxygen
% &