Open Archive TOULOUSE Archive Ouverte (OATAO)
OATAO is an open access repository that collects the work of Toulouse researchers and
makes it freely available over the web where possible.
This is an author-deposited version published in :
http://oatao.univ-toulouse.fr/
Eprints ID : 17396
To link to this article : DOI : 10.1016/j.surfcoat.2016.06.098
URL :
http://dx.doi.org/10.1016/j.surfcoat.2016.06.098
To cite this version : Addou, Fouzi and Duguet, Thomas and Bosso,
Piera and Zhang, Anne and Amin-Chalhoub, Eliane and Fanelli,
Fiorenza and Vahlas, Constantin Metallization of carbon fiber
reinforced polymers: Chemical kinetics, adhesion, and properties.
(2016) Surface and Coatings Technology, vol. 308. pp. 62-69. ISSN
0257-8972
Any correspondence concerning this service should be sent to the repository
administrator:
[email protected]
Metallization of carbon fiber reinforced polymers: Chemical kinetics,
adhesion, and properties
Fouzi Addou
a,⁎
, Thomas Duguet
a, Piera Bosso
b, Anne Zhang
a, Eliane Amin-Chalhoub
a,
Fiorenza Fanelli
c, Constantin Vahlas
aaCIRIMAT, Université de Toulouse, CNRS-INPT-UPS, 4 allée Emile Monso, BP44362, 31030 Toulouse, France bDepartment of Chemistry, University of Bari “Aldo Moro”, via Orabona 4, 70126 Bari, Italy
cCNR-NANOTEC c/o Dipartimento di Chimica, Università degli Studi di Bari “Aldo Moro”, via Orabona 4, 70126 Bari, Italy
a b s t r a c t
In the present study, we investigate different surface pretreatments and their influence on a subsequent surface metallization. A direct liquid injection metalorganic CVD (DLI-MOCVD) process is presented for the low temper-ature metallization of composites, ultimately aiming at the surface functionalization of 3D parts. The process in-volves the organometallic precursor Cu(I) hexafluoroacetylacetonate 2-methyl-1-hexene-3-yne (hfac)Cu(MHY). We determine chemical kinetics of the global deposition reaction and show the improvement of the adhesion of the Cu films by applying surface pretreatments that etch and/or activate the surface before deposition. To this purpose, gas phase and wet chemical processes are used. Gas phase pretreatments consist either in the use of a remote microwave plasma, an in situ UV oxidation, or in the deposition of acrylic acid/ethylene plasma buffer layer by using an atmospheric pressure cold plasma jet. The liquid phase pretreatment is based on a commercial series of solutions that includes swelling, oxidation, and neutralization steps. The adhesive strength of the Cu films on poly-epoxy and on carbon fiber/poly-epoxy composite surfaces is specifically investigated by scratch and cross-cut testing, and is correlated with topographical, chemical, and energetic characteristics of the surfaces prior deposition, investigated by interferometry, X-ray photoelectron spectroscopy and wettability measure-ments through the sessile drop method. Pretreatmeasure-ments result in surface functionalization and topographical changes which significantly increase the surface energy and improve the wettability. In some cases the induced modification of the microstructure of the Cu films is found to be beneficial to the electrical resistivity. Keywords:
Epoxy/C fibers composite Metallization
Adherence MOCVD Cu
1. Introduction
Carbon Fiber Reinforced Polymers (CFRP) combine lightness and strength, high resistance to strain and abrasion and low thermal shrink-age/expansion which make them competitive with regard to aluminum or titanium alloys in some specific applications in the transportation field[1]. However, the loss of electrical conductivity due to the polymer matrix reduces its potential application. A method to improve the electrical conductivity of CFRP is to apply a conductive, most often me-tallic layer, on their surface. The principal methods developed for such surface metallization of composites are electroless or electrochemical deposition, chemical vapor deposition (CVD) and physical vapor deposition (PVD).
The present study focuses on the development of copper films on a poly-epoxy composite reinforced by C fibers, with direct liquid injection
metalorganic CVD (DLI-MOCVD) that combines tight control of the mass inflow rate of the gas mixture, high deposition rate and ability to coat complex 3D parts[2–5]. Specifications mentioned by potential end users include deposition of a film composed of a highly conductive, corrosion/oxidation resistant metal, several microns thick, with smooth surface morphology, and adherent to the composite substrate. These particular specifications are not necessarily compatible, since it is difficult to preserve high smoothness while promoting adhesion. Heat sensitivity of polymers yields additional constraints. In the present work, deposition temperatures (Td) do not exceed 200 °C unless explicitly mentioned.
The composites surfaces of the present work are exclusively terminated with poly-epoxy. Since the surface energy of poly-epoxy is rather low (20–40 mJ/m2) and non-polar[6], the adhesion with metals is intrinsically poor. Hence, modifications of the morphology and the reactivity of the surface are essential for the adhesion of copper on the polymer. They can be modified chemically and/or physically[7–26]. Physical modifications generate the formation of surface roughness favoring mechanical anchoring, where the geometry of the two parts
⁎ Corresponding author.
E-mail address:[email protected](F. Addou).
ensures the cohesion of the assembly[7–9,16,22,24–27]. Chemical modifications lead to adhesion between the metal and the substrate by bonds formation at the interface. Hence, the optimum combinations should correspond to the creation of covalent bonds and mechanical anchoring. A preliminary work consists in making an inventory of pre-treatments used to promote metal/polymer adhesion and to set up an experimental protocol adapted to our deposition technique and suitable for the low-roughness constraint. Only wet and dry physico-chemical processes are addressed since they can be applied to the geometry of the final parts, unlike mechanical treatments that require room and access to face all the part surface.
There exists numerous wet chemical treatments[8,9,14,16,18–21, 23,28–33]of polymeric surfaces for the improvement of the adhesion of copper. For instance, Siau et al. studied the influence of a chemical treatment on the roughness of a poly-epoxy polymer[31]and the cor-responding adhesion of Cu films. The first step consists in placing the substrates in a commercial swelling solution which forces the surface to exhibit polar groups[29–32]. Then the polar groups are oxidized by an alkaline solution to create roughness including the rupture of some polymer chains. The surface roughness of the polymer depends on dif-ferent parameters such as the temperature, the baths composition and the duration of the treatment. The roughness ranges between 100 and 500 nm RMS, which corresponds to the best range of roughness to optimize adhesion for their Cu/polymer system.
A different strategy is the use of an interlayer that is adherent on both the substrate and the Cu film. Such an approach has been investi-gated for several years by Schaubroeck et al.[9,18–21]. The authors grafted complex amine layers on polymers[9,14,15], followed by the deposition of a seed layer of Pd0which forms chemical bonds with the amino groups[33]and activates catalytically the electroless deposition of Cu. Their process temperature never exceeds 50 °C, i.e. below the Td used in DLI-MOCVD experiments. Neither adhesion tests nor tempera-ture resistance tests of the amine functions have been reported yet. In a previous work we did not observe improvement of adhesion of Cu films [26] and for this reason the use of complex amines (e.g. polydopamine [34–41]) as a buffer layer in deposition processes involving temperatures as high as 200 °C is questionable.
Wet processes imply dipping of porous composite parts into aque-ous solutions with a substantial absorption of water and chemical spe-cies. To the authors' experience absorbed species can sometimes be detrimental to vacuum deposition processes as they may prevent the adsorption of the precursor molecules or of the metal atoms. In this par-agraph, we introduce alternative ways to functionalize the surface based on the superficial oxidation of the composite by plasma expo-sures, either with a non-polymerizable gas such as argon, oxygen or ni-trogen, or with a polymerizable precursor. Oxygen plasmas are used to oxidize the surface by substituting hydrogen atoms of the polymer chains, leaving free radical species which react with residual oxygen and water. This functionalization by polar groups facilitates the chemi-sorption of easily oxidized species, such as metals [42]. Nitrogen plasmas are also used to form amine groups by dissociation of N2and re-active adsorption of atomic nitrogen on the surface. Alternatively, am-monia can be used as a nitrogen source. Charbonnier et al. obtained a better adhesion of Ni on polypropylene and polycarbonate with a laser-UV treatment in an ammonia than in a nitrogen atmosphere
[10]. The authors noticed that these pretreatments improve the polymer/metal adhesion without damaging the surface morphology. However, a prolonged plasma exposure time increases roughness up to detrimental conditions for adhesion[43]. The control and the optimi-zation of the pretreatment parameters are therefore essential to avoid damaging the polymer surface topology when the final roughness is a critical point. A different route proposed for the polymer/metal adhe-sion enhancement is the deposition of a thin film containing oxygenated polar groups, such as \\OH and\\COOH. Films obtained using acrylic acid (AA) as precursor were found to increase the peel strength for different metal/polymer interface[44,45].
The paper is organized as follows. First, we focus on the experimen-tal protocol and results involving the DLI-MOCVD deposition of copper on Si and poly-epoxy substrates. Then a detailed characterization of the physicochemical changes of the polymer surfaces induced by the pretreatments is presented, based on X-ray photoelectron spectroscopy (XPS), interferometry and contact-angle measurements. In addition, the effects of the pretreatments on the adhesion is investigated. Finally we report on the copper films morphology and resistivity and conclude with regards to the aimed application.
2. Experimental
Substrates are either Si(100) wafers (20 × 10 mm2), pure poly-epoxy coupons (20 × 10 mm2), or CFRP composite plates (40 × 20 mm2). They are all cleaned with acetone and ethanol, and dried in an Ar stream. With no further action, they are named untreated.
2.1. Pretreatments on poly-epoxy and CFRP substrates 2.1.1. AA/ethylene plasma layer
Poly-epoxy coupons are treated by reactive acrylic acid-containing plasma[46–48]in order to form a plasma-polymerized layer with a high surface density of polar groups, such as \\COOH and \\OH. The plasma feed mixture is composed of helium (flow rate of 7 slm), acrylic acid and ethylene. The deposition processes are performed using an atmospheric pressure plasma jet operated by setting the excitation fre-quency (sinusoidal signal) and the applied voltage at 20 kHz and 1.4 kVrms, respectively. The plasma jet and the deposition procedure are described in full detail in ref.[48]. Experimental parameters are shown inTable 1, where thickness is estimated from the deposition rate obtained on silicon substrate with a deposition time of 10 min (38 ± 4 and 43 ± 5 nm/min for the AA concentrations of 25 and 30 ppm, respectively).
Two batches of four different treatment conditions are performed, focused on the influence of the duration and the fraction of AA gas. As shown inFig. 4a of ref.[48], the COOR/COOH surface concentration -calculated from the decomposition of the C1s XPS peak on films deposited for 10 min - monotonously increases from 2 at.% to 9 at.% from 10 to 25 ppm of AA, respectively (ethylene feed remains constant at 200 ppm). In the present work, this trend is further confirmed at 30 ppm of AA, where the COOR/COOH percentage increases up to 13 at.%. Whereas the influence of thickness on films composition has not been checked, we note that the AA1 (76 nm-thick) surface compo-sition (shown inTable 2) is similar to the 10 min deposits of ref.[48]. An untreated substrate and a polished substrate (up to a 1 μm diamond polish) are taken as reference. The AA/ethylene plasma treatment is effective on a 1 cm diameter beam spot thereby limiting applicability of adhesion test techniques on these samples. Hence, only scratch tests are performed.
2.1.2. N2/O2remote plasma
A microwave (2,45 GHz, 90 W) solid state generator (Sairem) connected to a Surfatron plasma reactor (resonant cavity) is used to generate a discharge in the CVD reactor filled with nitrogen and oxygen gas at 400 sccm and 6 sccm, respectively, and maintained at 667 Pa. The
Table 1
Operating conditions used in the deposition of AA/ethylene plasma layer. Treatment AA (ppm) Ethylene (ppm) Duration (min) Estimated thickness (nm) AA1 25 200 2 76 ± 8 AA2 25 200 5 190 ± 20 AA3 30 200 2 86 ± 10 AA4 30 200 5 215 ± 25
distance from the tip of the glowing discharge to the substrates is 12 cm, allowing metastable N* and atomic N and O species to react with the samples surface. CFRP samples are exposed to the remote plasma for 30 min.
2.1.3. UV oxidation
UV oxidation (4 lamps, λ = 185–254 nm, P = 200 W, Heraeus Noblelight) is performed through the pyrex reactor for 1 h at a partial pressure of 4000 Pa of oxygen, in the presence of CFRP samples.
2.1.4. Alcaline oxidizing commercial series
A commercial pretreatment series (Circuposit™) is used in order to increase the roughness and functionalize the substrates by dipping cou-pons in successive aqueous solutions. This treatment consists of 3 suc-cessive baths containing the following solutions (Rohm and Haas): a swelling solution containing 60–80 vol.% 2-(2-butoxyethoxy)ethanol (Circuposit™ Hole Prep 3304), an alkaline oxidizing solution containing 45–65 g/L of KMnO4(Circuposit™ Promoter 3310/4140), and a neutral-izing solution containing 25–40 vol.% methanesulfonic acid (Circuposit™ Neutralizer 3319/4190). All baths are mechanically stirred. Substrates are placed in the first bath containing the swelling so-lution for 450 s at 80 °C, followed by a 2-stage cascade rinsing with dis-tilled water and dipping for 600 s at 80 °C in the second bath containing the oxidizing solution. After another 2-stage cascade rinsing, the sam-ples are immerged in the final neutralizing bath for 300 s at 50 °C, and rinsed before drying with Ar. It is worth noting that the Circuposit™ pretreatment is used in wet processes. Its implementation in a dry, vacuum metallization process such as the one developed in the present study is novel and is subjected to compatibility issues as this will be shown in the next paragraphs.
2.2. DLI-MOCVD of copper
DLI-MOCVD of Cu is performed in a horizontal cold wall reactor, described in[26]. Depositions are carried out from the organometallic precursor (hfac)Cu(I)(MHY) (Gigacopper®) where (hfac) is hexafluoroacetylacetonate and (MHY) is 2-methyl-1-hexen-3-yne. Samples are placed in the reactor chamber where they are heated up to the Td, at a total pressure of 667 Pa. The precursor is diluted in anhydrous octane (99.99%), at a concentration of 60 g/L, and injected into the reactor at a flow rate of 0.76 g·min− 1
. Copper films are deposited at surface temperatures between 150 and 245 °C at a working pressure of 667 Pa.
2.3. Characterization
Chemical modifications of the surface of the substrates are deter-mined by XPS on a Thermo Scientific K-Alpha instrument equipped with a monochromatized Al Kα source (1486.6 eV). A Shirley back-ground is systematically subtracted.
The sessile drop method is used for water contact angle measure-ments on a commercial apparatus (GBX Digidrop). The water droplet volume is 16 μL. Contact angles are measured 45 s after droplet deposi-tion, on eight different droplets for each sample. Average values and standard deviations are reported.
The deposition rate is determined from thickness measurements ob-tained by X-ray fluorescence (Oxford Instruments X-strata 920) cali-brated with an accuracy of ± 5% on infinite and thin film standards. Room temperature resistivity (ρ) of the Cu films is determined by the four-point probe technique (Signatone). Cross-sectional scanning elec-tron microscopy (SEM) observations are performed after focused ion beam (FIB) cutting, on a FEI HELIOS 600i-EDS microscope running at 5 keV in secondary electron mode. Surface roughness is determined on untreated, pretreated, and coated samples by optical interferometry (S Neox Sensofar) capable of measuring surface roughness (Ra) down to 0.1 nm and peak-to-valley heights of up to several mm.
Scratch test is performed with a CSM Revetest Instrument (standard EN 1071) using a diamond indenter with a cone angle of 120° and tip ra-dius of 200 μm at a constant loading rate of 15 N·min− 1. Since compos-ite samples show composcompos-ite hardness, scratch test is only performed on poly-epoxy coupons. Other films are evaluated by the crosscut test, conforming to the NF EN ISO 2409 norm. Perpendicular incisions (6 × 6) spaced by 2 mm form a grid on the film, on top of which the tape is applied. After 1 min, the tape is manually peeled at a constant rate and under a 60° angle.
3. Results and discussion
3.1. DLI-MOCVD of Cu
Fig. 1shows the Arrhenius plot of the experimental measurements of the growth rate on both Si and poly-epoxy untreated substrates. Since Si samples present a higher reactivity than poly-epoxy, they are used in order to confirm the limited influence of reactivity in the steady-state regime of deposition.
Two regions can be distinguished: a diffusion-limited regime (a plateau) and a surface-reaction limited regime at lower tempera-tures (linear Arrhenius plot). The transition temperatempera-tures between the two regimes are close, i.e. 200 °C on Si and 195 °C on poly-epoxy. At these temperatures, growth rate equals 28 nm/min and 39 nm/min, respectively.
The activation energy of the surface reaction can be deduced from the slope of the linear reaction-limited part of the plot. It equals 50 ± 4 kJ/mol on Si and 52 ± 6 kJ/mol on poly-epoxy. The nature of the sub-strate should not affect the deposition rate, though there is a slight shift between the two plots, here. However, Si exhibits a better reactivity than poly-epoxy, as demonstrated by the visual determination of the surface color change (as representative of the incubation time) which
Table 2
Composition in functional groups and O/C and N/C ratios from the C1s peak, only. C\\C/C\\H C\\N C\\O C_O/O\\C\\O O\\C_O O/C N/C Untreated 72.6 10.0 14.2 3.2 0 0.24 0.14 AA1 77.3 0 10.7 2.1 9.9 0.29 0 N2/O2remote plasma 59.3 10.2 16.4 8.0 6.0 0.51 0,17 UV 47.4 15.8 12.6 12.1 12.1 0.78 0.33 Circuposit™ 62.6 5.4 29.1 0 2.9 0.51 0.09
Fig. 1. Copper CVD growth rate on (a) Si and (b) poly-epoxy substrates as a function of the substrate temperature for a solution flow of 0.76 g/min.
is lower on Si (from 300 s at 155 °C to 35 s at 245 °C) than on poly-epoxy (from 350 s to 45 s).
Additionally, we observe that the growth rate is proportional to the pure precursor inflow rate. Chen et al.[49]have already shown that dou-bling the pure precursor flow rate from 0.23 g/min to 0.46 g/min doubles the growth rate without affecting drastically the slope of the reaction-limited regime (27 kJ/mol and 30 kJ/mol respectively). Our results con-firm such a proportional relationship between the pure precursor flow rate and the maximum growth rate value established in the diffusion-limited regime. Indeed, in our experiments, 0.06 g/min of pure precursor is injected for a maximum growth rate of 30 to 45 nm/min against ap-proximately 140 nm/min at 0.23 g/min and 280 nm/min at 0.46 g/min in[45]. It is worth noting that the dilution of the precursor results in a significant increase of the activation energy of the process in the surface-reaction limited regime from ca. 27 kJ/mol to 50 kJ/mol. We sup-pose that octane prevents the efficient adsorption or decomposition of (hfac)Cu(I)(MHY) molecules. This effect is lessened with the increase of Td.
The optimal deposition temperature for a maximum growth rate and a correct conformality is found close to the intersection of the two deposition regimes, that is at Td= 195 °C.Fig. 2shows a FIB cross-sectional SEM image of a representative Cu film obtained at this temper-ature. To minimize the curtain effect (presence of striations in the milled cross-section) a Pt film is deposited on Cu before FIB cutting. The Cu film is dense and its thickness is uniform (1.6 μm). Some pores are visible at the interface and between some large oriented grains. Over 18 measure-ments on 18 different samples, the average resistivity of the Cu films equals 4.1 ± 0.7 μΩ·cm.
The process is well controlled but the adhesion of Cu coatings is poor, highlighting the need for surface pretreatments. Therefore, next sections will illustrate our efforts in this task and discuss the pros and cons of a selection of pretreatments.
3.2. Surface composition after pretreatment
The untreated composite surface contains carbon, nitrogen and oxy-gen. The investigated pretreatments of the present study seldom result in uncovering the C fibers. Therefore, since XPS only probes a few tens of angstroms in depth, the major contribution to the signal comes from the sole poly-epoxy. Our poly-epoxy is composed of the tetra-functional resin tetraglycidyl methylene dianiline (TGMDA) (Fig. 3) and of the two hardeners 4,4′-methylenebis(2,6-diethylaniline) (MDEA) (Fig. 3a) and 4,4′-methyylenebis(2-isopropyl-6-methylaniline) (M-MIPA) (Fig. 3b). TGMDA contains four epoxy groups for four protons in the amines groups of the hardeners. Therefore, the stoichiometric composi-tion in funccomposi-tionalities results in 1 TGMDA for 1 (MDEA + M-MIPA) molecules.
Consecutively –and assuming that the surface and the bulk of the poly-epoxy have the same composition– it is possible to roughly
estimate that the surface is composed of 47 C atoms, 4 N atoms and 4 O atoms, corresponding to 85.4 at.% C, 7.3 at.% N, and 7.3 at.% O, and to subsequent O/C and N/C ratios equal 0.085. The surface composition of
untreated samples obtained by XPS is 78.9 at.% C, 14.6 at.% O, and
6.5 at.% N. This result is close to the theoretical one, taking into account a mild oxidation and carbon contamination of the samples when ex-posed to ambient pressure and temperature.
Table 2presents the C1s peak decomposition results with the com-position in functional groups identified by the chemical shifts of the components with C atoms in different environments. The reported O/C and N/C ratios are directly derived from this decomposition by di-viding the oxygenated and nitrogenized groups' fraction by the C\\C, C\\H fraction. Atomic composition are not used for O/C and N/C ratios calculations because we observed a significant amount of SiOx contam-ination occurring during the polymerization process in the presence of the demolding agent.
Fig. 4shows the C1s core-level XPS spectra obtained on the surface of the untreated sample (Fig. 4a) and the corresponding surfaces of a sample treated with AA1 process (Fig. 4b), N2/O2 remote plasma
(Fig. 4c), UV (Fig. 4d) and Circuposit™ (Fig. 4e). The untreated sample is taken as the reference for the determination of the C\\C, C\\H peak binding energy and for the chemical shifts with the other components (C\\N at +1.0 eV, C\\O at +1.6 eV, C = O/O\\C\\O at +3 eV). The O\\C_O contribution and the shake-up satellite are fitted to the experiments.
The XPS C1s spectrum obtained after the AA1 process (Fig. 4b) clearly indicates the presence of different oxygenated functional groups. The binding energy of the carboxylic component (289.1 ± 0.3 eV) is compa-rable to the values reported in the literature for films deposited from acrylic acid-containing plasmas[50]. Since the thickness of the film is higher than the XPS sampling depth, the C\\C/C\\H component in
Fig. 4b is ascribable to the functional groups present in the AA1 depos-ited layer and not to the substrate surface. Additionally, the AA/ethylene plasma layer ageing with temperature has been tested at 200 °C for 45 min, in order to ensure that it does not degrade during Cu deposi-tion. XPS remains unchanged, validating this potential pretreatment. The O/C ratio is close to the untreated initial surface but the composi-tion in funccomposi-tional groups differs essentially by the presence of about 10% of carboxylic (COOH or COOR) groups over the total C1s group contributions.
The N2/O2remote plasma and UV pretreated surfaces exhibit similar
C1s peak shapes, with the presence of C\\C/C\\H, C\\N, C\\O, C_O, and O\\C_O groups. The O/C and N/C ratios are higher in the UV case, whereas we would expect that N species fraction would be higher in the N2/O2remote plasma pretreatment.
Finally, we observe a remarkable difference in the C1s peak of the
Circuposit™ pretreated surfaces. The groups with double-bonded O
re-main very low, in contrast with the large increase of the C\\O contribu-tion (29%): at least twice higher than C\\O in the other cases (10.7– 16.4%).
3.3. Roughness after pretreatment
The pretreatments affect the topography of the substrates.Fig. 5
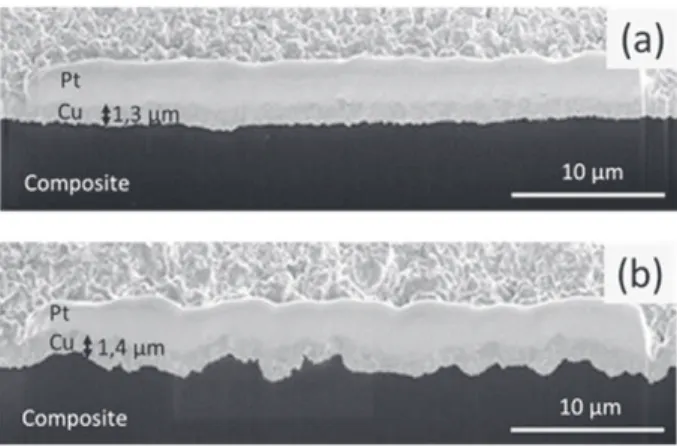
shows a selection of cross-section SEM images where the UV treatment is compared to the untreated reference. Whereas some roughness is already present on the untreated samples (Fig. 5a), it is dramatically in-creased by the UV treatment (Fig. 5b), showing that the oxidation actively etches the poly-epoxy surface.
Surface roughness can enhance adhesion strength of the films, but it must remain limited with regard to the final film roughness. Thus, it is essential to characterize the roughness induced by the different pre-treatments. The arithmetic roughness (Sa) determined on an area of 3 mm2is presented inTable 3, inSection 4. Since roughness depends on the surface area on which it is determined, it is difficult to give a threshold at which a given specification is met. Nevertheless, it is
interesting to note relative differences. On 3 mm2, the composite rough-ness is mainly due to the carbon fibers that add to the much lower roughness of the poly-epoxy. It is illustrated by the much lower rough-ness of the poly-epoxy substrates with the AA/ethylene plasma layer. The N2/O2remote plasma treatments does not add much roughness to
the substrate, unlike the UV and Circuposit™ treatments that clearly de-grade the polymer surface. This effect is beneficial for the mechanical anchoring to a certain extent. For instance, in most cases the Circuposit™ treatment leads to deteriorating the composite and exposes fibers to the air.
3.4. Influence of pretreatments on the wettability
Surface modifications induced by the pretreatments are compared by water contact angle measurements. Such characterizations are used to establish qualitative trends of the evolution of the wettability of the surfaces by metals. Water, as a polar liquid, strongly interacts with polar groups containing surfaces. The analogy is then possible with metals since it is expected that metals enabling oxidation degrees will also interact with polar bonds. Considering that surface roughness enhances intrinsic hydrophobicity or hydrophilicity, a mean value of the measurement is considered hereafter.Table 3shows the water contact angle values of the untreated and treated samples with the corresponding arithmetic roughness (Sa) determined by interferome-try, and the O/C ratio determined by XPS. Sa is reported here but not discussed in relationship with wettability because we cannot ensure that the surface area on which it has been determined is close to the triple point area.
The contact angle of water on untreated samples is approximately 88°. This is characteristic of a hydrophobic surface. It can be decreased if polar groups are present in sufficient concentration at the surface. All the pretreatments result in a large decrease of the contact angle, in good conjunction with the creation of polar bonds observed in XPS. The AA1 plasma layer shows an intermediate wettability and an inter-mediate O/C ratio. On the other hand, wettability of the 3 last pretreat-ments is comparable whereas one could have expected an even lower contact angle for the UV pretreatment exhibiting an O/C ratio of 0.78. The complex interplay between the O/C ratio and the surface rough-ness does not allow comprehensive discussion of the observed phe-nomena based on the limited dataset available. This work will be complemented by wettability measurements by other liquids in a next future.
3.5. Influence of the pretreatments on Cu adhesion 3.5.1. Scratch test
Considering the small area treated by the AA/ethylene plasma (1 cm2), it is not possible to apply the crosscut test on these samples. Al-ternatively, we use scratch testing – which is a localized analysis – to as-sess the adhesion of Cu films after this pretreatment. Scratch lengths are 4.2 mm long, and scratch load is ramped from 1 N to 20 N. A careful mi-croscopy examination is performed in order to observe failures and de-termine the critical load (Lc)[51].Fig. 6shows a typical analysis performed on a montage of several optical micrographs, after scratching a Cu film on a AA1 sample. One can notice the presence of circular de-fects. A thorough check on fresh substrates shows that the raw surface obtained by molding already exhibits these defects. Therefore, they are neither due to the pretreatment, nor due to the MOCVD processing. When the diamond tip encounters these defects, parasitic delamination occurs that we ignore for the determination of Lc values.
We observe the buckle failure mode (zoomed in areas inFig. 6) which results in a partial detachment of the film at regular intervals in front of the indenter. This failure mode is always observed during the present scratch tests on poly-epoxy coated by Cu. Buckling is qualified as an adhesive mode which results from compressive stress field gener-ated by the advance of the indenter[52]. Under compressive stress, the film is separated from the substrate by cracking and lifting followed by full delamination. We define the critical load Lc as the load when the copper film is delaminated along the entire width of the stripe. Addi-tionally, we use references of Cu films deposited in the same batch on an untreated substrate and on a polished substrate (up to a 1 μm dia-mond finishing). The latter allows the scratching of a coating deposited on a defect-free surface with a controlled roughness, and inhibits the parasitic delamination induced by the circular surface defects. A sum-mary of the different Lc values is shown inTable 4.
On the untreated sample and on AA1 pretreated samples a “gross spallation” failure mode is observed as soon as the tip indents the coat-ing, yielding a large detached flake which is common in coatings with very low interfacial adhesion strength. Visual observations of these
AA/ethylene plasma treated samples during and after Cu deposition
had already indicated these results. Indeed, nucleation delay of Cu is long, exceeding 45 min, and observation of the as processed films re-veals inhomogeneous, nonmetallic aspect. This result can be correlated with the low O/C ratio and the limited decrease of the contact angle with water. But, we have once incidentally increased Tdto ca. 220 °C during the first 5 min (samples AA T overshoot) which resulted in
significant increase of the Lc values: between 8.5 and 16 N in the differ-ent conditions AA1 to AA4. On the non-pretreated regions of the same samples Lc is much lower (4 N). It is worth noting that for polished and untreated samples, the obtained Lc values are the same, indepen-dently of the surface region. It suggests that the strong interface has been formed where the initial AA/ethylene plasma layer lied, and thus that the temperature overshoot could be responsible for it. Further in-vestigations will be carried out to clarify the effect of the temperature overshoot on the interlayer performance.
Finally, the critical load is not observed on the polished sample in the range 1–15 N. Films and substrate deform plastically but never separate. This behavior can be explained by the roughness generated during polishing, creating mechanical anchoring at the Cu/poly-epoxy interface.
3.5.2. Crosscut test
The results of adhesion testing using the cross-cut test on a surface of 20 × 10 mm2
, of 1 μm-thick Cu films on composite are reported in
Table 5. We refer to the classification of NF EN ISO 2409 to assess the ad-hesion of the different Cu films. The corresponding scale ranges from class 0 to class 5 from the strongest to the weakest adhesion, respectively.
Those results clearly show a poor adhesion with Cu flaking on more 65% of the surface area for the untreated and the N2/O2remote plasma
treated samples. The Circuposit™ pretreated sample exhibits a good ad-hesion (class 1) characterized by the detachment of some flakes at the intersections of incisions: b5% of the surface area is affected. The cross-cut test after UV pretreatment shows perfectly smooth incisions edges with no detachment (class 0). Therefore, the UV pretreatment provides the best adhesion performance of the series. Even if the N2/O2remote
plasma treatment creates oxygen groups on the composite substrates,
as UV and Circuposit™ treatments, the adhesion test gives unsatisfactory results. The difference with the UV and Circuposit™ treatments is the creation of substrate roughness which is a crucial parameter to enhance adhesion, as it was shown before with scratch testing of the polished poly-epoxy sample. In our conditions, the substrate topography seems to be preponderant for the adhesion. Unfortunately, we cannot test the AA T overshoot batch, because of the small sample size.
3.6. Cu films properties: roughness and electrical resistivity
Damages and growth modes induced by the pretreatments affect the final Cu film morphology and roughness. For a given composition, the electrical resistivity is a direct consequence of the microstructure –and by extension of the roughness– because of the electron scattering at de-fects and grain boundaries. The arithmetic roughness (Sa) and the elec-trical resistivity (ρ) of the Cu films with and without pretreatment are presented inTable 6.
By difference with the initial surfaces roughness (seeTable 3), we observe that the Cu films increase the surface roughness by 1.1 μm on the untreated samples, 0.3–0.5 μm on the untreated poly-epoxy samples, 1.0 μm on the N2/O2remote plasma samples, 0.2 μm on the UV samples,
and 0.7 μm on the Circuposit™ samples. It is interesting to note that the difference is largely reduced on UV and Circuposit™ samples, that is the two pretreatments with the best results in terms of reactivity (wettabil-ity), and adhesion strength. Therefore, we assume that the moderate in-crease of surface roughness is due to a homogeneously and/or densely distributed nucleation of Cu on these surfaces, which limits the develop-ment of rough microstructures during growth.
Anyway, there is a common feature for all the Cu films: the growth rate is always higher on the surface regions that are close to underlying C fibers. It seems that the heterogeneity of the composite induces a tem-perature gradient on the surface. The thermal conductivity of the fibers
Fig. 4. Normalized XPS C1s core-level spectra of the poly-epoxy substrate (a) untreated, (b) AA1, (c) N2/O2remote plasma, (d) UV, (e) Circuposit™ pretreated.
is better than the poly-epoxy so there are hot points which might in-crease the growth rate during the DLI-MOCVD process. This behavior is then detrimental to the total roughness.
The resistivity measured on Cu films is higher than that of bulk Cu (1.7 μΩ·cm), but it remains acceptable (except Circuposit™) for thin films where defects density is high. To the contrary, the resistivity of the Circuposit™ sample is so high that it cannot be discussed in terms of microstructure only. A thorough check of the Circuposit™ surfaces and subsequent Cu coatings by XPS (not shown), confirms the presence of contaminants coming from the different aqueous solutions. It appears that this pretreatment is not compatible with vacuum dry deposition techniques.
In conclusion, the UV treated sample presents a good resistivity value associated with the most reasonable compromise between a slight roughness increases and a high interfacial adhesion.
4. Conclusions
DLI-MOCVD of Cu films from (hfac)Cu(I)(MHY) (Gigacopper®) di-luted in octane has been investigated for the metallization of CFRP and poly-epoxy surfaces. A clear distinction between surface kinetics and diffusion limited regimes is observed at 195 °C from the Arrhenius plot of the process. At this temperature, growth rate is 38 nm/min for 0.76 g/min feeding rate of a 60 g/L solution. Growth rate is proportional to the feeding rate of the precursor. The activation energy in the surface
reaction-limited domain is 50 kJ/mol; i.e. almost double than the one obtained when injecting pure precursor. This difference might be in-duced by octane which limits the adsorption or the decomposition of (hfac)Cu(I)(MHY) molecules or to our reactor geometry. Polycrystalline Cu films are obtained with uniform thickness along the 40 × 20 mm2 substrate surfaces. They are dense, however they present some pores at the interface and between some large grains. Their electrical resistiv-ity is approximately 4 μΩ·cm but can be drastically affected by micro-structure and purity. The adhesion of Cu films on the substrates is poor, corresponding to class 5 of a crosscut test performed according to the NF EN ISO 2409 standard.
Four surface pretreatments of the samples are tested in order to im-prove the adhesion, namely (i) an atmospheric plasma treatment from a gas mixture of acrylic acid, ethylene, and He, (ii) an in situ remote N2/O2 plasma, (iii) an in situ UV oxidation treatment, and (iv) a commercial series of alkaline oxidizing solution treatments, Circuposit™. XPS measurements show that all pretreatments result in a chemical functionalization of the poly-epoxy surface with oxygenated groups. Consecutively, the surface polarity increases and all the pretreatments are effective in improving the wettability of the substrate by water. On the other hand, the surface roughness does not change significantly with the AA/ethylene plasma and N2/O2remote plasma treatments, whereas it strongly increases after the UV and Circuposit™ treatments. Finally, these two pretreatments exhibit the best performance in adhe-sion testing, emphasizing the greater impact of mechanical interlocking than chemical bonding on the total adherence. The experimental results provide evidence that a good wettability is a necessary but not sufficient condition for good adhesion. In the present work, the UV pretreatment is better than Circuposit™, because the latter has not been originally de-signed for dry, vacuum deposition techniques where any contamination is very detrimental to the film and to the interface quality. With the UV pretreatment, the millimetric surface roughness is low (2.8 μm over a surface area of 3 mm2), and the resistivity is 4.3 μ Ω·cm. With an optimized procedure, we are confident that we will be able to obtain an adherent high-quality copper coating on CFRP.
Fig. 5. SEM cross sectional micrograph of Cu on (a) untreated and (b) UV treated composite.
Table 3
Water contact angle and surface arithmetic roughness (Sa) vs. pretreatments. Sample Water contact angle (°) Sa (μm) O/C ratio Untreated 88 ± 6 1.3 0.24 AA/ethylene plasma 67 ± 4 0.2 0.29 N2/O2remote plasma 53 ± 5 1.6 0.51
UV 57 ± 2 2.6 0.78
Circuposit™ 55 ± 4 3.3 0.51
Fig. 6. Optical microscopy of scratched groove of Cu film on a AA1 treated poly-epoxy sample.
Table 4
Critical load determined after scratch testing for each pretreatment. Sample Average Lc (N) Untreated b1 Polished N15 AA1–4 T overshoot 8.5–16.0 AA1 b1 Table 5
Cross-cut class vs. pretreatment.
Sample Class Untreated 5 N2/O2remote plasma 5 UV 0 Circuposit™ 1 Table 6
Copper films properties vs pretreatments.
Sample Sa (μm) ΔSa ρ (μΩ·cm) Untreated 2.4 1.1 3.2 Untreated poly-epoxy 0.5 0.3 3.1 AA1 0.7 0.5 3.6 N2/O2remote plasma 2.6 1.0 3.3 UV 2.8 0.2 4.3 Circuposit™ 4.0 0.7 28.5
Acknowledgements
The Conseil Régional Midi-Pyrénées (contract no. 13052909) and the Agence Nationale de la Recherche (LabCom no. ANR-14-LAB3-0010-01) are acknowledged for financial support. We are indebted to J. Esvan for XPS measurements, to C. Josse (UMS Castaing) for FIB prep-arations and SEM observations, and to C. Neata for contact angle measurements.
References
[1] M. Beck, Compos. Manuf. (2014) 15–17 (Nov/Dec).
[2] G. Boisselier, F. Maury, F. Schuster, Surf. Coat. Technol. 215 (2013) 152–160. [3] G.S. Czok, J. Werther, Powder Technol. 162 (2006) 100–110.
[4] A.-L. Thomann, C. Vahlas, Chem. Vap. Depos. 17 (2011) 274–278.
[5] C. Vahlas, B. Caussat, W.L. Gladfelter, F. Senocq, E.J. Gladfelter, Recent Pat. Mater. Sci. 8 (2015) 91–108.
[6] J.W. Gooch, Encyclopedic Dictionary of Polymers, Springer-Verlag, New York, 2011. [7] J. Ge, M.P.K. Turunen, J.K. Kivilahti, Thin Solid Films 440 (2003) 198–207. [8] J. Ge, M.P.K. Turunen, M. Kusevic, J.K. Kivilahti, J. Mater. Res. 18 (2003) 2697–2707. [9] D. Schaubroeck, J. De Baets, T. Desmet, S. Van Vlierberghe, E. Schacht, A. Van Calster,
Appl. Surf. Sci. 255 (2009) 8780–8787.
[10] M. Charbonnier, M. Romand, Int. J. Adhes. Adhes. 23 (2003) 277–285.
[11]J.P. Coyle, G. Dey, E.R. Sirianni, M.L. Kemell, G.P.A. Yap, M. Ritala, M. Leskela, S.D. Elliott, S.T. Barry, Chem. Mater. 25 (2013) 1132–1138.
[12] L.Z. Di, B. Liu, J.J. Song, D. Shan, D.A. Yang, Appl. Surf. Sci. 257 (2011) 4272–4277. [13] J.J. Eisch, J. Laskowski, J. Bielinski, M.P. Boleslawski, J. Mater. Sci. Lett. 14 (1995)
146–147.
[14]L.M. Hamming, X.W. Fan, P.B. Messersmith, L.C. Brinson, Compos. Sci. Technol. 68 (2008) 2042–2048.
[15] H. Lee, S.M. Dellatore, W.M. Miller, P.B. Messersmith, Science 318 (2007) 426–430. [16] N. Li, X.L. Yuan, Z.X. Li, Z.L. Wang, J. Adhes. Sci. Technol. 26 (2012) 1407–1417. [17] V. Prysiazhnyi, M. Stupavská, J. Ráheľ, C. Kleber, M. Černák, L.D. Rafailović, Surf. Coat.
Technol. 258 (2014) 1082–1089.
[18]D. Schaubroeck, J. De Baets, T. Desmet, P. Dubruel, E. Schacht, L. Van Vaeck, A. Van Calster, Appl. Surf. Sci. 256 (2010) 6269–6278.
[19] D. Schaubroeck, L. Mader, N. De Geyter, R. Morent, P. Dubruel, J. Vanfleteren, Appl. Surf. Sci. 305 (2014) 321–329.
[20]D. Schaubroeck, E. Van Den Eeckhout, J. De Baets, P. Dubruel, L. Van Vaeck, A. Van Calster, J. Adhes. Sci. Technol. 26 (2012) 2301–2314.
[21] D. Schaubroeck, Y. Vercammen, L. Van Vaeck, E. Vanderleyden, P. Dubruel, J. Vanfleteren, Appl. Surf. Sci. 303 (2014) 465–472.
[22] S. Siau, A. Vervaet, E. Schacht, A. Van Calster, J. Electrochem. Soc. 151 (2004) C133–C141.
[23] H.Y. Lee, J. Yu, Mater. Sci. Eng., A 277 (2000) 154–160.
[24] J.F. Coulon, N. Tournerie, H. Maillard, Appl. Surf. Sci. 283 (2013) 843–850. [25] E. Njuhovic, A. Witt, M. Kempf, F. Wolff-Fabris, S. Glode, V. Altstadt, Surf. Coat.
Technol. 232 (2013) 319–325.
[26] T. Duguet, F. Senocq, L. Laffont, C. Vahlas, Surf. Coat. Technol. 230 (2013) 254–259. [27] C. von Bechtolsheim, V. Zaporojtchenko, F. Faupel, Appl. Surf. Sci. 151 (1999)
119–128.
[28] H. Lee, J. Rho, P.B. Messersmith, Adv. Mater. 21 (2009) 431–434.
[29]S. Siau, A. Vervaet, S. Nalines, E. Schacht, A. Van Calster, J. Electrochem. Soc. 151 (2004) C831–C849.
[30]S. Siau, A. Vervaet, S. Nalines, E. Schacht, A. Van Calster, J. Electrochem. Soc. 151 (2004) C816–C830.
[31] S. Siau, A. Vervaet, A. Van Calster, I. Swennen, E. Schacht, Appl. Surf. Sci. 237 (2004) 456–461.
[32] S. Siau, A. Vervaet, L. Van Vaeck, E. Schacht, U. Demeter, A. Van Calster, J. Electrochem. Soc. 152 (2005) C442–C455.
[33] Z.J. Yu, E.T. Kang, K.G. Neoh, Polymer 43 (2002) 4137–4146.
[34] D. Bratton, D. Yang, J. Dai, C.K. Ober, Polym. Adv. Technol. 17 (2006) 94–103. [35] K.-i. Fukukawa, Y. Shibasaki, M. Ueda, Polym. Adv. Technol. 17 (2006) 131–136. [36]T. Hirayama, D. Shiono, J. Onodera, A. Yamaguchi, H. Fukuda, Polym. Adv. Technol.
17 (2006) 116–121.
[37] H. Ito, H.D. Truong, R.D. Allen, W. Li, P.R. Varanasi, K.J. Chen, M. Khojasteh, W.S. Huang, S.D. Burns, D. Pfeiffer, Polym. Adv. Technol. 17 (2006) 104–115. [38] S. Kusumoto, M. Shima, Y. Wang, T. Shimokawa, H. Sato, K. Hieda, Polym. Adv.
Technol. 17 (2006) 122–130.
[39] K.-S. Lee, D.-Y. Yang, S.H. Park, R.H. Kim, Polym. Adv. Technol. 17 (2006) 72–82. [40] J.H. Moon, J. Ford, S. Yang, Polym. Adv. Technol. 17 (2006) 83–93.
[41] C. Ober, M. Ueda, Polym. Adv. Technol. 17 (2006) 71. [42] C. Weiss, H. Muenstedt, J. Adhes. 78 (2002) 507–519.
[43] S. Vidal, F. Maury, A. Gleizes, C. Mijoule, Appl. Surf. Sci. 168 (2000) 57–60. [44] K.S. Kim, W.R. Myung, S.B. Jung, J. Adhes. 88 (2012) 337–349.
[45] M. Okubo, M. Tahara, T. Kuroki, T. Hibimo, N. Saeki, J. Photopolym. Sci. Technol. 21 (2008) 219–224.
[46]D.L. Cho, P.M. Claesson, C.G. Golander, K. Johansson, J. Appl. Polym. Sci. 41 (1990) 1373–1390.
[47] J.G.A. Terlingen, A.S. Hoffman, J. Feijen, J. Appl. Polym. Sci. 50 (1993) 1529–1539. [48] P. Bosso, F. Fanelli, F. Fracassi, Plasma Process. Polym. 13 (2016) 217–226. [49] T.Y. Chen, J. Vaissermann, E. Ruiz, J.P. Senateur, P. Doppelt, Chem. Mater. 13 (2001)
3993–4004.
[50] L. Detomaso, R. Gristina, G.S. Senesi, R. d'Agostino, P. Favia, Biomaterials 26 (2005) 3831–3841.
[51] S.J. Bull, Surf. Coat. Technol. 50 (1991) 25–32. [52] S.J. Bull, Tribol. Int. 30 (1997) 491–498.