OATAO is an open access repository that collects the work of Toulouse
researchers and makes it freely available over the web where possible
Any correspondence concerning this service should be sent
to the repository administrator:
[email protected]
This is an author’s version published in:
http://oatao.univ-toulouse.fr/21410
To cite this version:
Sanviemvongsak, Tom
and Monceau, Daniel
and Macquaire, Bruno High
temperature oxidation of IN 718 manufactured by laser beam melting and
electron beam melting: Effect of surface topography. (2018) Corrosion Science,
141. 127-145. ISSN 0010-938X
High temperature oxidation of IN 718 manufactured by laser beam melting
and electron beam melting: Effect of surface topography
Tom Sanviemvongsak
a,b,⁎, Daniel Monceau
a, Bruno Macquaire
baCIRIMAT, Université de Toulouse, CNRS, INPT, ENSIACET, 4 allée Emile Monso, BP 44362, 31 030 Toulouse Cedex 4, France bSafran Paris-Saclay, Safran Tech, Rue des Jeunes Bois, Châteaufort, CS 80112, 78772 Magny-Les-Hameaux, France
A R T I C L E I N F O
Keywords: Superalloys Laser beam melting Electron beam melting High temperature oxidation Roughness
A B S T R A C T
The oxidation behaviour of IN 718 alloys produced by laser beam melting and electron beam melting was compared to that of the wrought alloy at 850 °C in laboratory air. Oxide scales of all alloys were similar in nature and morphology with small differences due to powder particles sintered on the surface of additive manufacturing parts. Nevertheless, major differences in surface topography were noticed, these could affect surface area esti-mations and consequentlymass gain estiesti-mations. A quantitative correlation was determined between apparent parabolic rate constant and surface area.
1. Introduction
Recent progress in the field of additive manufacturing (AM) has led to the development of “3D printed” metallic alloys and ceramics parts. The microstructure of materials produced using these new manu-facturing methods is different from those made using traditional methods. The aerospace industry and aircraft manufacturers seek to control AM processes in order to optimize the “buy-to-fly” ratio by lowering production costs and material loss during manufacturing while improving component functional design [1,2]. The Powder Bed Fusion (PBF) process is the AM method mainly used for metals. It consists in melting a powder bed and fusing it layer by layer, using either a laser beam – Laser Beam Melting (LBM) otherwise known as Selective Laser Melting (SLM) – or an electron beam – Electron Beam Melting (EBM). The microstructure of materials produced in this way is oriented following their build direction. As a result AM materials have anisotropic properties [3,4].
There have been recent attempts to produce parts of aircraft gas turbines by AM. But real gas turbine environment involves complex and aggressive mixed reactants that can lead to high temperature corrosion [5,6]. Before studying high temperature corrosion of AM parts, it is essential to characterize their high temperature oxidation behaviour in air since the first protection of the alloy from hot corrosion is the oxide scale formed onto its surface.
1.1. Microstructure of IN 718 alloys produced by additive manufacturing The 718 alloy or IN 7181(NiCr19Fe19Nb5Mo3 – UNS N07718) is a
solution annealed and precipitation hardened Ni-base superalloy [7]. This material is extensively used in aeronautical applications for its mechanical properties and structural stability at temperatures as high as 650 °C [8]. It was developed to resist creep, fatigue and, to a lesser extent high temperature oxidation [9]. This Ni-base superalloy is composed of austenitic matrix γ (Ni) phase, a disordered face-centered cubic crystal structure (A1, a = 0.3616 nm) [10], which gives to this alloy good mechanical strength. The solid solution strengthening of the matrix is induced by insertion of chromium and molybdenum. Com-posed of around 19 wt.% of chromium, the 718 alloy is a chromia scale former and therefore presents good oxidation resistance [11]. Fur-thermore, homogeneous precipitation hardening mechanisms are in-duced by the addition of alloy elements such as aluminium, titanium and niobium [12]. These elements lead to the precipitation of two metastable intermetallic strengthening phases, composed of a large amount of niobium. Their precipitation occurs between 600 °C and 900 °C. The phase mainly responsible for the alloy’s strengthening is γ’’ (Ni3Nb) [10], which has a fine oblate spheroid form [13,14]. The
second one, is the metastable γ’ (Ni3(Al, Ti, Nb)) phase [10], which has
a cuboidal or spherical form. After optimal heat treatment, the volume fraction of these two phases is 15–17 vol.% [15], the volume fraction of γ’’ being three to four times larger than that of γ’ [16]. After an ageing or a heat treatment, between 650 °C and 950 °C, δ-Ni3Nb phases, the
⁎Corresponding author.
E-mail address:[email protected](T. Sanviemvongsak).
1IN 718 stands for INCONEL 718, designated alloy trademark of Special Metal Corporation.
[28,30,35]. Rao et al. [40] found that HIP followed by AMS 5662 H T had a beneficial effect on the mechanical properties of AM-produced 718 alloys. This method results in significant grain growth, dissolves δ-Ni3Nb precipitates and increases the material’s ductility and yield
strength.
1.2. High temperature oxidation of the IN 718 alloy
The IN 718 superalloy was designed for its mechanical strength at high temperature but also to form a protective chromia scale (Cr2O3) by
selective oxidation of chromium (around 19 wt.%) when exposed to air at high temperature. The oxide layer growth is then controlled by slow diffusion of chromium cation through the oxide scale reaching the oxide/gas interface and/or by inward diffusion oxygen anions thereby reacting with chromium at the metal/oxide interface or with alumi-nium or titaalumi-nium deeper in the alloy [6]. The formation of this chromia layer offers a good protection up to 950 °C under 105Pa of air pressure.
At higher temperatures, its growth rate becomes to be quite high and metal consumption is accelerated by the effect of sublimation of Cr2O3(s) into CrO3(g) or Cr-hydroxides CrO2(OH)2(g) [41]. Sublimation
kinetics increases with temperature but also with the oxygen and water pressure present in the gas. In the case of turbine engines may be en-hanced, thereby leading to early degradation. In aircraft applications, this material is commonly employed at operating temperatures below 650 °C [8]. During air oxidation between 700 °C and 950 °C [42,43], transient oxidation occurred during the first 24 h of the experiment, followed by slow oxidation kinetic during steady state. Between 900 °C and 1300 °C [42], oxidation kinetics have been shown to follow a parabolic rate dependence, ranging from 6.3 × 10⁻⁶mg². cm-4.s-1 to
2.4 × 10⁻³ mg². cm-4.s-1. Above 1270 °C, the oxidation became
cata-strophic, the oxide layer can be spalled easily. At temperature above 1300 °C, the material was rapidly consumed [42]. Furthermore, looking at oxidation layer composition, small amounts of TiO2, MnCr2O4spinel
[43], and CrNbO4[44] were found during the early stages of the 900 °C
air oxidation test. Those elements appeared before the establishment of a continuous chromia scale due to rapid diffusion of Ti, Mn, and Nb in the matrix. After the transient stage, a continuous intermetallic Ni3
Nb-rich scale was found under the chromia scale that might act as a chromium diffusion barrier slowing down the oxidation rate [43,44]. Moreover, Al2O3intergranular oxidation was found in the 718 alloy
[43].
In the literature, there are as yet few studies on the characterization of high temperature oxidation of the AM-produced IN 718 alloys, namely by Unocic et al. [35] and Jia and Gu [45]. Jia and Gu studied the oxidation behaviour of an as-built IN 718 alloy made by LBM, and oxidized at 850 °C for 100 h. They showed oxidation kinetics close to a parabolic growth. The oxide layer was composed of two different oxides: mainly Cr2O3 and small quantities of spinel NiCr2O4 and
NiFe2O4. Moreover, intergranular oxidation was found in the material.
The penetration depth of the intergranular oxidation reached 50 μm and decreased with higher material density [45]. However, by com-paring AM oxidation kinetics to that of the heat-treated wrought 718 alloy [42], results show that the oxidation kinetics of the as-built LBM 718 alloy studied by these authors is much higher, even for the densest samples. If this happens to be a general finding, the use of these ma-terials. In the second work, performed at Oak Ridge National Labora-tory [35], experiences were conducted in wet air at 650 °C, 700 °C and 750 °C on the EBM-produced 718 alloys, so as to compare oxidation rates based on several microstructures: wrought, EBM as-built, EBM HIP and EBM HIP + HT. Results showed that, at 650 °C and 700 °C, all samples had similar oxidation kinetics, and presented spallation. At 750 °C however, the EBM sample without HIP or HT, showed a mass gain without spallation while the wrought one had oxide scale spalla-tion. This higher mass gain was explained by the formation of Fe-rich oxide nodules in the EBM sample, whereas the wrought sample showed mass loss with no Fe-rich nodules, similar to the tests performed at stable state of γ’’ (Ni3Nb) phases, nucleate non-uniformly [17]. These
δ-phases have a globular form when located at austenite grain boundaries or twin boundaries at temperatures below 930 °C; or an acicular form within the grain at temperatures above 1010 °C [18,19]. The pre-cipitation of this phase is known to increase IN 718 ductility by af-fecting grain size [20]. As grain size decreases, the volume fraction of δ-phases increases, thus reaching a maximum value of 13% after being aged at 900 °C for 20 h [19]. During the ageing treatment between at temperatures 700 °C and 900 °C, co-precipitation of niobium rich MC carbides [10] and δ-phases occurs at grain boundaries and increases with ageing time, this favours intergranular crack propagation [21]. Last but not least, the Laves phase (Ni,Fe,Cr)2 (Nb,Mo,Ti) [10], an
hexagonal close-packed phase, is also present in the interdendritic re-gions of 718 welds due to niobium segregation during the solidification process with fast cooling rate [22]. This intermetallic phase, which contains large amounts of Nb (19–26 wt.%), is strongly affected by cooling rate and is known to be a preferred crack propagation site. This tends to reduce the material’s tensile properties, ductility, and fatigue crack growth resistance [23].
Recent studies on microstructure showed small differences between AM-produced IN 718 and the wrought (WRG) alloy, partially due to the layer-by-layer melting process and the thermal gradient induced by beam melting. Thus, AM materials present columnar grains parallel to the build direction in LBM [24,25] and EBM processes both [26,27]. The thermal gradient induces epitaxial solidification leading to fine columnar grain architecture and dendrite epitaxial growth inside those grains, both structures are found parallel to the beam direction [28,29]. The formation of dendrites causes the segregation of alloy elements, such as niobium or titanium along interdendritic regions [30]. Besides, Helmer et al. [31] demonstrated that the grain structure of IN 718 alloys made by EBM process depends on scanning velocity and hatching space. They also showed that it is possible to have equiaxed grain structure even in the plane parallel to the build direction. Moreover, Strondl et al. [32] showed that the IN 718 alloy made by EBM process is a textured material oriented following the {200}γ plane. This was further
con-firmed by Idell et al. [33] in a 718Plus alloy made by LBM. Phases present in the AM material are similar to those present in the wrought material but differ depending on the thermal cycle and build para-meters. Amato et al. [34] found an ellipsoid γ’’ (Ni3Nb) (D = 100 nm
and d = 25 nm) phase platelet coincident with the {001} γ matrix in the as-built LBM material. This γ’’ phase was also observed by Strondl et al. on the as-built EBM material [26]. They also found 5–10 nm long pre-cipitates in the matrix and 50–100 nm long in the grain boundaries as compared to the 500 nm long precipitates found by Unocic et al. [35]. They also observed γ’ precipitates (2–5 nm [26], 30–100 nm [35]) in the as-built EBM sample. Acicular δ (Ni3Nb) phases (10 μm long) were
found in the interdendritic region above the matrix due to niobium segregation in the as-built EBM sample. And precipitates that were found coarser at the upper side/part near the last solidified layer, than at the lower side/part [35]. Contrary to what was observed in the as-built EBM material, Kuo et al. [36] found that δ phases were present in LBM materials only after the AMS 5662 heat treatment. Besides, during LBM process solidification, high cooling rate results in Nb segregation [37,38], and therefore the formation of long brittle Laves phases. However, no Laves phase was reported in 718 alloys produced by EBM process [26].
Furthermore, the nature of the phases in the microstructure depends on manufacturing parameters such as beam power, beam velocity and building chamber temperature. It also depends on the cooling condi-tions and the heat treatment they undergo. Usually, the AM-produced IN 718 parts present high anisotropic grain orientation and porosities impacting the material’s mechanical properties and density of the ma-terial [39]. Therefore, the as-built material needs to be hot isotactic pressed (HIP) followed either by an AMS 5662 or AMS 5664 heat treatment (HT), in order to close pores, dissolve weakening precipitate phases, homogenize the material and approach wrought microstructure
lower temperatures [35].
1.3. Effect of surface topography on high temperature oxidation
AM materials present irregular surface topographies along their construction planes; their roughness depends on surface defects, which are linked to process parameters [46,47]. Four kinds of defects are found on the surface of PBF samples. The first type of defect was de-fined by Tolochko et al. [48] as “balling” defects which are undesirable droplets from the melt pool that spread out above the surface due to the high flow rate of the metal fluid in the melt pool during laser melting. The second defect, was defined by Aboulkhair et al. [49] as “satellites”. They designate unmelted or partially melted powder particles sticking to the extreme surface due to insufficient energy for proper powder melting or to accumulation of heat at the surface, which sinters powder particles. “Satellites” are the major surface defects found on EBM samples [50,51]. Indeed, during the EBM process, a high quantity of electrons are concentrated in the powder bed which leads to electro-static charging and mutual repulsion of powder particles called “smoke”. In order to avoid, this effect the entire powder bed has to be pre-heated, leading to the “satellite effect” defined as unmelted powder particles sintered at the surface of EBM samples due to heat accumu-lation. And consequently, it is difficult to avoid powder particles to sinter the surface [52]. The third defect is due to the inclination angle of the construction part, which generates two different surfaces, the “up-skin” and the “down-“up-skin” surfaces. The heat diffuses through the previous layer for the “up-skin”, whereas it diffuses through the un-melted powder for the “down-skin”. Hence, the surface roughness de-pends on the heat transfer phenomenon. “Down-skin” surfaces have a higher roughness due to “satellite” defects [47,53]. The last defect is called the “staircase” effect and can be found in all AM-produced ma-terials. This defect is due to the layer-by-layer construction creating “stairs” or gaps between each layer on the side surfaces, which is coarser for curved surfaces [54]. Moreover, Tian et al. [47] studied the impact of LBM parameters on the surface roughness of the Hastelloy X material. The highest roughness (45 μm Ra) was measured on the “down-skin” of a 45° angle built surface. Moreover, they found that the use of a contour or skywriting scan improves surface roughness. Thus, the complexity of the surface morphology of AM samples, is governed by powder particle diameter, layer thickness, beam parameters, scan-ning patterns used and the inclination angle of the building part. Compared to traditionally manufactured parts, AM materials present rougher surfaces that have to be taken into consideration to determine oxidation kinetics. It is very important to recognise the correlation between surface topography and oxidation rate. Armanet [55] showed that residual stresses and oxygen content present in the surface were directly linked to the surface preparation method and had an impact on oxidation kinetics. He found that a SiC-ground surface induced more oxygen penetration through the surface than an alumina or diamond paste polished surface. In a second study, the oxidation of directionally solidified Ni-based alumina-former superalloy was tested at 1100 °C for 100 h in air, to compare various surface roughnesses. Surface with a 0.05-μm roughness surface presented the best oxidation resistance those with a 0.83-μm roughness presented better oxidation resistance than those with a 0.14-μm roughness, probably due to higher surface hardening leading to a faster formation of Al2O3 [56]. Studies
con-ducted on Fe-5Cr-10Al alloys, revealed that cold-worked surfaces in-creased Fe diffusion towards the surface during the early stages of oxidation and led to the nucleation of iron oxide [57]. Using the same approach, more hematite during the transient stage was found for rougher surfaces. Indeed, rougher surfaces favour iron nucleation over aluminium oxide nucleation [58].
Regarding chromia formers, the high density of dislocations induced by cold-worked surfaces is beneficial. Indeed, Cr diffusion towards the surface is accelerated but Fe diffusion is also accelerated [59]. More-over, studies carried out metal by Huntz et al. [60] on pure Ni metal,
showed that oxide roughness was coarser at the grain boundaries of the metal and increased with the initial surface roughness of the metal. In the same way, the size of the oxide grains also increases with the initial roughness of the metal.
In other words, the effect of surface roughness on oxidation kinetics is complex because surface topography depends on surface treatment which may involve composition changes in surface composition, slight oxidation, internal stresses and hardening. On the one hand higher roughness, induced by a cold-work process, can be beneficial; it can increase the dislocation density below the surface which helps Cr dif-fusion in the alloy towards the surface and favours the chromia scale formation. On the other hand higher roughness, may lead to local de-fects that may hinder the growth of a continuous protective scale and may increase stresses in the oxide scale especially during thermal cy-cling, and thus lead to spallation. But at first, it appears necessary to correctly understand the oxidation kinetics of rough surfaces. Indeed, the higher the surface roughness, the higher the surface area, and therefore the higher the mass gain will be for a given oxide scale thickness. Before looking for correlations between roughness and oxi-dation kinetics, it appears necessary to study the effect of surface area. None of the publications quoted above succeeded correlating roughness and oxidation kinetics quantitatively. In the present paper, the high temperature oxidation behaviour of 718 alloys made by two different AM processes – LBM and EBM – is compared to that of a commercial wrought 718 alloy at 850 °C for 48 h, 100 h, and 1000 h. First, differences in microstructure between the three 718 alloys will be presented. Then, oxidation kinetics measured by thermogravimetric analysis will be discussed based on various characterizations SEM-EDS, XRD and interferometric microscope. Finally, the influence of surface topography on oxidation kinetics will be discussed based on a numer-ical and analytnumer-ical model, the results of which will be compared with experimental data.
2. Materials and experimental procedures
IN 718 samples used in this study were manufactured following three different processing routes. Two sets of samples were produced by SafranTech (Magny-Les-Hameaux, France) using AM processes, two different PBF methods, i.e. LBM and EBM. AM samples were studied in their as-built form without heat treatment. The third set of samples was machined from a commercial IN 718 wrought plate supplied by Aubert & Duval (Ancize, France). This latter alloy was AMS 5662 heat treated, with a solution annealing at 980 °C for 1 h, followed by air cooling and an 8-hour ageing treatment at 720 °C, followed by a 2-hour furnace cooling down to reach 620 °C, an 8-hour hold and finally cooled by air. The chemical composition of the three types of specimens were ana-lysed by EDS. Quantification was obtained with a germanium detector calibrated on real standards. The composition of the alloys are in-dicated inTable 1. One can notice chromium concentration is 1 at.% higher in AM samples than in the wrought sample. This could improve the oxidation resistance of AM samples. However, they also have an iron concentration 1 at.% higher than that of the wrought one, this can have detrimental impacts. Besides, the percentage of aluminium in the EBM sample is slightly higher than that of the other samples.
In this work AM samples were produced with machine manu-facturers’ standard settings on an IN 718 building platform. The as-built LBM plate was made using an EOS M290 machine with a 40-μm powder-layer thickness and a nominal powder particle size distribution ranging from 15 to 45 μm (particle distribution: D50 NMT 29 μm and D90 NMT 45 μm), extracted from a powder batch supplied by EOS that was reused more than 20 times. The laser scanning strategy that was used is a band strategy with a 60° shift plus contour pattern after each layer. On the other hand, the as-built EBM plate was made using an ARCAM A2X machine with a 75-μm powder-layer thickness and a nominal particle diameter ranging from 45 to 105 μm (particle dis-tribution: D50 NMT 50 μm and D90 NMT 83 μm), extracted from a new
batch supplied by ARCAM. The electron beam scanning strategy that was used is a bidirectional parallel scanning plus contour pattern. The hatch spacing of the laser or electron beam, as well as the power and the velocity were set following machine manufacturers’ standard set-tings.
Nevertheless, there are some differences between these two AM processes that have to be taken into consideration, namely chamber temperature, building plate pre-heating and gas environment. During the LBM process, the building plate was pre-heated at 80 °C, the tem-perature of the build chamber was about 30–40 °C and the system op-erated under an Ar gas flow oriented towards the powder layer. Thus the estimated oxygen content in the entire chamber was less than 0.1 vol.% (< 1000 ppm). Therefore, the maximum value for the oxygen partial pressure(PO2)in the chamber is estimated less than 1 mbar, but it is certainly lower at the beam/powder layer interface due to the Ar gas flow directed towards the powder bed. In contrast with the LBM process, the EBM building plate and powder bed were pre-heated at 1000 °C, which roughly corresponds to 0.8 × Tm (Tm is the melting temperature of IN 718, that is about 1260–1340 °C, resp. solidus and liquidus). The system operated under primary air vacuum with a pressure of 2 × 10⁻³ mbar, therefore the P
O2 was estimated at
0.4 × 10⁻³mbar. This latter value could decrease during the
fabrica-tion process due to the reacfabrica-tion of the residual oxygen with the metal. In addition, the EBM building chamber is equipped with a heat shield that makes it possible to perform the pre-heating at 1000 °C. These distinct heat cycles and scanning strategies entail dissimilarities in terms of material metallurgy and surface topography. These differences were observed and their impact on oxidation behaviour was studied.
Two sets of samples were prepared for comparison, those with raw surfaces and those ground with P600-SiC paper (26 μm grit size). Parallelepiped samples were cut from raw plates with different thick-nesses depending on which manufacturing process was used, 1.15 mm thick for LBM samples, 4.85 mm for EBM samples, and 4 mm for wrought samples. For the first set of samples with raw surfaces, cut surfaces were ground with P600-SiC paper and the raw surface pro-portion was identified. Surface dimensions were measured using a di-gital caliper with an accuracy of ± 0.02 mm. Their dimensions roughly approached 15 × 10 × 1–5 mm3 and their surface area was
de-termined, using CAD software. Samples were ultrasonically cleaned in acetone and ethanol, and dried before oxidation testing.
Short time oxidation tests were conducted in a SETARAM TAG 24 S thermobalance with ± 0.1 μg sensitivity. The test temperature was set at 850 °C, which is higher than the usual operating temperature of IN 718 alloys, in order to increase oxidation kinetics and allow compar-isons with previous literature results [45]. Heating and cooling rates were set to 60 °C/min. The oxidation tests in the thermobalance were
performed under a synthetic air flow set at 5 ml/min and high tem-perature was maintained during 48 h and 100 h. With regard to the interpretation of mass gain curves for isothermal tests, mass gain during heating was calculated using the mass gain variation during cooling in order to correct the buoyancy effect. Longer-time oxidation tests were carried out in a box furnace at 850 °C, calibrated with N-type thermo-couple in laboratory air (PO2= 0.21 bar) for 1000 h. Samples were
weighed on a Sartorius ME215 P balance with ± 0.02 mg sensitivity, an average of three weighings were performed.
Prior to the high-temperature oxidation tests, the initial structure of the three samples were observed with an optical micro-scope (OM) along the three main building planes. They were etched with Kalling’s N°2 solution (100 ml ethanol, 100 ml HCl 32%, 100 ml H2O, 5 g CuCl2) for 3 to 4 min after being scoured 3 s with 32% HCl.
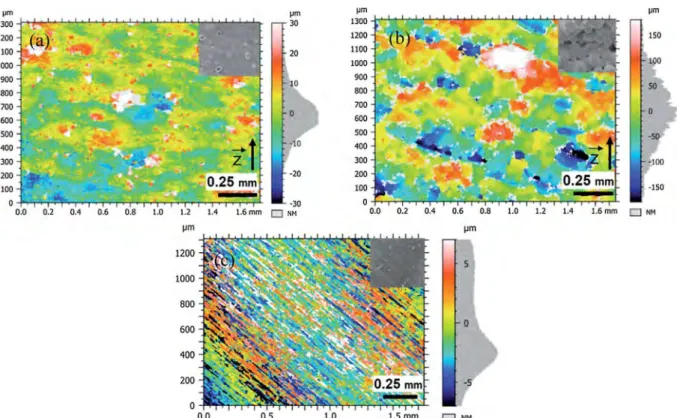
Surface topographies were analysed using Sensofar S neox an inter-ferometric (MAG 10X, ± 1 nm vertical resolution) and focus-variation microscope (MAG 10X, ± 1 μm vertical resolution). Furthermore, roughness parameters were measured based on the ISO 4287 standard (1998) and are calculated from the ‘3D measurement’ (S), the ‘rough-ness profile’ (R) and the ‘wavi‘rough-ness profile’ (W). As illustrated inFig. 1, the W-profile, is a Gaussian filtered profile used in order to exclude spikes and isolate the overall shape of the profile.
The most commonly used parameter is the arithmetical average of the absolute values of profile variation Sa, which is equivalent to the Ra parameter but for a 3D surface and not to a 2D profile. This parameter is used as an overall evaluation of the amplitude of the profile. Wa is the waviness average calculated from the W-profile.
∫
=
L Z x dx
Sa, Ra, Wa 1 L| ( )|
0 (1)
The quadratic mean (Sq) provides the same information as Sa and corresponds to the standard deviation of the height distribution, it gives a greater weight to peaks and valleys with an equivalent Sa.
∫
=
L Z x dx
Sq, Rq, Wq 1 L ²( )
0 (2)
The maximum profile height (Sz) is defined as the sum of the highest peak (Zp) and the deeper valley (Zv). This parameter indicates extreme peaks but is distorted by the presence of spikes, hence a higher dispersion in Sz values. There is an ongoing confusion about this parameter. Indeed in the old ISO 4287 standard (1984), this parameter was defined as the height average calculated from 5 or 10 heights of the profile or surface assessed. Some characterization tools are still using the old version of Sz. The present paper uses a more recent definition of Sz; the one in the ISO 4287 standard published in 1998.
(3)Sz, Rz, Wz=max (Zp)−max (Zv)
Laser Beam
Melting Electron BeamMelting AMS 5662Wrought Powder EOS/ARCAMASTM F3055 wt.% at.% wt.% at.% wt.% at.% wt.% Al 0.5 1.2 0.8 1.7 0.6 1.3 0.2 - 0.8 Ti 1.2 1.5 1.2 1.4 1.2 1.4 0.7 - 1.2 Cr 19.4 21.5 19.4 21.9 18.6 20.7 17 - 21 Mn 0.1 0.1 0.1 0.1 0.1 0.1 0 - 0.4 Fe 18.9 19.5 18.5 19.5 18.1 18.8 17 - 21 Ni 52.4 51.3 50.4 50.5 53.1 52.5 50 - 55 Nb 5. 3 3.3 4.9 3.1 5.5 3.5 4.8 - 5.5 Mo 3.0 1.8 3.1 1.9 2.9 1.8 2.8 - 3.3 Co – – – – – – 0 - 1.0 Cu – – – – – – 0 - 0.3 C – – – – – – 0 - 0.1 Si – – – – – – 0 - 0.4
The bold values are the main elements that could affect the oxidation behavior.
Fig. 1. Roughness and waviness profiles, description of parameters. Table 1
Chemical compositions of 718 alloys tested, EDS analysis conducted with a germanium detector calibrated on real standards.
∫
= ⎛ ⎝ ⎞⎠ Rq l Z x dx Ssk, Rsk, Wsk 13 1 l ( ) 0 3 (4) After the high-temperature exposure, the morphology, micro-structure, and composition of the oxide scales were analysed following several steps. First, scanning electron microscopy (SEM LEO435VP), equipped with an energy dispersive X-ray spectroscopy detector (EDS PGT IMIX-Ge), was used to characterize the external morphology and composition of the oxide scale. X-ray diffraction analysis was conducted using a low and constant incidence mode (XRD – Bruker D8, kα= 1.5418 Å). The angle of the X-ray source was set at differentin-cidence angles (5°, 10°, and 15°) and the detector scanned the sample from 20° to 120° (2θ). Using this method made it possible to better identify the nature of both the oxide and the precipitates at the extreme surface by reducing the relative peak intensity of the γ matrix. It also enabled us to analyse a constant thickness throughout the scan. XRD diagrams were analysed with the crystallography software CaRIne. Furthermore, the cross-sections of oxidized samples were analysed by SEM and EDS.
3. Results and discussions
3.1. Microstructures and roughness comparison
Fig. 2shows the optical views of the microstructure of 718 alloys made by the three different processes after being polished and etched by Kalling’s reagent. The as-built LBM sample presents melt pools in the (ZX) and (ZY) planes with a Gaussian shape due to the laser beam passes of each layer. Whereas in the (XY) plane, the band strategy (100-μm large band-width) with a 60° laser beam shift after each layer. The grain boundaries are not clearly visible but, with a closer look, elon-gated grains can be noticed. On the contrary, the grains are distinctly visible in the as-built EBM sample. Small equiaxed grains (10–20 μm diameter) are apparent along the surface as deep as 100 to 180 μm from the surface. This is due to the rapid cooling process which has an im-portant impact on grain nucleation. In the bulk however, the driving force for nucleation decreases but the thermal gradient induced by the heat of the beam and the cooling process, leads to the formation of elongated grains (20–70 μm wide and a length ranging from 200 μm in the (XY) plane to 500 μm in the (ZX) plane). The last sample was
wrought and heat treated (AMS 5662: solution annealing and ageing treatment). These heat treatments give the sample a homogenous mi-crostructure with small equiaxed grains (diameters ranging from 10 to 20 μm) on its entire surface.
The surface topography of the samples was characterized using an interferometric and confocal variation microscope. The highest rough-nesses were found on the side surface, parallel to the build direction. As a reminder, the diameter of the particles used for EBM samples ranged from 45 to 105 μm with a 75-μm layer-thickness, whereas the diameter of those used for LBM samples ranged from 15 to 45 μm with a 40-μm layer-thickness. In addition, the scanning patterns used are different a bidirectional parallel scanning plus contour for EBM samples and a band strategy with 60° shift plus contour after each layer for LBM samples. Both sets of samples thus underwent a contouring beam scan of their extreme surface. Nevertheless,Figs. 3 and 4, where the side surface are represented. Indicate that the samples show dissimilarities in terms of surface topography.Table 2shows that the roughness of the as-built EBM surface in its (XZ) plane (50 ± 2 μm Sa) is much rougher than the one of the as-built LBM surface in its (XZ) plane (7 ± 1 μm Sa), and over 1000 times as rough as than the P600-ground surface (0.033 ± 0.002 μm Sa). The skewness parameter (Ssk) reveals that the as-built LBM surface presents an asymmetric profile certainly due to the fact that small quantities of isolated powder particles are present onto its surface. Whereas the skewness of the EBM rough surface, is close to zero, which suggests that the surface has a relatively symmetric profile regarding peaks and valleys. Here the value of Sz might be distorted by spikes. But profiles inFig. 4reveal that the EBM sample presents the highest peak-to-valley height, reaching an amplitude of about 300 μm whereas the amplitude of the LBM sample is about 40 μm. Additionally, the profile displays high peaks and deep valleys with a rounded roughness profile close to its waviness profile, which is certainly due to the fact that powder particles are distributed onto the entire surface of the EBM sample. On the other hand, the P600-ground surface presents a smaller Sa value but a significant number of peaks and valleys, which correspond to polishing scratches. Moreover, the roughness profile of the EBM sample seems to follow a periodic peak-to-valley pattern, which is about 200-μm long. This is less apparent in the LBM roughness profile. This periodic profile might be due to the layer-by-layer con-struction, as is the case for the “staircase” defects [54] and might be affected by layer-thickness, as explained by Safdar et al. [51]. The powder particles present on the surface of LBM and EBM samples are called “satellite” defects, which are linked to the process parameters and scanning strategy both of which affect heat conduction. Indeed, during the EBM process, all the powder bed was pre-heated at 1000 °C. This may sinter the unmelted or partially-melted powder particles onto the surface, as showed by Ahmed et al. [61] on Ti-6Al-4 V. Therefore,
Fig. 2. OM combined views of initial micro-structures of etched 718 alloys observed along the three building planes: (a) as-built LBM sample manufactured with a 40-μm powder-layer thickness and a 15–45 μm nominal par-ticle diameter, (b) as-built EBM sample built with a 75-μm powder-layer thickness and 45–105 μm particle nominal diameter, and (c) wrought heat-treated sample (AMS 5662).
The Skewness parameter (Ssk) describes the asymmetry of the height distribution from the mean line. A positive value indicates a surface composed of mainly peaks and few valley, whereas a negative value which indicates a surface mainly composed of deep stripes. If the surface is composed of as many peaks as valleys, the value of the parameter approaches zero.
powder particles are clearly visible on the entire surface of the EBM sample. The side surface of the LBM sample however, has isolated particles spread on it. These, are mainly due to the “balling” effect [48]. Thus, the major difference between the raw surfaces of both AM samples relies on those powder particles sintered on the surface. The microstructure induced by these unmelted powder particles on the surface of the EBM sample could differ from the melted surface of the
LBM sample and may have an impact on oxidation behaviour. 3.2. Oxidation kinetics
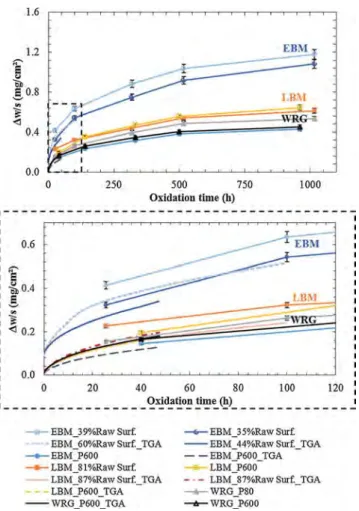
Air oxidation tests were carried out at 850 °C for 48 h, 100 h and 1000 h. The oxidation behaviour of the IN 718 alloys built from three different processes were compared: the built LBM sample, the as-built EBM sample and the heat-treated wrought sample. Usually, the 718 alloy is not used at this temperature but rather around 650 °C [8]. Indeed, beyond this temperature, its yield strength drops. The experi-mental temperature (850 °C) was chosen so as to accelerate oxidation phenomena but also to compare oxidation results on the LBM-produced IN 718 produced against those obtained by Jia and Gu [45]. Moreover, to respond to aeronautic applications, the oxidation behaviour of AM samples with raw surface was compared to that of samples with an entirely ground surface (P600 grit). Oxidation results presented in Fig. 5show the mass gain per unit area Δw/s (mg/cm²) as a function of time by taking into account the mass gain during temperature elevation for TGA experiments also (with buoyancy correction). Experimental errors were estimated. The relative errors include uncertainties on mass and on the surface area measurements. The maximum overall error on mass gain per unit area reached 4%. Results show dissimilarities de-pending on the manufacturing process used, especially in terms of
Fig. 3. Focus variation and interferometric microscope views of surface topography on the (XZ) plane: (a) as-built LBM surface, (b) as-built EBM surface, and (c) wrought P600-ground (similar to EBM and LBM samples 100% P600-ground).
Fig. 4. Roughness and waviness profiles along the (XZ) plane parallel to the build direction, and determination of the arithmetical mean height (Ra); and the maximum height (Rz) of the profile: (a) as-built LBM surface, (b) as-built EBM surface, and (c) wrought P600-ground surface (similar to the EBM and LBM 100% P600-ground).
Table 2
3D-roughness parameters comparison, ISO 4287 standard. Focus variation microscope
( ± 1 μm vertical resolution)
Interferometric microscope ( ± 1 nm vertical
resolution) As-built LBM
surface As-built EBMsurface Wrought P600 grit surface Sa (μm) 7 ± 1 50 ± 2 0.033 ± 0.002 Sq (μm) 10 ± 1 65 ± 2 0.042 ± 0.002 Sz (μm) 153 ± 24 525 ± 3 0.8 ± 0.1 Ssk 1.5 ± 0.4 0.2 ± 0.2 0.3 ± 0.1
oxidation rate during the transient stage. Looking at AM samples with raw surfaces, as-built LBM samples (7 μm Sa) exhibit oxidation kinetics that is similar to that of the heat-treated wrought samples; as-built EBM samples (50 μm Sa) present faster oxidation rate. Thus, the rougher the surface, the faster the oxidation rate. This is illustrated by a pronounced mass gain during the transient stage. Nevertheless, if all surfaces of the three different sets of samples are ground using P600-SiC paper, EBM samples show the best oxidation resistance compared to LBM and wrought samples. But throughout the steady stage, mass gain curves become similar and it seems that the three samples have similar oxi-dation behaviour for long term oxioxi-dation. As shown inFigs. 5 and 6all oxidation kinetics approximately follow a parabolic rate law. This means that the three kinds of 718 alloys can be described by Wagner’s theory. In which case, the oxidation rate is controlled by anionic and/or cationic diffusion in the oxide scale. Oxidation kinetics can be described by Tammann’s parabolic law (5) [62]:
⎛ ⎝ ⎞⎠ = × → ⎛⎝ ⎞⎠ = w s k t w s f t ∆ ∆ ( ) p 2 2 (5) where∆w(mg) is the mass gain, s (cm²) represents the surface, t (s) corresponds to oxidation duration and kp (mg². cm−4.s-1) is the
ap-parent parabolic rate constant determined by a linear fitting in a parabolic plot (Fig. 6a). But to better take differences into account during the transient stage and steady stage, kpshould be determined by
the Pieraggi method (6), in which case the parabolic rate constant is determined by plotting mass gain versus square root of time [63] (Fig. 6b): = × + → = w s k t Constant w s f t ∆ ∆ ( ) p (6)
Moreover, it has been shown by Monceau and Pieraggi [64] that the complete parabolic law (7) allows to better fit transient and steady stages. It allows to calculate the “true” kp, i.e. the kpwhich only depends
on the diffusion, regardless of the kinetics of interfacial reactions and the occurrence of a transient stage of oxidation. This method can be used to perform a local kpevaluation in a sliding window.
Fig. 5. Isothermal oxidation kinetics of the three 718 alloys (LBM, EBM and wrought) at 850 °C for 48 h, 100 h and 1000 h (the 48 h and 100 h experiments were conducted in TGA under synthetic air flow, others in static lab air).
Fig. 6. Apparent and parabolic oxidation rate fitting of the three 718 alloys (LBM, EBM and wrought) at 850 °C for 1000 h: (a) Linear fitting (Δw/s)² = f(t), (b) Linear fitting (Δw/ s) = f(t1/2) [68], (c) Complete parabolic fitting t = f(Δw/s) [64].
= + + ⎛ ⎝ ⎞⎠ = → = t A B w s C w s k p C t f w s ∆ ∆ where 1 (∆ ) 2 (7) In this last equation, the kpis the “true” kpwhich only depends on
the diffusion at the time corresponding to the fitting window (Fig. 6c). InTable 3slight differences in kpvalues can be noticed depending
on the method used and the maximum estimated error on the evolution of kpreached 8%. As found by examining mass gain curves, it appears
that the as-built EBM sample with raw surface is the one with the fastest oxidation kinetics. Indeed, the as-built EBM sample with 60% raw surface presents the highest parabolic rate constant after 100 h oxida-tion (app kp= 5.3 × 10⁻⁷mg². cm-4.s-1), followed by the one with 39%
raw surface with (app kp= 4.4 × 10⁻⁷mg². cm-4.s-1) after 48 h
oxida-tion. The highest rate for LBM samples was found for the one with 87% raw surface (app kp= 1.9 × 10⁻⁷ mg². cm-4.s-1). While the WRG
sample (app kp= 7.0 × 10⁻⁸mg². cm-4.s-1) and the EBM sample (app kp
= 6.2 × 10⁻⁸mg². cm-4.s-1) both with a P600-ground surface, have the
lowest parabolic rate constants. Similar results are obtained by calcu-lating and comparing ‘true’ kp, which should better fit the oxidation
kinetics. Both ground wrought and ground EBM samples have ap-proximately the same parabolic rate constant, around 2.0 × 10⁻⁸
mg². cm-4.s-1 found for their ‘true’ k
p. Moreover, the as-built EBM
composed of 44% raw surface (‘true’ kp= 3.8 × 10⁻⁷ mg². cm-4.s-1)
and of 60% raw surface (‘true’ kp= 3.3 × 10⁻⁷mg². cm-4.s-1), have the
highest rates. LBM samples present similar oxidation kinetics whether their surfaces were ground or raw. Whereas the oxidation rates of EBM samples differ (up to 10 times) depending on the surface preparation method. At last, even though the ground EBM and ground wrought samples have approximately the same oxidation rate, the unground EBM sample presents the highest oxidation rate.
Calculated values of apparent kpare compared to those found in the
literature [65–67] as shown inFig. 7Compared to Greene [42] and Pieraggi’s results [42,68], all samples studied present a good oxidation resistance close to the commonly-used 718 cast or wrought alloy. These values of apparent kpare on the lower limit of the “chromia forming
alloys zone” as defined by Hindam and Whittle [66]. Moreover by comparing our results with those obtained by Jia and Gu [45] on an as-built IN 718 LBM sample at the same test temperature of 850 °C but produced with a different machine and different process parameters, it appears that samples tested here, produced by LBM or EBM processes and without heat treatment, show better oxidation resistance and have an oxidation behaviour in air that is similar to that of the wrought heat-treated 718 alloy. It is difficult to explain the important difference in oxidation kinetics as compared to Jia and Gu’s results [45] even if their samples were ground with 1000 grit SiC abrasive paper (P1500). These
discrepancies may be due to various parameters: differences in the chemical composition of the powder or as-built material, degree of contamination, building and test environment, or the building strategy, in which case it has a consequence on the material’s microstructure and density. To sum up, all samples studied present good oxidation
Table 3
Parabolic rate constant (kp) comparison for air oxidation tests carried out at 850 °C for 48 h, 100 h and 1000 h (synthetic air flow for TGA and static lab air for others). Test conditions Process raw surface % or grit size app kp
(mg². cm−4.s-1) Equation 5 (× 10−7) kpPieraggi (mg². cm−4.s-1) Equation 6 (× 10−7) ‘true’ kp (mg². cm−4.s-1) Equation 7 (× 10−7)
Measured oxide scale thickness (μm)
TGA or furnace Time (h)
TGA 48 LBM 87% 1.9 2.3 2.0 – TGA 48 LBM P600 1.6 1.7 1.6 1.0 ± 0.2 TGA 48 EBM 44% 3.2 3.8 3.8 0.9 ± 0.2 TGA 48 EBM P600 0.84 0.95 0.89 0.7 ± 0.2 TGA 48 WRG P600 1.7 1.8 1.7 0.6 ± 0.1 TGA 100 LBM 87% 1.5 1.6 1.3 0.8 ± 0.3 TGA 100 EBM 60% 5.3 4.7 3.3 0.9 ± 0.2 TGA 100 WRG P80 0.43 0.39 0.36 – Furnace 1000 LBM 81% 1.2 0.63 0.38 3.6 ± 0.5 Furnace 1000 LBM P600 1.4 0.98 0.50 3.7 ± 0.1 Furnace 1000 EBM 35% 3.6 2.3 1.4 3.0 ± 0.5 Furnace 1000 EBM 39% 4.4 2.4 1.3 – Furnace 1000 EBM P600 0.62 0.41 0.21 2.6 ± 0.2 Furnace 1000 WRG P600 0.70 0.42 0.20 3.4 ± 0.6 Furnace 1000 WRG P80 0.93 0.66 0.31 –
The bold values are the highest and the lowest oxidation rate found respectively on a raw sample and on a P600-grit sample for the three different kp.
Fig. 7. Arrhenius diagram, apparent kp comparison with literature results. Literature values from Greene and Finfrok [42], Jia and Gu [45], Peraldi et al. [65], H. Hindam and D. Whittle [66], M. Brumm and H. Grabke [67], Pieraggi and Monceau [68].
resistance compared to the literature, all between 2.0 × 10⁻⁸ and
3.8 × 10⁻⁷mg². cm-4.s-1(‘true’ k
p). Nevertheless, oxidation rates differ
depending on manufacturing process employed and surface topo-graphy. There is no doubt that LBM samples (ground or raw surface) and wrought samples present a more stable oxidation behaviour com-pared to that of EBM samples. Indeed, oxidation rate of EBM samples are different whether ground or raw. To explain these results, two main hypotheses are formulated. The first one relates to surface topography and the second concerns differences in microstructure: grain size and phase composition. EBM samples present a much rougher surface than LBM samples. This difference might induce an inaccuracy as to the determination of the real surface of the sample, that which affects the determination of the parabolic rate constant. On the other hand, during the EBM process, the powder layer is preheated, and unmelted powder particles can easily sinter the extreme surface of the material. There-fore, the extreme surface of a raw EBM sample is essentially composed of unmelted powder particles which might be different from the bulk in terms of microstructure. Other assumptions can also be made regarding the impact of the texture of the elongated grains in AM materials, or the grain size and the proportion of delta phase present in the material.
The powders used for building LBM and EBM samples are different. Ardila et al. [69] studied reused 718 alloy powder for LBM application on a Realizer SLM 250 machine operated under argon gas with an oxygen content limited to 2000 ppm (PO2< 2 mbar). Nandwana et al.
[70] studied reused powder for EBM application on an Arcam A² ma-chine operated under secondary vacuum pressure lower than 1 × 10⁻⁴
mbar (PO2< 0.2 mbar), they both found that 718 alloy powder is
che-mically and mechanically stable after a significant number of cycles: maximum 14 times for SLM processing [69] and 6 times for EBM pro-cessing [70]. In addition, it has been found that oxygen concentration in the AM-produced 718 part increased from 30 to 90 wt. ppm after 6 cycles of EBM processing [70]. Yet, this depends on the machine and how the powder is stored and handled. For the present work, EBM samples were produced from a new powder batch whereas LBM sam-ples were produced from a powder batch that was reused 20 times. 3.2.1. Morphology and nature of the oxide scale
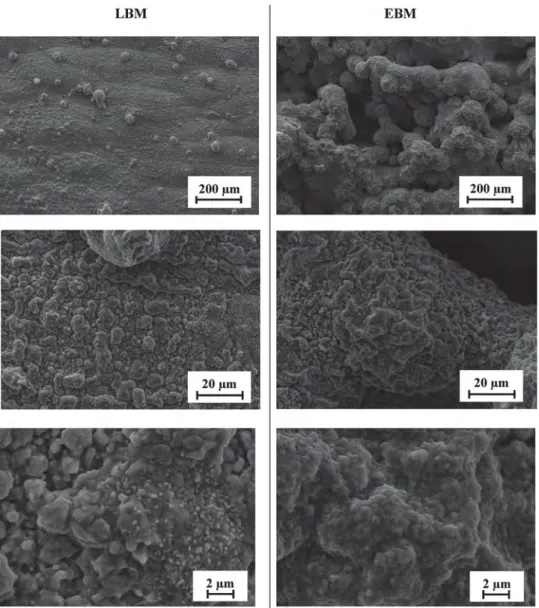
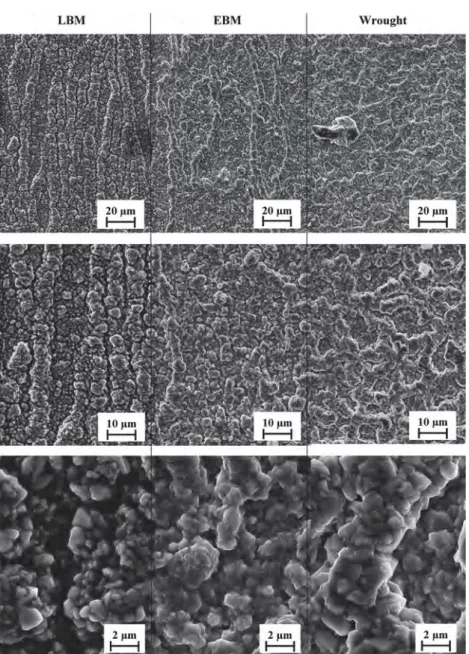
SEM micrographs of the surfaces oxidized at 850 °C in air for 1000 h are shown inFigs. 8 and 9. There is no obvious difference between the three processes. The external oxide scale is homogenous and adherent, it seems to be relatively thin. Indeed the initial surface topography of raw surfaces is still recognisable, and powder particles are still visible in Fig. 8. They all have faceted oxide grains, but the oxide layer formed on raw samples seems more compact on the EBM sample than on the LBM sample. On the raw surfaces, the oxide scale has nodules spread onto the entire surface. On the contrary, swelling ridges can be noticed on ground surfaces. They are elongated and oriented along the→z direction in both AM samples, whereas in the wrought sample they are not
oriented. According to Al-hatab et al. [43], those swelling ridges are concentrated in the metal grain boundaries (GB) and show that the oxide scale grows faster in the GB.
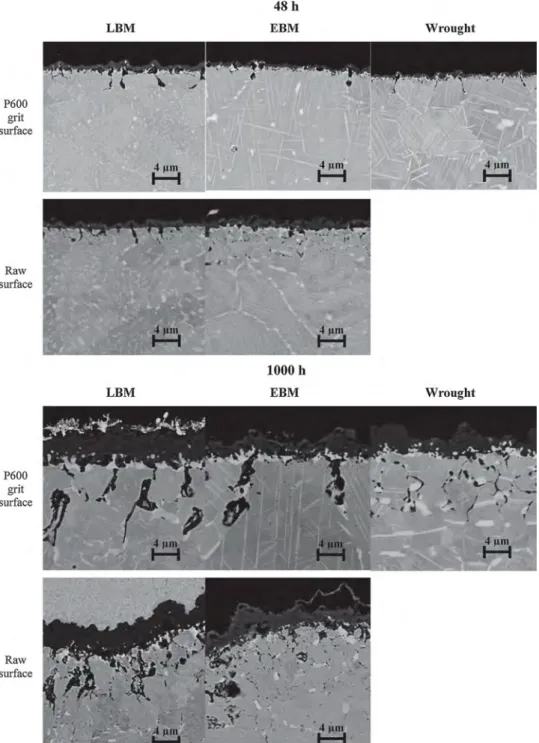
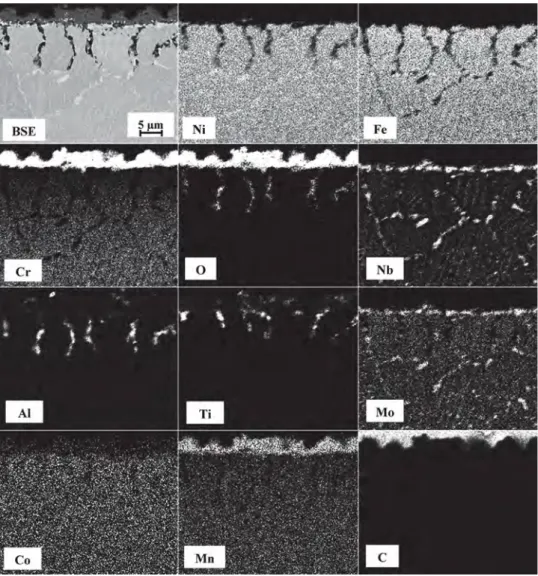
SEM-BSE micrographs of the cross-section of samples oxidized at 850 °C in air for 48 h and 1000 h are shown inFig. 10. Results regarding the chemical composition of the cross section of an oxidized EBM sample using an EDS detector are shown inFigs. 11 and 12. SEM-BSE micrographs show that the thickness of the oxide scale increases with oxidation time. Thickness ranges from 0.6 to 1.0 μm for a 48-h oxida-tion test, and from 3.0 to 4.0 μm for 1000 h oxidaoxida-tion test. But the ground EBM sample inFig. 10has the thinnest oxide scale. Moreover the penetration depth of the intergranular oxidation increases similarly. Penetration depth ranges from 1.5 to 4.0 μm for a 48-h oxidation test, and from 6.5 to 8.0 μm for a 1000-h oxidation test. Small differences can be noticed regarding intergranular oxidation. AM samples look the same whereas the wrought sample has thinner intergranular oxidation. At this temperature and for this oxidation time (followed by slow cooling), the precipitation of δ-phases occurred within the grains with an acicular oriented form and through the grain boundaries (GB) or twin boundaries (TB) with a globular form as seen in the micrographs [17]. EDS analysis results are identical for the three samples LBM, EBM and wrought. It can be noticed that all samples have an external
chromium-rich oxide scale due to chromium diffusion towards the alloy surface and intergranular oxidation growing preferentially along GB. This oxide located in the GB, is mainly composed of titanium oxide near the oxide scale/alloy interface and also alumina oxide, but deeper in the alloy. This intergranular oxidation is due to the diffusion of oxygen, which reacts with aluminium and titanium at a lower oxygen partial pressure. For a given temperature, the most stable oxides are found deeper in the scale, in agreement with thermodynamic theory; they are more stable when the oxygen partial pressure is lower, which is the case deeper in the alloy. Al-hatab et al. [43] and Delaunay et al. [44] found similar results for chromia scale and alumina intergranular oxidation on a wrought 718 alloy. EDS cartographies show that manganese is present in the oxide scale but this is not certain because the distinction between chromium (Cr kα1: 5.41 keV) and manganese (Mn kα1= 5.89 keV) EDS
peaks is not accurate enough. In addition, beneath the chromia scale, one can notice a thin niobium-rich layer, chromium depletion and slight δ-phase dissolution. Same results have been found by Delaunay et al. [44] in a 718 wrought alloy and by Chyrkin et al. [71] in a wrought 625 alloy. According to Delaunay et al., this thin niobium-rich layer is an enriched δ-phase layer that has not been oxidized and might act as a diffusion barrier. As explained by Chyrkin et al. [71], the chromium depletion, due to the formation of the chromia scale, tends to reduce
niobium activity, that which acts as a driving force for the diffusion of niobium towards the scale/alloy interface. Hence, the diffusion coeffi-cient of chromium is lower in this δ-phase rich layer than in the matrix. This may lower the growth rate of the chromia scale.
Moreover, as seen inFig. 12, unmelted powder particles used during AM processes sintered the extreme surface of the material, this is especially true for the EBM process where the powder bed is pre-heated at 1000 °C and particles can easily sinter the melted surface or ag-glomerate. Thus, oxygen can quickly diffuse at the interfaces between particles or at the particle/bulk interfaces. In this location, chromium oxide (Cr2O3) and titanium oxide (TiO2) are detected. Oxidation in this
area can easily generate spallation, not only of the oxide scale but also of the sintered particle, that which can lead to a huge mass loss. TiO2is
known to cause large compressive stresses due to its high Pilling and
Bedworth ratio, which can enhance oxide scale spallation [72]. InFigs. 10 and 11, δ-phase dissolution and niobium depletion are less visible in the ground EBM sample oxidized for 1000 h than the other samples, which have been oxidized under same conditions. This difference may be due to initial microstructure. Indeed, before oxida-tion tests, the as-built EBM sample had δ-phase onto its entire surface [35] whereas the as-built LBM sample, did not have δ-phase until it was heat-treated and aged [73,74]. The high concentration of this phase in the initial microstructure might slow down chromium diffusion towards the surface and can explain why the ground EBM sample had a slower oxidation rate compared to the two other samples.
The X-ray diffraction (XRD) analyses were performed at room temperature on the three different 718 alloy samples (LBM, EBM and WRG) oxidized at 850 °C in air for 1000 h. The results are the same for
Fig. 10. SEM-BSE micrographs of the cross-section of oxidized LBM, EBM and wrought samples in the (XY) plane oxidized 48 h in synthetic air and 1000 h at 850 °C in static lab air.
the three types of samples but differences can be noticed between XRD analyses conducted on P600-ground and raw surface samples, they are compared inFig. 13. The presence of peaks characteristic of γ matrix (fcc, A1, Fm3m, a = 0.592 nm, adjusted with CaRIne software) con-firms that the X-ray penetrated the entire oxide layer (3–4 μm deep). From EDS cartographies in Fig. 11, and X-ray diffraction results in Fig. 12, the oxide scale of the 718 alloy at 850 °C is essentially com-posed of chromia (Cr2O3, D51, R3cH). This observation, i.e. the
for-mation of a continuous chromia scale in all samples, is consistent with the parabolic rate constants, whose values were typical of chromia formers (Fig. 7). Moreover, in order to better highlight the X-ray peaks of the oxide scale’s extreme surface, the X-ray source position was set to 5°. As a result, a small amount of rutile (TiO2, C4, P42m nm) and
manganese spinel (MnCr2O4, H11, Fd3mS) or iron spinel (FeCr2O4,
H11, Fd3mS) are detected in the outermost oxide layer, especially in
the raw surface samples. As explained by Al-hatab et al. [43], the dif-fusion coefficients of titanium and manganese are higher than that of chromium in the chromia scale. So during the early stage of oxidation, titanium and manganese ions migrate rapidly towards the gas/oxide interface until those elements exhausts near the oxide/metal interface (1.4 at.% and 0.1 at.%) and let the cationic growth of chromia layer control the oxidation rate of 718 alloys. In addition, by increasing the X-ray incidence angle to 10° and 15°, small peaks of rutile (TiO2) are
detected deeper in the scale. This is in good agreement with EDS results. Titanium oxide is more stable than chromium oxide, it can nucleate and grow at lowerPO2. Furthermore, the presence of δ-phases, deeper in the
scale, is highlighted and confirms that the niobium rich layer found with the EDS analysis is a non-oxidized δ-phase-rich layer. The intensity of its X-ray peaks decreased as the source angle was lowered. As a re-sult, the illustration inFig. 14shows the oxidation of an AM 718 alloy. 3.2.2. Correlation between surface roughness and oxidation kinetics
At first sight, based on our results, the as-built EBM sample with raw surface seems to have lower resistance against air oxidation at 850 °C compared to the as-built LBM and the AMS 5662 wrought samples. But parabolic rate constants kp(mg². cm−4.s-1) were determined using the
“projected” flat surface area of the samples without taking surface roughness into account. None of the cited publications tried to quan-titatively link roughness to the real surface area to calculate oxidation rates. Indeed, most of oxidation tests were done on ground surfaces (P600 grit) in order to simplify comparison with the literature, and because most surfaces of materials made with traditional shaping pro-cesses are smoother than the EBM sample. As shown inFig. 15, con-siderable differences can be noticed in terms of surface topography. The roughness of a P600-ground surface is 0.033 ± 0.002 μm (Sa). Such roughness value might not affect the estimation of the real surface area of the samples but this is not the case for the as-built LBM and EBM samples, 7 ± 1 μm (Sa) and 50 ± 2 μm (Sa) respectively. Hence, the roughness of AM samples distorts the determination of the real surface area and could have a direct impact on the determination of oxidation rates. Therefore, the ratio of raw surface to ground surface has to be determined to better estimate oxidation kinetics.
As explained before, two sets of sample were prepared for oxidation tests, those with raw surfaces and those with surfaces ground with P600 grit size abrasive paper. The raw-surface samples were cut from a raw plate. Their cut surfaces were ground with P600-SiC abrasive paper and the proportion of raw surface has been calculated. First, from the mass gain decomposition, which is based on a mixing law and manipulation of parabolic rate constant, the oxidation rate constant of a sample with 100% raw surface (in theory) can be estimated. This estimation is based on our experimental results without taking into consideration the real area of a raw surface. The corresponding law is then given by: ⎛ ⎝ ⎞⎠ = × ⎛⎝ ⎞⎠ + − × ⎛⎝ ⎞⎠ w s α ∆w s α ∆w s ∆ (1 ) raw P % 600 (8) = × + − × kp% α kpraw (1 α) kpP600 (9) = − − × k k α k α ( (1 ) ) ² praw p% pP600 2 (10) where
( )
w s ∆%is the experimental mass gain per unit area of a sample
composed of raw surface and P600-ground surface,
( )
∆ws P600 is the
ex-perimental mass gain per unit area of a 100% P600-ground sample,
( )
∆ws rawis the mass gain per unit area of the sample composed of 100%
raw surface (in theory), kpiis the corresponding parabolic rate constant,
and α is the percentage of raw surface on the sample. Eq. (10) makes it possible to calculate parabolic rate constants for a raw surface. In the second step below, the real surface area is calculated by introducing a correction coefficient called Ψ, that has to be determined. Thus, this kprawhas to be corrected by taking into consideration the real area of
the raw surface (sraw) and can be expressed as:
⎛ ⎝ ⎞⎠ = × w s k t ∆ raw praw 2 (11)
Fig. 12. EDS cartography analysis of an EBM sample with raw surface oxidized for 48 h at 850 °C in synthetic air, picture of the extreme surface at the unmelted powder particle/bulk interface.
Fig. 13. Low incidence X-ray diffraction diagrams of LBM sample oxidized at 850 °C in air for 1000 h with (a) P600-ground surface and (b) raw surface.
⎛ ⎝ × ⎞⎠ = × = > w s k t Ψ s s ∆
Ψ praw corr with 1
raw P 2 . 600 (12) = × ⎛ ⎝ ⎞⎠ k k 1 Ψ
praw corr. praw
2
(13) where Ψ is the surface area ratio of a raw surface to ground surface. The issue here is the estimation of the real area of the raw surface (sraw).
Hence, to determine this area ratio, two methods are compared. The first one is based on our experimental results. If we assume that, for the same real surface area, the mass gain is identical on raw and ground surfaces, the correlation between the kpratio and the surface area ratio
is as follows: = × = > k k k k Ψ Ψ s s with 1 praw corr pP praw pP raw P . 600 600 2 600 (14)
If we assume that the surface area is the main parameter responsible for oxidation rate disparity, kpraw.correctshould approach kpP600, we can
then assume that: = kpraw corr. kpP600 (15) = k k Ψ praw pP600 (16)
The surface area ratio of LBM and EBM samples determined from kp
calculations are compared inTable 4. kp%is the experimental parabolic
rate constant found for samples composed of 81% raw surface (LBM) and 39% raw surface (EBM). The parabolic rate constant obtained on a 100% P600 ground sample is defined by kpP600. kprawis the parabolic
rate constant determined from experimental data and Eq. (10). Then, the surface area ratio Ψ is determined by using Eq. (16). The fact that both kp600 and kpraw decrease with time is due to the formation of
transient oxides but may also be due to the growth of a δ-phase-rich layer below the oxide scale, as seen inFig. 11 which slows down chromium diffusion towards the gas/oxide scale interface.
The surface area ratio of the raw LBM sample is close to 1 which means that the surface area ratio does not have a significant impact on the determination of its oxidation rate. On the contrary, the surface area ratio reaches 4 for the EBM raw surface. This is consistent with the fact that in terms of roughness (Ra), the EBM sample is 7 times rougher than the LBM sample. Results show that the area of the EBM raw surface might be underestimated up to 4 times against 1.4 times for the LBM raw surface. The determined values are much higher than the maximum relative error made on the determination of kp(8%). Therefore, if
sur-face area is the main factor responsible for the differences in oxidation kinetics, the ratio of its real surface area to its measured or projected surface area should approach values indicated inTable 4. This table also shows that the surface area ratio is higher during the transient stage (first 50 h of the oxidation test), and decreases slightly during the steady stage until reaching a constant value. Indeed, mass gain during the transient stage is more important than during the steady stage
Fig. 14. Schematic diagram showing the cross-section of an AM-produced 718 alloy oxidized at 850 °C in air for1000 h.
Fig. 15. SEM micrographs of the raw surfaces of (a) as-built LBM along the (XZ) plane built with a 40-μm powder-layer thickness and 15–45 μm nominal particle diameter, (b) as-built EBM raw surface along the (XZ) plane built with a 75-μm powder-layer thickness and 45–105 μm nominal particle dia-meter, (c) P600-ground surface.
because the initial surface favours high adsorption of oxygen atoms; the larger the surface area, the higher the mass gain. The mass gain then decreases throughout the steady stage. This can be due to the growth of a compact chromia scale which may smooth the surface by filling
external porosities and the smallest depressions, and by consuming the smallest hills. The effect of roughness on oxidation kinetics is expected to decrease with time. Indeed, as the oxide layer grows its thickness tends to be higher than surface undulations. The effective cross-section for diffusion through this layer becomes similar to that of an oxide layer formed on a flat surface.
These surface area ratios extracted from experimental oxidation rates have to be strengthened by surface area ratios determined from roughness measurements. In this section, simple 3D-surface numerical models are used to estimate these surface ratios. The models used are built using roughness parameters, and are based on the assumption that surfaces present periodic peaks and valleys. Thus, sample surfaces were modelled as a periodic function. This rough assumption makes this modelling an approximation method to estimate surface area ratios.
The modelling is based on roughness (R) and waviness profiles (W). The waviness profile was obtained by filtering the roughness profile with a Gaussian filter, so as to better reproduce surface morphology by filtering high peaks and deep valleys. Two sets of parameters were re-tained in order to reproduce a periodic 3D surface, amplitude para-meters (Rc, Wc) and spatial or periodic parapara-meters (RSm, WSm). As explained inFig. 1, mean height parameters, Rc and Wc indicate the amplitude average of a profile, they correspond to the average of all successive peak-to-valley heights (Zti) of the profile elements.
∑
= = m Zt Rc, Wc 1 i m i 1 (17)Mean width parameters, RSm and WSm are spatial parameters, in-dicating the average width of profile elements, where (XSi) is the width
of a single profile element formed by a successive peak and valley.
∑
= = m XS RSm, WSm 1 i m i 1 (18)The parameters shown in Table 5were calculated from the two profiles inFig. 16. One can see that the roughness profile (R) of the as-built LBM has many peaks and valleys of low amplitude (Rc) and small width (RSm). This is due to its relatively smooth surface and a smaller scale on the→z axis. The roughness profile of the as-built EBM, however, is rounder with peaks and valleys of high amplitude (Wc) and large width (WSm), and closer to its waviness profile (W) which appears to be flatter. Additionally, due to the Gaussian filter, the peaks of the LBM roughness profile are filtered and its waviness profile presents a mean width (WSm) close to the one of the EBM profiles. The waviness profile
LBM, 850 °C, 1000 h Time (h) Exp kp% α= 0.81, Sa = 7 μm (× 10−7) Exp kpP600 (× 10−7) Calc kpraw (× 10−7) kpraw kpP600 Ψ 25 5.6 2.7 5.2 1.9 1.4 100 3.0 2.5 2.5 1.0 1.0 320 1.8 1.9 1.4 0.8 0.9 500 1.6 1.8 1.3 0.7 0.8 1000 1.2 1.4 0.9 0.7 0.8 EBM, 850 °C, 1000 h Time (h) Exp kp% α= 0.39, Sa = 50 μm (× 10−7) Exp kpP600 (× 10−7) Calc kpraw (× 10−7) kpraw kpP600 Ψ 25 19 1.9 32 16.8 4.1 100 12 1.4 19 13.6 3.7 320 7.2 1.1 11 10 3.2 500 6.2 0.96 9 9.4 3.1 1000 4.4 0.70 7 9.2 3.2 Table 5
ISO 4287 Standard roughness (R) and waviness (W) parameters comparison of LBM and EBM samples for numerical modelling application.
As-built LBM surface
As-built EBM surface
Sa (μm) 7 ± 1 50 ± 2 R profile Rc (μm) 17 ± 3 181 ± 32 RSm (// built dir.) (μm) 54 ± 7 234 ± 21 RSm (⊥ built dir.) (μm) 93 ± 18 174 ± 12 W profile Wc (μm) 17 ± 6 117 ± 38 WSm (// built dir.) (μm) 629 ± 94 719 ± 311 WSm (⊥ built dir.) (μm) 378 ± 35 526 ± 51
Fig. 16. Roughness and waviness profiles along the (XZ) plane parallel to the built direction, (a) as-built LBM surface, (b) as-built EBM surface.
Table 4
of both surfaces seems to be periodic.
Knowing the amplitude (→z) and the periodicity of the signal along two directions (→ →x, y), the developed area can be depicted either with a sinusoidal or a “egg box” model as shown inTable 6. The two models are compared below. The surface area of the sinusoidal model can be expressed by function (19). = ⎛ ⎝ ⎛⎝ ⎞⎠+ ⎛⎝ ⎞⎠⎞⎠ ≤ ≤ ≤ ≤ f x y A π B x π C y ( ; ) 2 sin 2 . sin 2 . ; 0 x B ; 0 y C (19)
∫ ∫
= + + × ∂ ∂ ∂ ∂(
)
(
)
Sinusoidal surface area ratio
dx dy B C 1 . B C f x y x f x y y 0 0 ( ; ) 2 ( ; ) 2 (20) = + +
Crenation surface area ratio A
B C
1 2 (1 1) (21)
where A is the amplitude (Rc or Wc); B and C are wavelength para-meters associated with spatial parapara-meters (RSm or WSm) following→x
and→y directions. The surface area ratio of the sinusoidal modelling is defined with the double integral (20) and was numerically determined using Matlab software. The surface area ratio of the crenation model, as shown in the expression (21), can be easily determined. The most in-fluential parameter is the ratio of mean height parameter (Rc, Wc) to mean width (RSm, WSm). The roughness profile of the EBM sample has a higher amplitude and thus a higher surface area ratio of 4.6 against 2.9 for the LBM surface area ratio. These ratios are close to those found with experimental kpmanipulation inTable 4. (4.1 and 1.4 for EBM and
LBM respectively). The limitation of these models is the fact that the roughness parameters selected work best with a periodic roughness profile such as the one of a turning surface. This is why, the error on the determination of Rc or RSm is more important on a relatively rough surface with high and large peaks randomly present along the profile than on a smooth surface with a relatively low mean height parameter (Rc) and a high number of peaks.
As seen inFig. 15, there are powder particles spread over the surface of AM samples. A small amount is found dispersed on the as-built LBM sample and a large quantity on the entire surface of the as-built EBM sample. The roughness profile does takes these particles into account but was established with an optical method (focus variation micro-scope). This technique does not account for the whole morphology of spherical particles nor for the hidden opensurfaces as shown inFig. 17. Consequently, surface area ratio estimated could be more accurate. Therefore, a second estimation method for calculating the real surface area of the EBM raw surface was tested. A profile can be split into two elements. It can be seen as a superposition of the waviness profile, where high peaks and deep valleys have been filtered, and of powder particles added onto its profile, as explained inFig. 17. By using these approximations, the surface area ratio can be calculated by multiplying the factor 1.2–1.8 (ratios from EBM waviness profiles) by the factor 4.1 (sphere surface ratio) indicated inTable 6. This results in a surface area ratio ranging from 5 to 7, which is slightly higher than the ratio found with experimental kpmanipulation (i.e. 4.1,Table 4). This is consistent
with the fact that when the raw surface is described as a wavy surface with a maximum density of spherical particles on it, the surface area is maximized. In this way, it can be concluded that, for EBM samples, the roughness of their raw surface has a significant impact on the calcula-tion of the real surface and therefore on the determinacalcula-tion of its oxi-dation rate. Whereas this is not the case for raw-surface LBM samples and P600-ground surfaces. Hence, in terms of oxidation behaviour of rough surfaces, the EBM sample is not much different from the LBM sample. This is consistent with that the thickness of the oxide scales observed at the surface of the all samples was approximately the same. Roughness has significantly affects oxidation kinetics calculations but
Table 6
Surface area ratio via numerical modelling of periodic functions, sinusoidal (“egg box”) and crenation, calculated with roughness and waviness parameters as compared to spherical surface area ratio (square network of spheres lying on a flat surface).
Fig. 17. Schematic diagram showing the non-measured surface area during focus variation microscopy analysis of EBM raw surface and schematic views of its surface decomposition.


![Fig. 7. Arrhenius diagram, apparent k p comparison with literature results. Literature values from Greene and Finfrok [ 42 ], Jia and Gu [ 45 ], Peraldi et al](https://thumb-eu.123doks.com/thumbv2/123doknet/2992874.83781/9.892.470.830.463.989/arrhenius-diagram-apparent-comparison-literature-literature-finfrok-peraldi.webp)