HAL Id: hal-02511398
https://hal.archives-ouvertes.fr/hal-02511398
Submitted on 18 Mar 2020
HAL is a multi-disciplinary open access
archive for the deposit and dissemination of sci-entific research documents, whether they are pub-lished or not. The documents may come from teaching and research institutions in France or abroad, or from public or private research centers.
L’archive ouverte pluridisciplinaire HAL, est destinée au dépôt et à la diffusion de documents scientifiques de niveau recherche, publiés ou non, émanant des établissements d’enseignement et de recherche français ou étrangers, des laboratoires publics ou privés.
Laetitia Souchon, Stéphane Le Masson, Fabrice Flipo, Claude Gimenes
To cite this version:
Laetitia Souchon, Stéphane Le Masson, Fabrice Flipo, Claude Gimenes. Quantitative analysis and modelling of ICT energy impact in France. ICCCC 2008 : IEEE 2nd International Conference on Computers, Communications & Control, May 2008, Oradea, Romania. �hal-02511398�
QUANTITATIVE ANALYSIS AND MODELLING OF ICT ENERGY IMPACT IN
FRANCE
Laetitia Souchon
[1], Stéphane Le Masson
[2], Fabrice Flipo
[3]and Claude Gimenes
[3][1] France Telecom R&D – INT
28 chemin du vieux chêne BP 98 38243 Meylan - France
phone: +33 (0) 476764553, fax: +33 (0) 955351451, email: laetitia.souchon@orange-ftgroup.com [2] France Telecom R&D, stephane.lemasson@orange-ftgroup.com
[3] INT, fabrice.flipo@int-edu.eu
claude.gimenes@int-edu.eu
ABSTRACT
The energy demand of ICT (Information and Communica-tions Technology) may be considered as an important topic of the 21st century. Today, at a country level, for example in France, there is a lack of credible estimates concerning ICT energy demand and concerning its evolution in particular in terms of network equipments. Our PhD work may be a con-tribution to the know-how on this topic. In this paper, we give first an overview of our study's framework. In a second time, we focus our investigations on a quantitative analysis and its results. In a third time we give a description of the en-ergy model of the networks which is designed by FTR&D.
1. PRESENTATION OF THE STUDY'S
FRAMEWORK
• The environmental impact of ICT: the complexity On one hand, ICT seems to be favourable to the environ-ment through all immaterial activities and products it can generate. On the other hand, we have to take into account various negative consequences. They are coming from signi-ficant electric and electronic waste, proliferation of standby consumptions or full time electrical connections. In the same time and obviously, the energy demand is growing.
Today, we cannot be sure that the ICT influence on the en-vironment impact is positive. Nevertheless, ICT appears as a major actor for the contribution to the sustainable develop-ment. The interactions between ICT and sustainable devel-opment have given an emergent problematic, to the heart of numerous debates, forums and others initiatives [1].
• The ICT energy impact and the research
We may consider that the first investigations have been held at the Lawrence National Berkeley Laboratory in United States (1987) with the first complete measurements on PC power consumption [2]. Then estimates on office equip-ments consumption [3, 4, 5] and evaluations on these devices energy efficiency [6, 7] have followed.
All these works have enabled US-EPA (Environmental Pro-tection Agency) to launch Energy Star Label [8]. Worldwide campaigns for low standby consumptions have been imple-mented in order to control and to reduce the growing energy
ICT demand. Having in mind the numerous actions through-out the world in this field, it is worth to underline that most of the works concerns the end-use equipments. Indeed, it is more difficult to have a global idea and precise information on the infrastructure and its energy demand.
2.
TELECOM NETWORK CONSUMPTION
AND MEASUREMENTS
In this section, we present some methods and we give some results of measurements in order to cope with the lack of data in this field. The question is: how to quantify the ICT energy demand at different level – user, operator and coun-try – considering the network side?
2.1
The ICT energy demand at the user level
We have defined a methodology to quantify the energy cost of a telecom service, with FT operator example. We have implemented it to six main telecom services chosen in the residential access network: voice services (with fixed
tele-phone, mobile telephone and IP network), the data service with mobile telephone network, the Internet access provid-ing service, and the audiovisual service.
We resume our general approach by:
- identifying the network elements required for the con-sidered service
- determining energy consumption of these network elements - determining allocation keys when these elements are re-quired for several services
- quantifying, for each element, the energy ratio allocated to one subscriber
For example, the network elements needed for the Internet access providing service are shown in table 1, with their an-nual energy consumption:
Network elements Annual consump-tion (2006) DSLAM (residential district ratio) 162 GWh ATM / Ethernet / IP network
equip-ments
26 GWh Transverse elements: data centres, 704 GWh
transmission equipments, tertiary buildings
Table 1: First extract of energy balance leaded in FT
• DSLAM
DSLAM services are mainly required for Internet access providing, VoIP, and audiovisual services. According to DSLAM characteristics, two keys are chosen, to allocate en-ergy consumption depending on the service:
- Per service subscribers number - Average rate per subscriber
Considering these two factors for each service, we obtain for Internet access providing service ratio:
162 GWh x 64% = 104 GWh
This consumption has to be shared between all the sub-scribers (5.5 millions in 2006). Consequently, the ratio for one subscriber is about 19 kWh/year (2006).
• ATM / Ethernet /I P network equipments
In this part, three different telecom equipments are needed for Internet access providing service:
Equipment types Annual consumption (2006)
ATM network equip-ments
14.9 GWh BAS 3 GWh RBCI equipments 2 GWh
Table 2: Second extract of energy balance leaded in FT
One key is chosen so as to allocate energy consumption de-pending on the different concerned services: the total annual rate volume. Finally, we obtain:
51% x 14.9 + 95% x 3 + 99.9% x 2 = 13 GWh The ratio for one subscriber is about 2 kWh in 2006.
• Transverse elements: data centres, transmission equipments, tertiary buildings
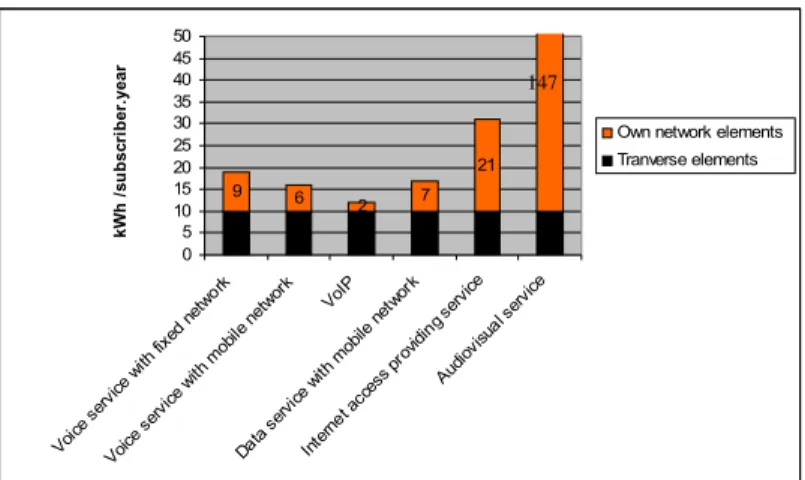
It is not possible to share precisely the transverse elements consumption between the different provided services because these elements are common. A proposed solution is a fixed energy ratio linked with one customer; we assume that this ratio is the same from one customer to another. Under this hypothesis, 10 kWh is allocated to each FT customer. Finally, supplying the Internet access providing service gen-erates a consumption equal to 31 kWh per subscriber and per year, from network side. The same approach has been used for the other main telecom services (see the results fig. 1).
Figure 1: Quantification of telecom services energy cost, from network side
The required energy consumption varies significantly accord-ing the service. Nevertheless, these results need a special at-tention. For example, calling with VoIP seems to consume less energy than calling with fixed network. It is not really true if we consider that the Internet access providing service is necessary to have access to VoIP.
It is interesting to compare the network energy load and the end-use equipments energy load. Let us underline without develop the controversy concerning this comparison. Once again and according to FT measurements, the ratio can vary significantly depending on the solicited service.
2.2
The ICT energy demand at the operator
level
What about global energy demand of the infrastructure needed to make use the ICT end-use equipments? An energy balance has been carried out in the framework of FT to quantify its total consumption.
First of all, cartography of equipments has been defined and eleven sub sectors have been delimited (see table 3).
Public telephone network switches
Base station (BTS and Node B) and mini racks Base station controller (BSC and RNC)
Network and Switching Sub-system (MSC, HLR, VLR…) DSLAM
ATM and IP networks: NAS, BAS, router, switches, brewers High data access network for companies
MDTN equipment Data centres
Transmission Network Tertiary sector
Table 3: Cartography of FT equipments
The global energy consumption of each sub sector has been quantified, from:
- Numerous measurements carried out in FTR&D - Experts consultations
- Data bases consultations on network equipments list For 2006, electric consumption of FT has been estimated to 1.9 TWh, that is to say 0.5% of total electric demand in France. The breakdown between sub sectors is given in fig-ure 2.
2.3
The ICT energy demand at the country
level
At the moment, two main results may be extracted from our study:
- Estimate of network power consumption allocated to resid-ential district, by extrapolation of FT results
- Estimate of total power consumption from French servers. Our attention has been focused on this area because the
10 10 10 10 10 10 9 6 2 7 21 0 5 10 15 20 25 30 35 40 45 50 Voice serv ice w ith fix ed n etwo rk Voice serv ice w ith m obile netwo rk VoIP Data servic e with mob ile n etwo rk Intern et a cces s pro vidin g ser vice Audio visua l ser vice kW h / su b sc ri b er .y ea r
Own network elements Tranverse elements
20% 18% 16% 12% 12% 12% 3% 3% 2% 2% 0%
Public telephone netw ork sw itches Tertiary sector
Data centers XDSL (DSLAM) Transmission Netw ork Base station and mini racks Mobile netw ork and Sw itching Sub-system
High data access netw ork for companies
ATM and IP netw orks MDTN equipment Base station controller amount of electricity used by servers and other Internet infra-structure has become an important issue these recent years.
2.3.1. French network power consumption
alloc-ated to residential district
The results which have been given in the case of FT sub-scribers can be extrapolated to other French subsub-scribers. For that, we suppose that:
- Others French operators use the same equipments types. - Equipments chain needed for a given service is the same from an operator to another.
Figure 2: Energy breakdown of FT consumption by subsector
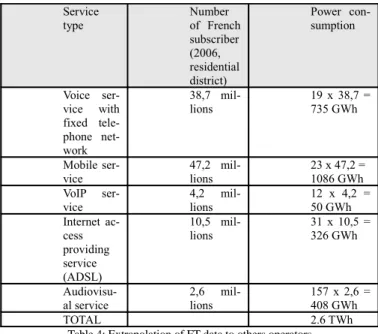
Under these hypotheses, extrapolation of FT data is made (see table 4). Service type Number of French subscriber (2006, residential district) Power con-sumption Voice ser-vice with fixed tele-phone net-work 38,7 mil-lions 19 x 38,7 = 735 GWh Mobile
ser-vice 47,2 mil-lions 23 x 47,2 = 1086 GWh VoIP ser-vice 4,2 mil-lions 12 x 4,2 = 50 GWh Internet ac-cess providing service (ADSL) 10,5 mil-lions 31 x 10,5 = 326 GWh Audiovisu-al service 2,6 mil-lions 157 x 2,6 = 408 GWh TOTAL 2.6 TWh
Table 4: Extrapolation of FT data to others operators
Thus, concerning the residential district, the French network power consumption is estimated to 2.6 TWh in 2006. Let us notice that the only Internet access is considered here, and not Internet servers which hosted web sites.
2.3.2. Estimate of total power consumption by
servers in France
Koomey [9] has estimated the total electric consumption used by servers in the U.S. and in the world, by combining measured data and estimates of power used by the most pop-ular servers, with data on the server installed base from IDC (http://www.idc.com).
We have suggested applying the Koomey method to French case. We have focused our study on servers and the infra-structure energy use associated with those servers (cooling, fans, and UPSs etc.). The market share for each of the most popular servers has been used to calculate a weighted aver-age power use per unit for each server class.
IDC's total installed base estimates for France are shown in table 5; they are split into three servers classes based on the cost of the system. These data include servers in both enter-prise and scientific computing applications. Upgrades to ex-isting servers are excluded. Volume servers are the most im-portant in the installed base; nearly 1 million of servers were installed in France in 2006, which represents 4 % of the worldwide servers.
Year Volume Mid-range High-end Total 2004 736 196 52 839 2 630 791 665 2005 835 159 50 901 2 511 888 571 2006 939 084 49 234 2 375 990 693
Table 5: Installed base servers in France
After having imputed power data to this base, total power consumption for all servers in France in 2006 is estimated to 2.1 TWh. Including cooling and auxiliary equipment in-creases that total to 3.1 TWh (24% rise compared to 2004) or nearly 1% of total electricity demand in France (see fig-ure 4). 1.3 1.7 0.2 0.2 0.2 0.2 0.9 1.1 0.0 0.5 1.0 1.5 2.0 2.5 3.0 3.5 2004 2006 T o ta l el ec tr ic it y u se ( T W h /y ea r)
Cooling and auxiliary equipment High-end servers
Mid-range servers Volume servers
Figure 4: Total electric use for servers in France in 2004 and 2006, including cooling and auxiliary equipments
2.4
The ICT and the energy efficiency
Following recommendations from Energy Star Label in 1993, works on low standby devices consumption have been generalized. At the moment, experts are focusing all their at-tention on Data Centres whose energy demand has become an important issue. Numerous initiatives tend to reduce the
OR
P: Equipments parks and
power measurements (sized data)
T: total traffic
C: global network energy
consumption
ΔP
ΔT
ΔC?
Data Centres power consumption. As some references: de-ployment of server virtualization, rightsizing of UPS, use of air conditioner economizer modes, installation of energy-effi-cient lighting…
If ICT energy consumption can be reduced, ICT has also an interesting potential to reduce global energy consumption, for example when it replace moves. Nevertheless, substitu-tion effects are ambivalent and hardly quantifiable. Relasubstitu-tion- Relation-ship between ICT and the environment is complex (10).
3. MODELLING AND METHODOLOGY
One of our PhD objectives consists in developing a tool which model FT network consumption. Two types of data are considered:
- Traffic data
- Equipments parks data related to devices power measure-ments.
This tool would enable to evaluate network consumption evolution, depending on traffic evolution or equipments parks modification over the next years. General approach is described in a first step. The second step which is under way consists on implementation software (Matlab).
3.1 Network dimensioning step
The major difficulty is to well understand relation between traffic and power to model it. In a general way, network is sized from traffic matrix, tools which enable to flow traffic on the different network nodes and bonds. Network power consumption depends on this dimensioning stage corres-ponding to complex algorithms. The problem is that this stage cannot be easily designed in terms of energy.
That's why, in our tool, we choose to use already sized data in order to have a more easily manipulated tool. This choice implies to operate and think with "delta", as schematized on figure 5.
Figure 5: Model simplification
3.2 Network segmentation
Another point has to be underlined. Because of different con-strains from a network to another (architecture, topology, traffic quantity …), we propose to operate network by net-work according to the following segmentation:
- Access network (star topology) - Collect network (ring topology) - Backbone network (mesh topology)
The approach consists in applying independently the scheme in figure 5 to each of network type.
Once these choices are made, the next step consists in model-ling in terms of energy the evolution of each type of network depending on the traffic evolution, thinking with "delta". In the current stage of the study, we can not develop this part yet; it will be set out at a later stage.
4. CONCLUSION
In this paper, we have given some results as a contribution to increase the know-how on ICT energy demand from net-work side, from a microscopic to a macroscopic point of view. We have presented the tool being developed in France Telecom to model energy consumption of its networks. Whereas supplying the Internet access providing service in-volves 31 kWh consumption per subscriber per year from network side, total power consumption by servers in France reaches 3.1 TWh per year.
Global ICT energy footprint in industrialized European coun-try is estimated to around 7% to 10% of the councoun-try demand (11). Over the next years ICT will become one of the most important electric consumption sectors. Consequently, we cannot ignore the energy impact and environmental impact of ICT area. Although the first research works are just 20 years old, we may notice that the awareness of energy issues has penetrated the consciousness of users recently. Unfortunately it is still not a priority for a lot of decision-makers.
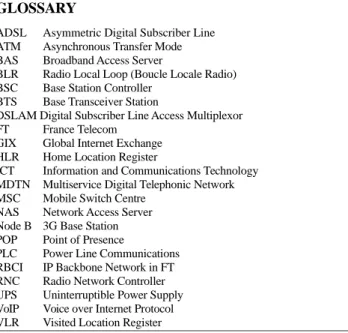
GLOSSARY
ADSL Asymmetric Digital Subscriber Line ATM Asynchronous Transfer Mode BAS Broadband Access Server
BLR Radio Local Loop (Boucle Locale Radio) BSC Base Station Controller
BTS Base Transceiver Station
DSLAM Digital Subscriber Line Access Multiplexor FT France Telecom
GIX Global Internet Exchange HLR Home Location Register
ICT Information and Communications Technology MDTN Multiservice Digital Telephonic Network MSC Mobile Switch Centre
NAS Network Access Server Node B 3G Base Station POP Point of Presence
PLC Power Line Communications RBCI IP Backbone Network in FT RNC Radio Network Controller UPS Uninterruptible Power Supply VoIP Voice over Internet Protocol VLR Visited Location Register
REFERENCES
[1] TIC21, World Summit on the Information Society: SMSI/WSIS: Geneva 2003- Tunis 2005
[2] Harris, J., J. Roturier, et al. (1988). Technology Assess-ment: Electronic Office Equipment. LBL-25558, Lawrence Berkeley Laboratory.
[3] Norford, L., Hatcher, et al. (1990). "Electricity Use in In-formation Technologies." Annual Review of Energy 1990: pp. 423-53.
[4] Piette, M. A., E. Joe, et al. (1991). Office Equipment En-ergy Use and Trends. LBL-31308, Lawrence Berkeley Laboratory.
[5] Koomey, J. G., M. A. Piette, et al. (1996). "Efficiency provements in U.S. Office Equipment: Expected Policy Im-pacts and Uncertainties." Energy Policy, vol. 24, no. 12, pp. 1101-1110.
[6] Ledbetter, M. and L. Smith (1993). Guide to Energy-Effi-cient Office Equipment. American Council for an Energy-Ef-ficient Economy, Washington, DC.
[7] Lovins, A. and H. Heede (1990). Electricity-Saving Of-fice Equipment, Competitek/Rocky Mountain Institute. [8] Johnson, B. and C. Zoi (1992). EPA Energy Star Com-puters: The Next Generation of Office Equipment. 1992 ACEEE Summer Study on Energy Efficiency in Buildings. [9] Koomey, J. G. (2007). Estimating total power consump-tion by servers in the U.S. and the world, Staff Scientist, Lawrence Berkeley National Laboratory and Consulting Pro-fessor, Stanford University: 31.
[10] Berkhout, F. and J. Hertin (2001). Impacts of ICT on Environmental Sustainability: speculations and evidence. Re-port of OECD.
[11] Aebischer, B. and J. Roturier (2006). "Electricité et In-ternet: le paradigme de l'iceberg." Bulletin de la Société