HAL Id: hal-00111621
https://hal.archives-ouvertes.fr/hal-00111621
Submitted on 19 Oct 2020
HAL is a multi-disciplinary open access
archive for the deposit and dissemination of
sci-entific research documents, whether they are
pub-L’archive ouverte pluridisciplinaire HAL, est
destinée au dépôt et à la diffusion de documents
scientifiques de niveau recherche, publiés ou non,
The preferred fatigue crack propagation mode in a M250
maraging steel loaded in shear
C. Pinna, V. Doquet
To cite this version:
C. Pinna, V. Doquet. The preferred fatigue crack propagation mode in a M250 maraging steel loaded
in shear. Fatigue & Fracture of Engineering Materials & Structures, Wiley-Blackwell, 1999, 22 (3),
pp.173-183. �10.1046/j.1460-2695.1999.00161.x�. �hal-00111621�
The preferred fatigue crack propagation mode in a M250
maraging steel loaded in shear
C . P I N N A1a n d V. D O Q U E T
Laboratoire de Mécanique des Solides U.M.R. CNRS, Ecole Polytechnique 91128 Palaiseau cedex, France, 1Present address:
Sheffield University, Mechanical Engineering Department, Mappin Street, Sheffield S1 3JD, UK
ABSTRACT Macroscopic torsional fatigue cracks are shown to propagate in shear, in plain tubular specimens, in the
M250 maraging steel, for stress ranges from 90% down to 40% of the yield stress. This cannot be explained in terms of microcrack coalescence for the smallest stress range, for which microcracks are scarce. The kinetics and mechanisms of mode II fatigue crack growth are thus investigated, using precracked CTS or tubular specimens. For a high DKII ,
slowly decelerating mode II propagation takes place for a distance that increases with DKII before branching occurs. Friction stresses along the crack flanks shield the applied load and explain this deceleration. An inverse analytical procedure is used to derive the effective stress intensity factor, allowance being made for friction effects, from displacement profiles measured from microgrids using a scanning electron microscope. The measured crack growth rates correlate much better with the effective stress intensity factor than with the nominal DKII value. The crack paths observed in torsion are discussed in terms of maximum crack velocity.
Keywords torsional fatigue, crack, mode II, propagation, friction.
a=crack length ap=length of precrack
c0=uniform friction stress along the crack flanks
rap=length of the monotonic plastic zone ahead of the crack tip
rbp=length of the monotonic plastic zone behind the crack tip
T=non-singular term of the stress field parallel to a crack
[uII]=crack flanks relative sliding displacement
DKnomII =nominal amplitude of the mode II stress intensity factor
DKeffII=effective amplitude of the mode II stress intensity factor
D[uII]=amplitude of crack flanks relative sliding displacement
it seems that an independent mode II or III development I N T R O D U C T I O N
of a fatigue crack is possible, provided the range of the stress intensity factor lies above a given threshold. A Although uniaxial fatigue cracks usually grow in mode I
in polycrystals, shear mode propagation has been similar conclusion was derived by Otsuka et al. for a 7075-T6 aluminium alloy from threshold measurements observed in a number of materials under high- and
low-amplitude torsional loading. For materials, e.g. stainless in mixed mode on precracked specimens:2for low DK II
values, branching occurred, whereas for higher values, steels, in which shear mode propagation is observed only
in the range of low cycle fatigue,1this might partly be mode II growth prevailed. On the other hand, a number
of studies devoted to the determination of propagation due to microcracks coalescence. However, in
high-strength materials, e.g. Inconel 718,1macroscopic shear thresholds in mixed mode (see, e.g. Ref. 3) have shown
that some mode II propagation from a precrack tip was cracks are also formed in high-cycle fatigue, a domain
where the explanation given above does not hold. Thus, possible, although terminating in crack arrest, for DKII
values below a threshold, above which branching occurred.
Mode II as well as mode III crack growth kinetics have been shown to depend largely on crack flanks frictional interactions4,5 responsible for crack
deceler-ation, branching or arrest, at constant nominal DKIIor
DKIII. The pertinent parameters for the delimitation of
the domain(s?) in which shear or opening mode propa-gation are preferred are obviously not these nominal values but rather the effective values.
The present study takes advantage of the plane geometry associated with mode II propagation, that allows direct observation of a crack tip and its flanks, to measure the effective DKIIand find an intrinsic relation with the crack growth rate for a M250 maraging steel. The crack propagation trajectories observed in torsional fatigue in this material are then analysed in terms of maximum velocity. The apparent contradiction in the literature concerning the conditions for which mode II can be observed is then discussed.
Fig. 1 Specimens geometry. (a) Pierced tubular specimen (plain E X P E R I M E N T A L P R O C E D U R E
tubular specimens are similar, except for the hole in the gauge
The material investigated is a M250 maraging steel length). (b) CTS specimen (dimensions in mm).
(Z2NKD 18-8-5, R0.2=1910 MPa, Ru=1973 MPa). It
is used for aeroplane turboreactors shafts that support
specimens (tested on a conventional push–pull machine), both tensile/compressive and torsional loads in service. and R=−1 for tubular specimens, tested in reversed Its chemical composition is (in wt%): Ni 18.29, Co 8.13,
torsion on a biaxial testing machine. During some of the Mo 4.76, Ti 0.45, Al 0.1, C 0.008, Ca<0.05, B <0.0024.
tests performed on pierced tubular specimens, a static Three types of specimens are used in this study: plain
compressive stress of 150 MPa was superimposed on the tubular specimens; tubular specimens with a circular
cyclic shear stress in order to enhance crack flank friction. hole of 1 mm in diameter in the middle of the gauge
For CTS specimens, the expression for KII obtained
length [Fig. 1(a)]; and compact-tension-shear (CTS)
by Smith and Smith5through finite element calculations specimens [Fig. 1(b)].
was used, whereas for tubes, the expression of KIIgiven
Stress-controlled reversed torsion tests were
per-by Murakami6was used for a circumferential through-formed on plain tubular specimens in order to
charac-crack in a cylindrical shell subjected to torsion which terize the failure mode at various stress ranges.
incorporates a correction for curvature. Smith and Smith5stressed the influence of precracking
The size of the monotonic plastic zone was estimated techniques on further mode II propagation. According
by applying the von Mises criterion to the plane stress to their recommendations, the precracking of CTS and
crack tip stress field.7Ahead of the crack tip:
pierced tubular specimens was conducted at an R ratio of 0.3, under constant and low DKI(15 MPa앀m), though
rap= 3 2p
A
KeffII,max syB
2not too close to the mode I threshold, as a compromise between two requirements: i.e. low residual stresses at
and behind the crack tip: the crack tip and limited roughness of the precrack.
Approximately 1 mm-long precracks were thus
pro-pbp= 4 2p
A
KeffII,max syB
2duced on each side of the hole in tubular specimens as well as from the notch tip in CTS specimens.
Square-shaped metallic microgrids, with a 5 mm pitch, were such that small-scale yielding conditions prevailed for all our tests (see below for the definition of Keff
II).
produced by microelectrolithography, were then laid on
the specimens ahead of the crack tip and along the Cyclic mode II tests were periodically interrupted, and CTS or pierced tubular specimens transferred to a crack flanks.
Mode II crack propagation tests were then carried out special tension and torsion loading frame that was able to work inside the chamber of a scanning electron at 0.5 Hz with Kmin/Kmax equal to zero for the CTS
Table 1 Results of reversed torsion tests on plain tubular microscope.8 The relative displacements of the crack
specimens
flanks were then measured at both Kminand Kmax, using microgrids as reference marks, and the crack propagation
Dt/2 (MPa) 900 700 550 400 395
mechanisms as well as the interactions between the crack and microstructure could be observed. N
f(cycles) 500 3000 14000 116 000 199 000
A single test on a CTS specimen was performed entirely in situ at a very low frequency (0.025 Hz), partly in air and partly in the secondary vacuum of the SEM chamber.
R E S U L T S
Reversed torsion tests on plain tubular specimens
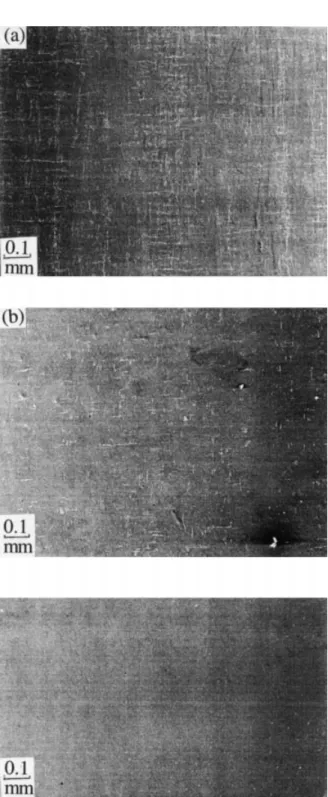
The fatigue lives measured in reversed torsion on plain tubular specimens are given in Table 1. The main crack trajectories as well as SEM pictures of the network of microcracks in representative areas of the same specimen surfaces, at fracture, are shown in Figs 2 and 3. For the three highest stress ranges, a transverse crack more than 14 mm long has developed in shear mode until a struc-tural instability produced branches that were observable
Fig. 3 Fatigue damage in reversed torsion, in plain tubular Fig. 2 Main crack trajectories in reversed torsion, in plain tubular
specimens. (a) Dt/2=900 MPa, (b) Dt/2=700 MPa, (c) Dt/2= specimens, at failure. (a) Dt/2=900 MPa, (b) Dt/2=700 MPa, (c) Dt/2=550 MPa.
at each end of the crack. For the highest stress range (approximately ±90% of the shear yield stress), the network of cracks is very dense and equally distributed on the two maximum shear strain planes (longitudinal and transversal). Coalescence phenomena have probably contributed to the formation of the main transverse crack. For the intermediate stress range (±70% of the yield stress), microcracks are less numerous, especially in the longitudinal direction, whereas for the lowest amplitude (±55% of the yield stress), hardly any micro-cracks could be observed. In the latter case, it is clear that the formation of a macroscopic shear crack cannot be explained by coalescence phenomena.
For a smaller amplitude (±400 MPa), the crack initiated along a transverse plane, and after developing over 75 mm in stage I, branched to grow in the opening mode as usually observed in stage II [see Fig. 2(d)].
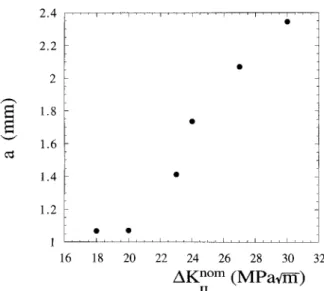
Fig. 4 Lengths of cracks at the onset of branch development in However, after a mode I growth over 1.6 mm, the crack
CTS specimens.
branched again to propagate transversally anew for more than 10 mm [the crack profile is truncated in Fig. 2(d)].
A similar test was performed again, with periodic inter- quantity of fretting debris continuously comes out of the crack flanks and has to be removed to allow observation. ruptions, and observations of the specimen noted, in
order to see if this rather unusual behaviour would occur Wear is also evident from the smeared-out fracture surfaces on which 1 mm ‘furrows’ parallel to the crack again. Once again, the main crack was observed to grow
first at 45° to the axis, at an increasing rate, and to propagation direction can be observed [Fig. 7(a)]. Such furrows were also observed on the fracture surfaces of branch to a transverse direction when its length was
3 mm and its growth rate reached #0.1 mm/cycle. The the plain tubular specimen tested in torsion at ±900 MPa, much better preserved from wear thanks to accelerating shear mode propagation finally led to failure.
a faster crack propagation (due to stress control, instead of constant DK) [Fig. 7(b)]. They could have been formed
Mode II crack propagation tests
by the ploughing action of hard particles embedded in one of the crack flanks and thus moving to and fro.
Crack propagation mechanisms
The tests carried out on CTS specimens under constant However, the length of these furrows (50–100 mm) is generally much higher than the amplitude of the relative DKIIvalues ranging from 18 to 30 MPa앀m gave rise to
some mode II crack development up to a certain length, sliding displacement (at most 20 mm, close to the notch root), so that an important dragging of the particles after after which branching occurred (Fig. 4).
Under the SEM, some local opening displacements they are detached has to be assumed. induced by the asperities of the crack flanks can be
observed, essentially in the precracked part, that shows
Mode II crack growth kinetics
a±45° zig-zag profile [Fig. 5(a)], but most of the crack,
and above all the crack tip, remained closed. The kinetics of mode II crack growth under constant DKII determined on CTS specimens are reported in
The profile of the cracks which developed in mode II
is generally very flat [Fig. 5(b)]. The cracks follow the Fig. 8(a), in which the precrack length for each specimen is indicated in brackets. It can be seen that the crack coplanar slip bands formed at the crack tip, except in
the presence of strong microstructural obstacles (the propagation rates do not scale with the applied nominal DKIIbut are very dependent on the precrack length, ap.
precise nature of which could not be determined). The
activation of a second slip system (on which the shear The crack growth rate for DKII=20 MPa앀m and ap=
910 mm is higher than for DKII=23 MPa앀m and ap=
stress, evaluated from the elastic stress field at the crack
tip, is less than on the coplanar system) permits the 1078 mm. The same is true for DKII=24 MPa앀m,
ap=936 mm, compared to DKII=27 MPa앀m, ap=
bypassing of these obstacles and generates occasional
‘steps’, 5–15 mm high, along the crack flanks. These steps 1109 mm. This is because the nominal DKII does not integrate the various friction forces that result from provide the main resistance force to the sliding
displace-ment of the crack flanks under load (Fig. 6), but tend to various precrack lengths and roughness.
If the crack growth rates are very sensitive to the be worn out progressively by sliding friction. A large
M 2 5 0 M A R A G I N G S T E E L 177
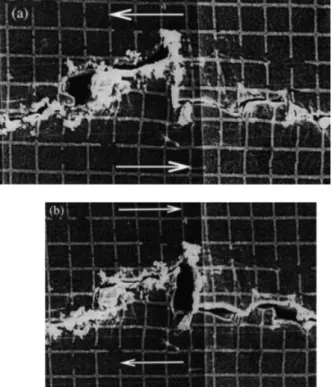
Fig. 5 Typical aspects of a crack loaded in
shear, as seen in the SEM. (a) Precracked part. (b) Mode II part. (Pitch of the grid: 5 mm.)
Fig. 7 Typical aspects of fracture surfaces. (a) ‘Furrows’ on the Fig. 6 Contact of crack flanks at asperities under shear loading. fracture surface of a CTS specimen. (b) Elongated voids on the
(Pitch of the grid: 5 mm.) fracture surface of a plain tubular specimen. The direction of propagation is indicated by arrows.
precrack length, they do not, however, vary very quickly with the length of the mode II crack; there is almost no discernable slowing down before branching. This is
because the smooth mode II cracks, except for the under vacuum (see Ref. 9). Second, the crack growth rate in air at the low loading frequency used (0.025 Hz) occasional ‘steps’ formed along their flanks, do not
contribute as much to friction forces as the rough was approximately twice as high as for 0.5 Hz for the same nominal DKII, and this made mode II growth more precracks. A deceleration was, however, discernable at
higher DKII (37 MPa앀m), when a crack kept growing stable; instead of branching at a final length of 950 mm, as expected from Fig. 4, the crack kept growing in in the coplanar direction for more than 5 mm without
branching [Fig. 8(b)]. mode II (though slowly decelerating) for more than 3 mm. Frequency effects associated with hydrogen Environment effects were observed during the test
entirely performed on the in situ loading frame for embritlement have been reported for mode I propagation in a maraging steel10 and may perhaps affect mode II
DKII=27 MPa앀m. First, the crack growth rate under
vacuum was only half of the rate in air, which may be propagation as well. Further investigations on that point are in progress.
Fig. 8 Kinetics of mode II crack propagation as measured in CTS
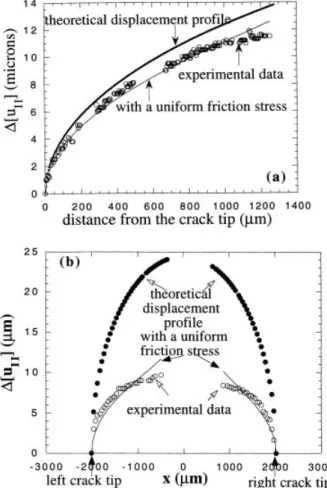
Fig. 9 Amplitude of relative tangential displacements along the
specimens for a constant nominal DKII. (a) For values of DKII
crack flanks. (a) In a CTS specimen, and (b) in a tubular specimen, between 18 and 30 MPa앀m. (b) For DKII=37 MPa앀m.
with a superimposed static compression stress of 150 MPa.
Crack flank displacements
Two of the profiles of relative sliding displacements, measured on CTS or precracked tubular specimens, along the crack flanks are shown in Fig. 9, together with the theoretical profiles associated with a nominal DKII, i.e. for plane stress:7
D[uII]=8DKII/r
E√2p where [uII]=u(p)−u(−p)
and D[uII]=[uII]max−[uII]min
(1)
Even though the measured displacement varies as앀r beyond the plastic zone (Fig. 10), the measured tudes of mode II displacements are less than the ampli-tudes evaluated with the nominal DKII, and the
attenuation, due to friction force is especially important Fig. 10 Displacement profile versus the square root of the distance when a compressive stress enhances interactions of the to the crack tip.
crack flanks [Fig. 9(b)].
The stress field at the crack tip, related to the
displace-ment field through the constitutive equations, is thus be determined. Note that it would be wrong to fit the experimental displacement profile with Eq. (1) in which also shielded by friction. The effective crack driving
only along the precrack and the mode II crack flanks, growth rate. This is in line with the conclusions of Otsuka et al.2who also studied long mode II cracks. By
and not along the notch.
contrast, Wang and Miller11observed an acceleration of
stage I–mode II+III crack growth in 1.99%NiCrMo
Plot of the crack growth rates versus DKIInom steel, in the presence of a mean shear stress, in torsional
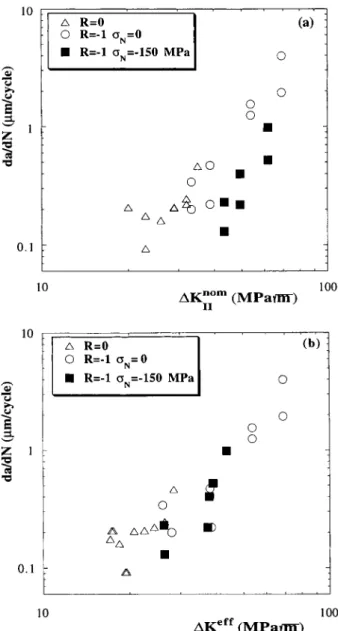
fatigue. The reason for this detrimental effect, observed The crack growth rates measured on precracked tubular
specimens or CTS specimens, for R=−1 and 0, respect- mainly on short cracks, might be because a mean shear stress could assist the microcracks in their crossing of ively, are shown in Fig. 11(a) versus nominal DKII. A
clear lack of correlation appears, especially when the grain boundaries, especially difficult in torsion,12,13 by enhancing the stress concentration ahead of the slip data obtained with a static compressive stress are
com-pared to those of pure mode II, because the enhancement band emanating from the crack tip and blocked by the grain boundary.
of friction is not taken into account by the nominal DKII. Besides, contrary to mode I propagation, there
seems to be no effect of the R ratio on the mode II crack
Determination of the effective range of the stress intensity factor
A semianalytical inverse method has been developed to deduce DKeff
II from the measured displacement profiles.
This was described in detail in Ref. 14, and only useful results will be recalled here. The calculations consider cracks of length 2a in infinite plates loaded by a shear force Q∞ chosen so as to ensure the equality of the nominal stress intensity factors in the real and idealized geometries.
Analytical expressions of the displacement profiles along the crack flanks due to the superposition of Q∞, and of a uniform friction stress c0present over a portion
a−a0of the crack in the case of CTS specimens, a−a0
and a−a1on each side of the hole in tubular specimens
were obtained. The friction stress c0is then adjusted so
as to best fit the experimental displacement profiles considering only the points in the K dominance zone of Fig. 10. The points that are too close to the crack tip and for which plastic strain predominates, as well as those situated too far away for which higher order terms become important, are thus not taken into account. The assumption of a uniform friction stress leads to a satisfying description of measured displacements, as illus-trated in Fig. 9.
The value of c0determined by this procedure is then
put into the expression of DKeffII; i.e. for CTS specimens:
DKeffII 앀pa=
C
Q∞−2c0A
√a2−a20 pa +1− 2 parctanA
S
a+a0 a−a0BBD
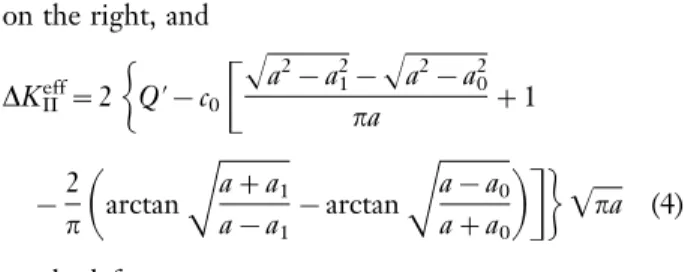
(2) and for tubular specimens, allowance is made for the different crack lengths on each side of the hole: DKeffII=2G
Q∞−c0C
√a2−a20−√a2−a21
pa +1
Fig. 11 Crack growth rates versus (a) nominal and (b) effective −2
p
A
arctanS
a+a0 a−a0 −arctanS
a−a1 a+a1BDH
앀pa (3)on the right, and DKeffII was close to the threshold for branching (estimated
as 17 MPa앀m) from the beginning of the tests, so that its fluctuations were of the same order of magnitude as DKeffII=2
G
Q∞−c0C
√a2−a2
1−√a2−a20
pa +1 the precision on DKeff. Additional measurements under
conditions giving rise to a longer mode II propagation path, e.g. the low-frequency tests mentioned above, −2 p
A
arctanS
a+a1 a−a1 −arctanS
a−a0 a+a0BDH
앀pa (4)should illustrate this effect more definitely.
The values of c0determined on the tubular specimen
on the left.
for DKII=33.3 MPa앀m are close to those measured on
The measurement precision of the displacement
CTS specimens, but above 38.7 MPa앀m, the gen-amplitude is ±0.6 mm. The precision on DKeffII is thus
eralized asperity-induced opening of the crack explains approximately±1.5 MPa앀m. The values of DKeff
II
deter-the reduction of c0to zero. Such an opening is prevented,
mined by this procedure for CTS specimens are reported
on specimen, by the presence of a compressive stress in Table 2(a), for two tests carried out under constant
that is responsible for a marked increase in the friction DKII, and for a test under increasing and then decreasing
stress, c0. The crack growth rates are plotted versus DKII. Table 2(b) displays results concerning precracked
DKeffII in Fig. 11(b), in which the scatter is clearly less
tubular specimens loaded in pure shear or with a static
than in Fig. 11(a). compressive stress.
Values of DKeff
II do not vary very significantly during
the tests performed on CTS specimens at 20 MPa앀m
D I S C U S S I O N and 23 MPa앀m, which is consistent with the limited
variations in the crack growth rates observed during Tests on precracked CTS or tubular specimens have shown that when DKeffII<17 MPa앀m, mode II
propa-these tests [see Fig. 8(a)]. A decrease of DKeffII down to a
threshold below which mode I crack growth becomes gation gives way to the development of a branch crack in mode I. However, in plain tubular specimens submit-more favourable is, however, believed to justify the final
branching. Here, this decrease is not clear, because ted to reversed torsion, microstructurally long cracks
Table 2 Values of the friction stress and
effective stress intensity factor determined for (a) CTS and (b) tubular specimens (a)
CTS DKnomII DKeffII
specimen (MPa앀m) a (mm) c0(MPa) (MPa앀m)
8 20 965 23 17.5 8 20 1000 31 17.3 9 23 1184 37 19.3 9 23 1278 31 19.5 10 23 973 58 17.1 10 26 1039 72 18.4 10 29 1226 60 22.5 10 32 1373 50 26.5 10 35 1864 56 28.5 10 32 2140 56 24.4 10 29 2310 57 20.7 (b) c0(MPa) DKeffII Tubular DKnom II sN 2a
specimen (MPa앀m) (MPa) (mm) left right left right 1 33.3 0 4153 26 38 28.0 26.1 1 38.7 0 5372 0 2 38.6 38.2 1 53.7 0 8012 0 0 53.7 53.7 1 69 0 10372 0 0 69.0 69.0 2 43.4 −150 4035 96 94 26.5 26.3 2 49.3 −150 5207 65 60 37.5 38.0 2 61.7 —150 6295 110 86 39.1 43.7
have been observed to propagate in shear for much mode is the fastest only for intermediate crack depth, and thus intermediate K-values.
smaller stress intensity factors. (Due to the unknown
three-dimensional aspect of naturally initiated cracks in In the lower part of domain 2, branching would not occur simply because the stress intensity factor of the tubular specimens, the evaluation of KII cannot be very
accurate. But using the expression of KIIgiven by Kassir branch would be less than the threshold value for mode I
propagation, while in the upper part of domain 2, the and Sih15 for an elliptical crack in an infinite plate in
shear, and thus neglecting the correction for finite development of a branch could be possible, although slower than the mode II propagation of the main crack. thickness of the tube wall and the gradient of the shear
stress, which can be advocated due to the shallowness of The materials for which mode II was reported to occur below a given threshold in DKII probably have such a
natural cracks in torsion, we find that for a 300 mm-long
crack, and a stress range of ±550 MPa, the value of domain, and crack arrest, as in Ref. 3 is observed when-ever DKeffII, initially in domain 2, decreases down to the
DKIIis about 6 MPa앀m, assuming an aspect ratio of 0.2.)
A tentative explanation will be proposed, based on the limit of domain 1. For the 7075-T6 aluminium alloy tested by Otsuka et al.,2in which mode II propagation
idea put forward by Hourlier et al.,16that the crack path,
in multiaxial loading, is determined by a maximum is reported to occur above a given DKII, the mode I and mode II crack growth curves might be positioned similar velocity criterion. The contradiction mentioned above
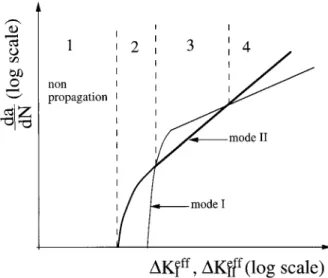
could be solved if, in this maraging steel—and perhaps to the maraging steel, thus defining four domains, but domain 2 might be very narrow and have been passed in some other materials depending on their mode I/
mode II crack growth kinetics–there existed two distinct unnoticed (the crack monitoring system used in Ref. 2 is not specified). Note that the zig-zag path of nominally domains (domain 2 and 4 in Fig. 12), bounded in DKeff
II
values, in which mode II is faster, separated by a domain mode I cracks often observed at low DKIvalues [see, e.g.
Figure 5(a)] shows that shear mode propagation is pre-where mode I prevails (domain 3). Note that the growth
rates for the two modes must not be compared for equal ferred at the local scale in this regime. This also supports the existence of domain 2.
DKeffI and DKeffII. Rather, the growth rate corresponding
to the mode I stress intensity factor for an incipient The value of 17 MPa앀m determined in the case of a maraging steel represents the limit between domains branch crack at the tip of a mode II crack should be
compared to the growth rate of the main crack, and 4 and 3.
The unusual crack path observed in reversed torsion vice versa.
Figure 12 is reminiscent of fig. 9(a) in Ref. 17, where for a stress range of 400 MPa is in fact perfectly consist-ent with the scheme of Fig. 12. After crack initiation Brown et al. plot the growth rates as a function of crack
depth for the three stages in the crack development and stage I growth (domain 2), the limit of domain 3 was reached and branching occurred. Then, as a result likely to be observed in torsional fatigue, at a given stress
range (stage I and III correspond to shear modes, and of the accelerating mode I propagation, the limit of domain 4 was subsequently reached, whence the return stage II to the opening mode) and where the opening
to the shear mode. This point of view is supported by the value of the mode I crack growth rate just before branching: 0.1 mm/cycle, which corresponds to the mini-mal mode II crack growth rate measured on precracked CTS specimens (see Fig. 11).
The crack paths in reversed torsion for stress ranges higher than 550 MPa are more difficult to explain on the basis of Fig. 12. The fact that cracks develop entirely in shear mode, from initiation to failure, for amplitudes above 550 MPa, in plain tubular specimens, suggests that the shear mode is always the fastest in these conditions. [In the same way, in fig. 9(b) of Ref. 17 which was plotted for high-amplitude torsional loading, shear mode crack growth is faster than mode I–stage II crack growth, in the whole range of crack depth.] In fact, it was shown that mode I crack growth is not uniquely correlated with the stress intensity factor, but can be affected by the
T stress (a non-singular stress parallel to the crack18), Fig. 12 Hypothetical layout of mode I and II crack growth curves
provided that the applied stress level is a substantial
in the maraging steel and schematic delimitation of four domains
Miller and Brown19). In torsion, the second principal calculated effective stress intensity factors than with the
nominal DKIIvalues. stress generates a cyclic T stress, 180° out-of-phase with
the opening stress. Then, T stress effects on mode I A tentative explanation of the crack paths observed in this material in plain tubular specimens in torsional crack growth can be expected in this maraging steel, for
shear stresses higher than 500 MPa. But the sense of fatigue is proposed based on a maximum velocity cri-terion. It is suggested that for low-stress ranges, for this effect (that is acceleration or retardation) is not
known (T stress effects seem to depend on the material which mode I kinetics are uniquely determined by DKeffII, it crosses the mode II kinetics twice, defining two
properties,20 and data on cyclically softening materials
are missing, to the authors knowledge). A careful examin- distinct ranges of DKeffII, in which mode II is faster than
mode I. For higher amplitudes, however, the mode I ation of the mode I crack growth kinetics measured in
tubular specimens of mild steel during reversed torsion kinetics would be T stress dependent, and, in the case of reversed torsion, slower than the mode II kinetics in tests performed at various stress ranges by Pook and
Denton,21suggests a deceleration, at a given DKI, when the whole range of DK values, this explains why cracks
develop in shear mode from initiation to failure, under the stress range—and thus the T stress range—increases.
If the tendency was similar in the maraging steel, the these conditions. curve corresponding to mode I growth in Fig. 12 would
be shifted to the right at high stress ranges, so that it
Acknowledgement
would never cross the mode II curve. This would make
the maximum velocity criterion coherent with the The financial support of this study was provided by SNECMA and CNRS.
observed crack paths.
An attempt was made to prove the retardation effect associated with the cyclic T stress: a pierced tubular
R E F E R E N C E S specimen was loaded in low-amplitude repeated torsion
so as to produce 1 mm-long precracks at 45° to the axis 1 D. F. Socie (1987) Fatigue damage maps. In: Fatigue 87, 3rd on each side of the hole. It was then loaded in reversed Int. Conference on Fatigue and Fatigue Threshold, University of
Virginia (Edited by Ritchie and Starke), EMAS, Wareley, Vol. 2,
torsion at±525 MPa so as to measure the mode I crack
pp. 599–616.
growth kinetics at this stress range. However, the cracks
2 A. Otsuka, K. Mori and K. Togho (1987) Mode II fatigue crack
branched at once and propagated in shear mode. Mode I
growth in aluminium alloys. In: Current Research on Fatigue
propagation seems thus impossible in precracked tubular
Cracks, Current Japanese Materials Research, Elsevier, London,
specimens submitted to reversed torsion above 52% of Vol. 1, pp. 149–180.
the yield stress. 3 G. Hua, N. Alagok, M. W. Brown and K. J. Miller (1985)
Growth of fatigue cracks under combined mode I and mode II loads. In: Multiaxial Fatigue, ASTM-STP 853, pp. 184–202.
C O N C L U S I O N S
4 E. K. Tschegg and S. E. Stanzl (1988) The significance of sliding mode crack closure on mode III fatigue crack growth.
Torsional fatigue cracks propagate in shear mode, in
In: Basic Questions in Fatigue, I (Edited by J. T. Fong and R. J.
plain tubular specimens of M250 maraging steel, for
Fields), ASTM STP 924, Philadelphia, pp. 214–232.
stress ranges from 90% to 40% of the yield stress. This
5 M. C. Smith and R. A. Smith (1988) Toward an understanding
cannot be explained in terms of microcrack coalescence of mode II fatigue crack growth. In: Basic Questions in Fatigue, for the smallest stress range, for which microcracks are I (Edited by J. T. Fong and R. J. Fields), ASTM STP 924,
Philadelphia, pp. 260–280.
scarce. Furthermore, mode I propagation is unstable in
6 Y. Murakami (1987) Stress Intensity Factors Handbook, Vol. 2.
precracked tubular specimens submitted to reversed
tor-Pergamon Press.
sion, for stress ranges higher than±525 MPa.
7 D. Franc¸ois, A. Pineau and A. Zaoui (1993) Comportement
Mode II crack growth was observed to occur for
Me´canique des Mate´riaux, Herme`s.
substantial distances (up to 5 mm) in precracked CTS 8 V. Doquet, D. Caldemaison and T. Bretheau (1994) Combined specimens under small-scale yielding conditions. Low- tension and torsion cyclic tests inside a scanning electron frequency testing accelerates mode II propagation and microscope. In: Proceedings of the Fourth International Conference
on Biaxial and Multiaxial Fatigue, St Germain en Laye, Vol. II,
makes it more stable. Friction stresses along the crack
pp. 19–26.
flanks shield the applied load and are responsible for a
9 F. Bowden and D. Tabor (1959) Friction et Lubrification,
very progressive deceleration leading to crack branching
Dunod, Paris.
when the effective stress intensity factor (deduced by an
10 G. Clark (1986) Fatigue at low growth rates in a maraging
inverse method from the measured displacement profiles)
steel. Fatigue Fract. Engng Mater. Struct. 9(2), 131–142.
decreases down to 17 MPa앀m. The measured crack 11 C. H. Wang and K. J. Miller (1991) The effect of mean shear growth rates, in pure mode II as well as with a superim- stress on torsional fatigue behaviour. Fatigue Fract. Engng Mater
Struct. 14, 293–307.
12 V. Doquet (1997) Crack initiation mechanisms in torsional 17 M. W. Brown, K. J. Miller, U. S. Fernando, J. R. Yates and D. K. Suker (1994) Aspects of multiaxial fatigue crack propa-fatigue. Fatigue Fract. Engng Mater. Struct. 20, 227–235.
13 V. Doquet (in press) Micromechanical simulations of Stage I gation. In: Proc. 4th Int. Conference Biaxial/Multiaxial Fatigue, Saint Germain en Laye, Vol. 1, pp. 3–16.
fatigue crack growth under multiaxial loading. In: Small Fatigue
Cracks: Mechanics and Mechanisms (Edited by K. S. Ravichandran, 18 M. B. Williams (1957) On the stress distribution at the base of a stationary crack. J. Appl. Mech. 24, 109–114.
R. O. Ritchie and Y. Murakami), Elsevier Science.
14 C. Pinna and V. Doquet (1997) Quantification of friction effects 19 K. J. Miller and M. W. Brown (1985) Mode I fatigue crack growth under biaxial stress at room and elevated temperature. during mode II fatigue crack propagation in a maraging steel.
In: Proceedings 5th Int. Conference Biaxial/Multiaxial Fatigue and In: Multiaxial Fatigue, ASTM STP 853, Philadelphia, pp. 135–152.
Fracture (Edited by E. Macha and Z. Mro` z), Cracow, Poland,
Vol. 2, pp. 97–113. 20 H. Kitagawa, R. Yuuki, K. Togho and M. Tanabe (1985) DK-dependency of fatigue crack growth of single and mixed mode 15 M. K. Kassir and G. C. Sih (1966) Three dimensional stress
distribution around an elliptical crack under arbitrary loadings. cracks under biaxial stress. In: Multiaxial Fatigue, ASTM STP 853, Philadelphia, pp. 164–183.
J. Appl. Mech. 33, 601–611.
16 F. Hourlier, H. d’Hondt, M. Truchon and A. Pineau (1982) 21 L. P. Pook and K. Denton (1972) Fatigue crack growth in thin walled mild steel cylinders loaded in torsion. Int. J. Fracture Fatigue crack path behavior under polymodal fatigue. In:
Multiaxial Fatigue (Edited by K. J. Miller and M. W. Brown), Mech. 8, 118–120.