HAL Id: hal-01492429
https://hal.archives-ouvertes.fr/hal-01492429
Submitted on 19 Mar 2017
HAL is a multi-disciplinary open access
archive for the deposit and dissemination of
sci-entific research documents, whether they are
pub-lished or not. The documents may come from
teaching and research institutions in France or
abroad, or from public or private research centers.
L’archive ouverte pluridisciplinaire HAL, est
destinée au dépôt et à la diffusion de documents
scientifiques de niveau recherche, publiés ou non,
émanant des établissements d’enseignement et de
recherche français ou étrangers, des laboratoires
publics ou privés.
A Correlation-based Dissimilarity Measure for Noisy
Patches
Paul Riot, Andrés Almansa, Yann Gousseau, Florence Tupin
To cite this version:
Paul Riot, Andrés Almansa, Yann Gousseau, Florence Tupin. A Correlation-based Dissimilarity
Measure for Noisy Patches. SSVM 2017: International Conference on Scale Space and Variational
Methods in Computer Vision, Jun 2017, Kolding, Denmark. pp.184-195,
�10.1007/978-3-319-58771-4_15�. �hal-01492429�
A Correlation-based Dissimilarity Measure
for Noisy Patches
Paul Riot1, Andrés Almansa2, Yann Gousseau1, Florence Tupin1
1 LTCI, Télécom ParisTech, Université Paris-Saclay, 75013, Paris, France 2 MAP5, CNRS, Université Paris Descartes, 75006 Paris, France
Abstract. In this work, we address the problem of defining a robust patch dissimilarity measure for an image corrupted by an additive white Gaussian noise. The whiteness of the noise, despite being a common assumption that is realistic for RAW images, is hardly used to its full potential by classical denoising methods. In particular, the L2-norm is
very widely used to evaluate distances and similarities between images or patches. However, we claim that a better dissimilarity measure can be defined to convey more structural information. We propose to com-pute the dissimilarity between patches by using the autocorrelation of their difference. In order to illustrate the usefulness of this measure, we perform three experiments. First, this new criterion is used in a similar patch detection task. Then, we use it on the Non Local Means (NLM) denoising method and show that it improves performances by a large margin. Finally, it is applied to the task of no-reference evaluation of de-noising results, where it shows interesting visual properties. In all those applications, the autocorrelation improves over the L2-norm.
1
Introduction
In this article, we define a new dissimilarity measure between patches from natu-ral images that are corrupted by an additive white Gaussian noise. The common whiteness assumption, although inaccurate on processed images, is realistic on RAW images on which the denoising should preferably be performed [5]. How-ever, most of the available algorithms do not use the white noise hypothesis to its full potential. Indeed, it is almost never enforced nor evaluated. In
partic-ular, non-local denoising methods often use the L2-norm to compare patches
and the SNR or MSE are very widely used to evaluate denoising performances. Here, we propose to evaluate patches whiteness using their autocorrelation as
an alternative to the classical L2-norm to make it more robust to noise and
more discriminative. We demonstrate the potential of the proposed dissimilarity measure on three applications, namely: (a) similar patch detection, (b) non-local denoising, and (c) no-reference (as without oracle contrarily to SSIM or the SNR that are full-reference) denoising quality assessment.
The search for optimal dissimilarity measures between patches is not new and has already emerged in all three application areas. In a recent work [6] Deledalle
et al. use probabilistic arguments to derive optimal dissimilarity measures be-tween noisy image patches for different kinds of noise. This leads to state of the art denoising algorithms in radar imaging, but in the case of Gaussian white noise their methodology leads to a disappointingly simple optimal measure, namely
the L2norm, due to the agnostic statistical model that was adopted as a natural
image prior. On the other hand, based on a relatively simple prior for natural image patches, Sabater et al. [14] propose a metric to discern similar patches
from dissimilar ones that works much better for stereo vision than the L2 norm.
However this approach does not take into account the noise distribution and does not work well for noisy images.
In this work we aim to develop a dissimilarity measure that combines the advantages of both previous works. Our approach uses the autocorrelation as a measure to discriminate unstructured white noise from structured natural image features. To the best of our knowledge, only a few works proposed to take advan-tage of the noise statistics in this manner [1],[8],[9],[10],[11],[13],[16]. However all these works focus on a variational formulation where a whiteness term is used to complement the data fitting and regularization terms in order to further con-strain the solution to one that more closely complies with the first and second order statistics of the noise we want to estimate and remove.
Our approach is different and in a certain way more general. We propose a novel dissimilarity measure between patches whose interest in the denoising framework goes beyond the variational framework proposed in [13]. We use this
measure as a substitute of the L2-norm to more robustly identify similar patches
in non-local denoising algorithms. The new dissimilarity measure improves the performances of the Non Local Means (NLM) algorithm [2] by a large margin. It can also be applied to detect similar patches in a very noisy environment. Once again, performances are improved using the autocorrelation instead of the
L2-norm.
Finally, we tackle the problem of denoising quality assessment. It is well known that the widely used SNR does not provide sufficient structural informa-tion. The SSIM presented in [17] was designed to offer a more perceptually perti-nent dissimilarity measure. However, doubts can be raised regarding its relevance [7] in the context of image denoising. We propose an alternative (no-reference) way to assess the quality of image denoising, relying on the autocorrelation of the difference between patches and we show on several examples that it conveys some interesting structural information.
In the first part of this article, we explain how the autocorrelation can be used to define a new patch similarity criterion. We also explain how it can be used to perform denoising evaluation. In the second part of this work, we present a few experiments demonstrating the potential of this tool for the previously defined tasks.
2
Proposed Similarity Criterion
In the sequel we denote the noisy image by g = f + n where f ∈ RN is the
noise of variance σ2. The denoising task consists in computing an estimation u
of the noise-free image. We call residual R = u − g what was removed from the noisy image. The no-reference quality assessment task consists in determining the quality of u from a statistical analysis of the residual R.
2.1 Evaluate Whiteness with the Autocorrelation
Our goal is to enrich the L2-norm of a noisy patch to include higher order
statis-tics that convey more structural information. As previously stated, there exist many different tools to evaluate the whiteness [1]. Here, we chose to use the autocorrelation that allows to detect structures and dependencies.
We can define the classical autocorrelation estimator rP on a noisy patch P
of size s × s for all possible lags (l, m) ∈ {−s2, ...,s2}2 :
rP(l, m) =
X
(x,y)
P (x, y)P (x + l, y + m) (1)
where the indices are circular. Computed on a white noise, the rP(l, m) for
(l, m) 6= (0, 0) should hover around zero. On the other hand, computed on a structured image, the modulus of the autocorrelation coefficients would reach
higher values showing dependencies. We note that rP(0, 0) is equal to the L2
-norm of the patch.
Choosing a circular convolution has several advantages. First, it speeds up the computation as the circular convolution can easily be computed in the Fourier domain. Second, it simplifies the calculation as every lag involves the same num-ber of samples. Finally, it improves the estimation of the higher lags since more samples are used. Note that, in the perfect case of two identical patches corrupted with white noise, the circular convolution is harmless.
In the following, we will see how this tool can be used to enrich the L2
-norm and design a new patch dissimilarity measure as well as a new denoising evaluation method.
2.2 The Autocorrelation to Define a New Patch Dissimilarity
Measure
In the non-local denoising methods, the L2-norm of the patch difference P
1− P2
is a natural way to evaluate the distance. Indeed, supposing that the underlying
noise free patches are equal, we know that P1− P2is a Gaussian white noise of
variance 2σ2. Thus, the L2-norm can be mathematically justified as shown in [6]
as it can be directly interpreted as a generalized likelihood ratio test. However, it is not robust for strong noise levels.
When using the L2-norm for the patch distance, it has been shown for the
NLM algorithm [3] that a small patch size is optimal for low noise levels. However,
and s must be increased to obtain a reliable estimate. The trade-off is that there are now less similar patches. When the signal to noise ratio is low, it has been
shown in [12] that the L2-norm often matches noise realizations over image
con-tent. This phenomenon shows that the L2distance is quite sensitive to the noise.
Indeed, it only evaluates the energy of the patch difference P1− P2and does not
take into account any structural information.
We show that computing the autocorrelation matrix of D is more reliable
than the L2 norm and appears to contain more structural content. This idea is
applied to design a new patch dissimilarity measure using the autocorrelation
estimator rP1−P2defined previously. One can note that rP1−P2(0, 0) = ||P1−P2||
2
gives the energy of P1− P2 which is equal to the square of the L2 norm. The
other lags give information about the structural content of P1− P2. The higher
the |rP1−P2(l, m)| for (l, m) 6= (0, 0) are, the more structural content there is in
P1− P2, meaning that the underlying noise free patches are not similar. From
there, we can design a new patch dissimilarity measure that we will refer to as Whiteness Dissimilarity Measure (WDM) :
d2w(P1, P2) = ||rP1−P2||
2
2. (2)
This measure is experimentally more robust to high noise levels as it contains more structural information. It is also more reliable on big patch sizes as the au-tocorrelation estimation becomes more robust when more samples are available. However, we will show in the experiments that the results are also improved considering small patch sizes.
It is important to note that WDM is not a distance. Indeed, it is possible to show that it verifies the properties of non-negativity, identity of indiscernibles and symmetry. But, we can show that it does not satisfy the triangle inequality.
2.3 Denoising Evaluation Beyond the SNR
The SNR, and all its derivatives like the MSE or the PSNR, are the most com-monly used metrics to evaluate and compare denoising performances. It is defined as :
SN R(u) = 10 log10( ||u||
2
||f − u||2) (3)
Fundamentally, this measures the magnitude of the error by computing the error
energy ||f − u||2. It is perfectly relevant from a mathematical point of view.
However, it is not always informative for a visual evaluation. Indeed, it is well known not to correlate well with visual evaluation. We can also point the fact that many state of the art denoising methods are reaching very close SNR. However, some present much more visible artifacts than others. This can’t be well evaluated using the SNR. This is the reason why new metrics were developed such as SSIM [17]. However, severe criticism has emerged regarding its structural properties as demonstrated in [7]. Both SSIM and the SNR use an oracle to estimate the denoising quality.
In this work, we aim at showing that the residual autocorrelation can be used as a complement to the SNR to evaluate the amount of structural content removed from the noisy image. Also, we claim that this can be linked to visual quality as it is sensitive to damaged textures and colored artifacts. On top of that, our metric is designed to work without any oracle by evaluating the residual whiteness. It also provides a local map to evaluate the denoising quality.
We propose to estimate a normalized residual autocorrelation on every patch
Rk of the residual : A(Rk) = ||rRk|| 2 2− rRk(0, 0) 2 σ4 ks2(s2− 1) (4) where σ2 k= P
(i,j)Rk(i, j)2 is the energy of the residual estimated on the patch
Rk. The normalization corresponds to the expected value of the estimator in the
numerator under the hypothesis that Rk is a white Gaussian noise with zero
mean and variance σ2
k. Then, we can aggregate the A(k) coefficients computed
over each patch to obtain a quality map at each pixel (i, j) :
W-map(i, j) = P kχk(i, j)A(Rk) P kχk(i, j) (5)
where χk(i, j) = 1 if and only if (i, j) belongs to the support of Rk. This map
gives a local estimate of how much structural content was removed from the image. A global score can be obtained with a simple normalized sum :
W-score = 1
N X
(i,j)
W-map(i, j) (6)
with N the total number of pixels. This total score gives an estimate of the quality of denoising. When it is very close to 1, the denoising algorithm did not damage the underlying image. When it increases, it means that the residual is structured and thus some content from the image was removed. We claim that this is an interesting visual property as it is usually preferred to preserve content and only slightly denoise images, especially in the textured areas, rather than overly denoise and blur out some structural content. Also, it can be useful for later image processing tasks such as detection or recognition as we can estimate if the image content was damaged.
We note that the W-score should not be evaluated on its own as it does not contain any information on the residual energy because we removed the term
rRk(0, 0)
2. Indeed, adding a white noise to an already noisy image would lead to
a perfect W-score of 1 as the residual, equal to the added noise, would be white. Thus, it should be coupled with the SNR to be properly interpreted.
We chose to remove rRk(0, 0)
2 that contains the residual energy information
because it is not clear what should be done with it. Furthermore, it is not simple to evaluate it at the same time as the other coefficients that contain a different information.
3
Experimental Results
In this section, we propose three experiments demonstrating the relevance of the proposed patch dissimilarity measure, WDM. Only a small number of visual results are shown due to length constraints, but more results are visible on the website https://wdm-ssvm2017.telecom-paristech.fr.
First, we evaluate the ability of our measure to retrieve similar patches cor-rupted by a strong additive white noise. Second, we show that simply replacing
the L2norm by our measure in the Non Local Means (NLM) algorithm yields a
significant performance gain. Last, the no-reference quality measure introduced in paragraph 2.3 is shown on some experiments to usefully complement the SNR.
3.1 Detecting Similar Patches with High Noise Levels
To assess the relevance of WDM to retrieve similar patches, we follow the exact same experimental protocol recently proposed in [6]. We compare the respective
performances of WDM, L1, L2 and L4 on a dictionary composed of 196
noise-free patches of size s = 8. The noise-noise-free patches were obtained using the k-means algorithm on patches extracted from the classical Barbara image. For this experiment, it is important to have different patches in the dictionary for the probability of false alarm to be well defined. The noisy patches are noisy realizations of the noise-free patches under strong noise conditions. Here we choose a white Gaussian noise with σ = 100. This experiment is only valid for strong noise levels (σ > 50) as both criteria perform perfectly for lower noises. The dissimilarity measures are evaluated for all pairs of noisy patches. The process is repeated 20 times with independent noise realizations. Numerically, the performance of the similarity criterion is given in term of their receiver operating characteristic (ROC) curve, i.e., the curve of the probability of detection as a function of the probability of false alarm. Results are given in Figure 1.
It clearly appears on this curve that WDM performs better than L1, L2 and
L4. As previously said, this is particularly true at low signal to noise ratios. Also,
L2 starts to match noise realizations over noise-free content after a certain noise
level as shown in [12].
3.2 Improving the NLM Algorithm
The new similarity criterion defined previously can be applied to any patch based algorithm. However, for evaluation purposes we will focus on the original NLM algorithm [2]. While there are many more recent and efficient denoising methods, we believe, as it is explained in [6], that this algorithm provides a good way to compare similarity criteria. Note also that there are alternative ways to make this algorithm robust to noise, such as the PCA-based approach proposed in [15]. In this section, we will compare the use of this algorithm when using WDM and
when using L2. To limit the number of parameters, we fix a search window of
size W = 21. To compare the results on a fair basis the bandwidth parameter h is optimized in each case to obtain the best SNR. The SNR and SSIM results for
Fig. 1: (left) Patch dictionary. (right) ROC curve obtained when retrieving patches under a strong white Gaussian noise (σ = 100).
different images using different patch sizes are shown on table 1. We can see that
changing the distance from L2 to WDM always improves the SNR by around
0.5 dB, sometimes more. The SSIM is also consistently improved.
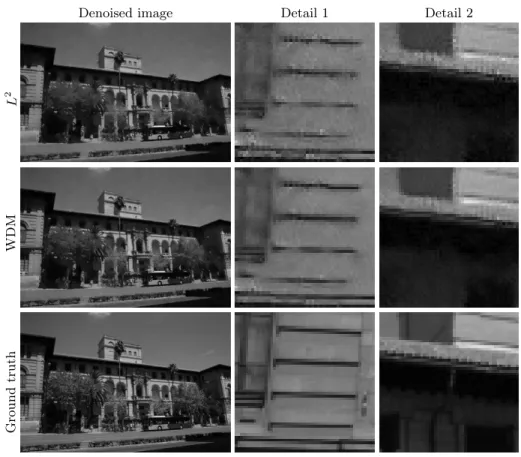
Some visual results are displayed on figure 2. The images were corrupted using a white Gaussian noise with σ = 25. On the building image we can note that the structural components are better retrieved. Indeed, on the first detail, the lines are more contrasted and smooth. The homogeneous parts of the image are also better denoised. On the second detail, we can see that the dark areas are better denoised and again that the structural content is better preserved.
Overall, the contrast preservation is much better for WDM than for L2. Indeed,
the NLM algorithm tends to average patches that present slight differences in their mean value resulting in important losses on low frequency areas. On the contrary, simple computations can show that the WDM measure is more affected
than L2 by a constant bias, thus resulting in a smaller contrast loss.
Table 1: SNR (in dB) and SSIM performances of the NLM algorithm for L2and
WDM patch distances with σ = 25
L2 WDM Lena 22.10 / 0.869 22.65 / 0.878 Building 17.85 / 0.883 18.37 / 0.897 Mandrill 19.06 / 0.821 19.29 / 0.836 House 25.73 / 0.811 26.57 / 0.829 Fingerprint 21.26 / 0.921 21.95 / 0.943 Flintstones 22.52 / 0.940 23.28 / 0.951 Boat 22.59 / 0.852 23.24 / 0.869 Barbara 21.91 / 0.895 22.68 / 0.907
Denoised image Detail 1 Detail 2 L 2 WDM Ground truth
Fig. 2: Building denoising with the NLM algorithm (s = 5 and W = 21)
Improved performances are due to the fact that WDM is more robust to the noise. A good way to evaluate this claim is to test different levels of noise and
compare the performances for low and high noise levels. We expect the L2norm
to perform better on very low level noises while our measure would better suit the stronger noise levels. We show the corresponding SNR curve as a function of σ on Figure 3 (a), indeed supporting the previous claim of robustness. Those results can be further confirmed by another experiment. Using the noise free image to compute the weights and then using these weights to denoise a noisy
image shows that, on the Lena image, the PSNR is better for the L2 norm
(34.66dB) than for the WDM measure (34.57 dB). It is nevertheless interesting to note that, even in a noise free environment, the WDM distance is still relevant
as it performs only very slightly worse than L2.
Another interesting property of WDM is that it outperforms L2 whatever
the choice for s is, as can be seen on Figure 3 (c). While this was expected for large patch sizes, it is somehow surprising that this still occurs at small patch sizes (up to s = 3). Furthermore, the performances of WDM appear more stable
(a) SNR=f(σ)(s=5) (b) SNR=f(h)(s=5,σ=25) (c) SNR=f(s)(σ=25)
Fig. 3: SNR performances as a function of different parameters for the NLM
algorithm using WDM and L2 (W=21). h was optimized to obtain the best
SNR for (a) and (c). The scale is semi-log for (b) and the functions were aligned for an easier comparison.
with respect to the choice of s than those of L2, in particular when s increases.
This could allow further improvements for other applications that require bigger patch sizes.
Finally, Figure 3 (b) shows that the performances of NLM using WDM are somehow more stable with respect to the choice of the bandwidth than when
using L2. This is an interesting property since the optimal value of such
band-width parameters can highly vary from images to images, for NLM as for more recent algorithms.
3.3 Residual Evaluation
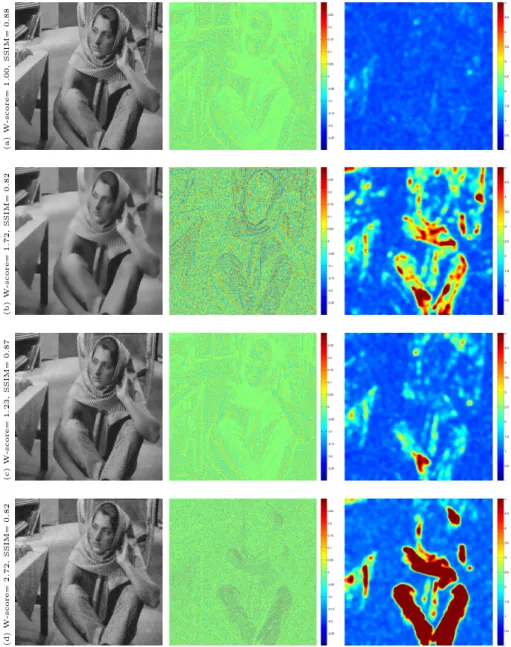
As a last experiment, we investigate the usefulness of the quality measure in-troduced in Section 2.3, defined by Formula (6) with s = 15. Recall that this index relies on a local (patch-based) whiteness estimation, performed on the residual image (the difference between the noisy and the denoised image). As such, and unlike the SNR or SSIM quality measures, it may be computed with-out any knowledge of the noise-free image. The experiment is very simple and is only provided as a proof of concept. It consists in comparing the W-scores, as defined by Formula (6), for images having the same SNR but different visual aspects. A first example is visible on Figure 4, where we compare (non-optimal) denoised versions of the Barbara image corrupted by a Gaussian additive noise with σ = 25. These images correspond to different denoising methods yielding relatively poor SNR (19.45dB±0.05dB). (a) and (b) were obtained with the NLM algorithm, (c) with a variationnal variant of the NLM and (d) with ROF. More examples are visible on the dedicated website.
The result 4.(a) is relatively conservative and only a small amount of noise is removed from the noisy image. No information was removed from the image. The textures and the contrast are well preserved. As a result, no structure is detected in the residual and our criterion hovers around a value of one on the whole image.
The W-score is equal to one, which is the expected score for a white residual. On the other hand, the result 4.(b) was overly denoised, most of the textures are washed out and the final denoised image suffers heavy contrast losses. A large amount of structure was removed from the noisy image. Our evaluation criterion appears able to detect the most damaged areas (corresponding to large values of the W-map). One can note that the homogeneous areas present a very low local W-map as they were well denoised. However, the textures on the clothes are completely removed and the residual is clearly correlated, as shown by the W-map. Globally, the W-score for this image is 1.72. The result 4.(c) appears less smoothed and damaged than 4.(b) and gets a W-score of 1.23. However, it is visible on the denoised image, the residual and the W-map that some texture was removed on a few areas leading to a higher W-score. Finally, the result 4.(d) clearly damaged the textures in the image. Accordingly, the W-score is 2.72.
These experiments show that the SSIM is barely able to differentiate the results (a) and (c). However, we can see on the W-map and on the residual that a few textures were locally damaged on result (c) as opposed to (a). Further-more the SSIM cannot tell the difference between (b) and (d) whereas W-score clearly chooses (d) as the worst result. Also, the proposed quality measure is no-reference, contrarily to the SSIM that is full-reference.
Of course, This simple experiment is in no case sufficient to assess the percep-tual interest of the proposed quality measure. This task deserves further work, probably through a user study. Nevertheless, we believe this measure is of strong interest. Indeed, it is now widely admitted that the SNR is in no way sufficient to assess the quality of a restoration task. In particular, it is known to be almost blind to the destruction of textured areas. Now, the preservation of such tex-tured areas appears as a major industrial challenge for imaging applications [4]. While the SSIM somehow complements the SNR by paying more attention to the structure of the image, its usefulness is not always clear in the case of image denoising. Last, being no-reference, the proposed quality measure can be used as an objective function, in a way similar to the one followed in [13].
4
Conclusion
In this work, we have presented an alternative to the L2norm to compare noisy
patches. This alternative, called WDM, appears to be more sensitive to the
struc-tural information than the L2 norm. The WDM dissimilarity measure, relying
on the autocorrelation operator, was applied to different tasks such as non-local denoising, similar patch detection or denoising evaluation. It showed interesting properties and performances in all those applications. This work opens many per-spectives. While we only considered Gaussian white noise, the approach could be extended to other types of white noise. Also the proposed no-reference quality measure, showing promising preliminary results, would definitively deserve an in-depth validation. Last, many other applications could benefit from the intro-duced measure, such as variational denoising, stereo vision or motion tracking. Also we intend to extend this study in order to characterize a wider family of dissimilarity measures that are able to discriminate white noise from natural image structure.
(a) W-score = 1 . 00 , SSIM = 0 . 88 (b) W-score = 1 . 72 , SSIM = 0 . 82 (c) W-score = 1 . 23 , SSIM = 0 . 87 (d) W-score = 2 . 72 , SSIM = 0 . 82
Fig. 4: Quality assessment of 4 denoising methods yielding the same SNR but different visual qualities. From left to right, denoised results, residuals, whiteness criterion maps (W-maps). (a) and (b) were obtained with the NLM algorithm, (c) with a variationnal variant of the NLM and (d) with ROF.
References
1. Brunet, D., Vrscay, E.R., Wang, Z.: The use of residuals in image denoising. In: Image Analysis and Recognition, pp. 1–12. Springer (2009)
2. Buades, A., Coll, B., Morel, J.M.: A review of image denoising algorithms, with a new one. Multiscale Modeling & Simulation 4(2), 490–530 (2005)
3. Buades, A., Coll, B., Morel, J.M.: Non-Local Means Denoising. Image Processing On Line 1 (2011)
4. Cao, F., Guichard, F., Hornung, H.: Measuring texture sharpness of a digital cam-era. In: IS&T/SPIE Electronic Imaging. International Society for Optics and Pho-tonics (2009)
5. Colom, M., Buades, A., Morel, J.M.: Nonparametric noise estimation method for raw images. JOSA A 31(4), 863–871 (2014)
6. Deledalle, C.A., Denis, L., Tupin, F.: How to compare noisy patches? patch similar-ity beyond gaussian noise. International journal of computer vision 99(1), 86–102 (2012)
7. Dosselmann, R., Yang, X.D.: A comprehensive assessment of the structural simi-larity index. Signal, Image and Video Processing 5(1), 81–91 (2011)
8. Fehrenbach, J., Nikolova, M., Steidl, G., Weiss, P.: Bilevel image denoising using gaussianity tests. In: Scale Space and Variational Methods in Computer Vision, pp. 117–128. Springer (2015)
9. Lanza, A., Morigi, S., Sgallari, F.: Variational image restoration with constraints on noise whiteness. Journal of Mathematical Imaging and Vision pp. 1–17 (2014) 10. Lanza, A., Morigi, S., Sgallari, F., Yezzi, A.J.: Variational image denoising based
on autocorrelation whiteness. SIAM Journal on Imaging Sciences 6(4), 1931–1955 (2013)
11. Lanza, A., Morigi, S., Sgallari, F., Yezzi, A.J.: Variational image denoising while constraining the distribution of the residual. Electronic Transactions on Numerical Analysis 42, 64–84 (2014)
12. Lebrun, M., Buades, A., Morel, J.: A nonlocal bayesian image denoising algorithm. SIAM Journal on Imaging Sciences 6(3), 1665–1688 (2013)
13. Riot, P., Almansa, A., Gousseau, Y., Tupin, F.: Penalizing local correlations in the residual improves image denoising performance. In: Signal Processing Conference (EUSIPCO), 2016 24th European. pp. 1867–1871. IEEE (2016)
14. Sabater, N., Almansa, A., Morel, J.M.: Meaningful Matches in Stereovision. IEEE Trans. PAMI 34(5), 930–42 (dec 2011), http://hal.archives-ouvertes. fr/hal-00647995
15. Tasdizen, T.: Principal neighborhood dictionaries for nonlocal means image de-noising. IEEE Transactions on Image Processing 18(12), 2649–2660 (2009) 16. Teuber, T., Remmele, S., Hesser, J., Steidl, G.: Denoising by second order statistics.
Signal Processing 92(12), 2837–2847 (2012)
17. Wang, Z., Bovik, A.C., Sheikh, H.R., Simoncelli, E.P.: Image quality assessment: from error visibility to structural similarity. IEEE transactions on image processing 13(4), 600–612 (2004)