1
Title: Towards a multibioassay-based index for toxicity assessment of fluvial waters
1
2
3
Lalit K. Pandeya,b, Isabelle Lavoiec, Soizic Morind, Stephen Depuydte, Lyu Jief, Hojun Leeg, Jinho Jungh,
4
Dong-Hyuk Yumi, Taejun Hang,j, Jihae Parke,*
5
6
aInstitute of Green Environmental Research Center, 169, Gaetbeol-ro, Yeonsu-gu, Incheon 21999, Korea.
7
bDepartment of Plant Science, Faculty of Applied Sciences, MJP Rohilkhand University, Bareilly, 243006,
8
India.
9
cInstitut national de la recherche scientifique, centre Eau Terre Environnement, 490 rue de la Couronne,
10
Québec City, Québec, G1K 9A9, Canada.
11
dIrstea, UR EABX, 50 avenue de Verdun 33612 Cestas cedex, France.
12
eLab of Plant Growth Analysis, Ghent University Global Campus, 119, Songdomunwha-ro, Yeonsu-gu,
13
Incheon 21985, Korea
14
fDepartment of Life Sciences, Jilin Normal University, Siping City, Jilin Province, China
15
gDepartment of Marine Science, Incheon National University, 119, Academy-ro, Yeonsu-gu, Incheon
16
22012, Korea.
17
hDivision of Environmental Science & Ecological Engineering, Korea University, Seoul 02841, Korea
18
iEcotoxicology Team, Korea Institute of Toxicology, Daejeon 34114, Korea
19
jGhent University Global Campus, 119, Songdomunwha-ro, Yeonsu-gu, Incheon 21985, Korea.
20
21
*Corresponding author at:
22
Lab of Plant Growth Analysis, Ghent University Global Campus, 119, Songdomunwha-ro, Yeonsu-gu,
23
Incheon 21985, Republic of Korea. E-mail address: [email protected] / Telephone number: +82 32
24
626 4305 / ORCID: 0000-0002-1873-1480 (J. Park).25
26
27
28
Highlights
29
30
- An ecotoxicological assessment of natural waters based on a multi-organism trial was conducted
31
in four South Korean rivers
32
- The tested organisms showed distinct levels of performance in their response to natural waters
33
- A scoring system is proposed to integrate biological responses into an overall toxicity category
34
- This bioassay approach identified more sites as potentially degraded as did water chemistry
35
measurements alone
36
37
Manuscript Click here to access/download;Manuscript;EMAS_revised ms
(clear version).docx
2
Abstract
38
Despite their proven reliability for revealing “acceptable” degrees of toxicity in waste-
39
and reclaimed waters, bioassays are rarely used to assess the toxicity of hazardous
40
contaminants present in natural waters. In this study, we used organisms from different
41
trophic levels to assess the toxicity of water samples collected from four different South
42
Korean rivers. The main objective was to develop a multi-descriptor index of toxicity for
43
undiluted river water. The responses of six test organisms
44
(Aliivibrio fischeri, Pseudokirchneriella subcapitata, Heterocypris incongruens, Moina m
45
acrocopa, Danio rerio, and Lemna minor) after laboratory exposure to water samples
46
were considered for this index, as well as the frequency of teratologies in diatom
47
assemblages. Each individual test was attributed a toxicity class and score (three levels;
48
no toxicity = 0, low toxicity = 1, confirmed toxicity = 2) based on the organism’s
49
response after exposure and a total score was calculated. The proposed index also
50
considers the number of test organisms that received the highest toxicity score (value =2).
51
An overall toxicity category was then attributed to the water sample based on those two
52
metrics: A = no toxicity, B = slight toxicity, C = moderate toxicity; D = toxicity, E = high
53
toxicity. The susceptibility of the test organisms varied greatly and the sensitivity of their
54
response also differed among bioassays. The combined responses of organisms from
55
different trophic levels and with different life strategies provided multi-level diagnostic
56
information about the intensity and the nature of contamination.
57
58
Keywords: Aquatic plants; Bioassay; Biological indicators; Microorganisms; Multi-descriptor index;
59
Multiple endpoints; Receiving water
60
3
61
1. Introduction
62
Fluvial ecosystems experience multiple anthropogenic disturbances such as industrial, municipal
63
and agricultural effluents leading to eutrophication and chemical contamination, acidification, hydrological
64
and hydro-morphological alterations, and invasion by non-native species (Li et al. 2010). In particular,
65
wastewater effluents derived from industrial and municipal sources contain a mixture of chemicals which,
66
once released into the receiving water bodies, can have deleterious effects on the biological integrity of the
67
flora and fauna (Kim et al. 2015). These impacts are observable at different levels of biological
68
organisation (e.g., molecular, individual, population, and community; Nedeau et al. 2003; Ntengwe and
69
Maseka 2006; Tabrez and Ahmad 2012; Hassan et al. 2015) and may ultimately alter ecosystem function.
70
The most commonly used approach for assessing water quality is the measurement of chemical substances
71
and their metabolites. However, it is now generally accepted that there are potential limitations when
72
relying solely on chemical profiling to evaluate ecosystem health status, regulate acceptable loads of
73
wastewater effluents, and conduct risk assessments (Wolska et al. 2007). Routine chemical monitoring does
74
not account for the bioavailability of chemicals and nutrients, the temporal changes in exposure, or the
75
additive and synergistic effects of contaminants (Ahlf et al. 2002; Chu and Chow 2002). Most importantly,
76
chemistry-based monitoring does not provide information regarding the effect of contaminants on the biota.
77
Ecological surveillance of running waters based on an integrated assessment of the biological, chemical and
78
physical properties of a system contributes to better water resource protection and conservation and helps
79
water managers to plan rehabilitation.
80
Numerous water quality monitoring approaches based on organisms such as algae (mostly
81
diatoms) (e.g., Ponader et al. 2007; Coste et al. 2009; Kelly 2013; Lavoie et al. 2014), macrophytes (Small
82
et al. 1996; Thiebaut et al. 2002), invertebrates (e.g., Reynoldson et al. 1997; Lento et al. 2008; Canesi and
83
Corsi 2016) and fish (e.g., Joy and Death 2001; Oberdorff et al. 2002) are commonly used worldwide.
84
These indices are generally based on metrics such as species assemblage structure, diversity, % tolerant
85
species, life-forms, traits, size distribution, etc. However, these monitoring approaches have mostly been
86
developed to assess overall biological integrity, and often mostly reflect nutrient and organic matter
87
enrichment and habitat degradation, not toxicity. Biological assessment of potential water toxicity from
88
4
various types of inorganic and organic contaminants is usually performed using single and multi-species
89
toxicity tests which can effectively demonstrate causal relationships between the presence of contaminants
90
and adverse effects on the biota. Bioassays are widely used to assess the toxicity of a substance or a
91
combination of compounds in aquatic and terrestrial environments. As a general trend, this ecotoxicity
92
assessment approach relies on stepwise dilutions of samples to determine effective or lethal concentrations
93
(EC and LC, for example, the concentration of a substance or mixture giving half-maximal response of the
94
test organism is the EC50), with the objective to establish acceptable degrees of toxicity before wastes can
95
be discharged in the environment or reclaimed. The information can then be used for monitoring and
96
predicting the effects of chemical discharges and for deriving chemical-specific water quality guidelines
97
(Ankley et al. 1992). Bioassays, such as bioluminescence in the bacteria Vibrio fischeri, the cell count of
98
microalgae such as Pseudokirchneriella subcapitata, photosynthetic activity of microalgal communities
99
(Kim Tiam et al. 2016), mortality and growth of small invertebrates such as ostracods and cladocerans, and
100
survival of fish such as Danio rerio (zebrafish) are internationally standardized test methods commonly
101
used in ecotoxicology. Bioassays can also be used to monitor potential toxicity of natural waters, although
102
this approach is not as conventional and necessitates a different method for the determination of the
103
contamination level than the EC or LC generally used for wastewaters.
104
In this paper, assessment of natural water toxicity is proposed using undiluted river samples and a
105
battery of biological indicators. Including various organisms in toxicity evaluation ensure a
better-106
integrated response by providing information at different levels (e.g., biochemical function, cellular growth,
107
mortality, etc.). The various test organisms have different sensitivities to the suite of contaminants, which
108
in turn maximises chances to detect a response after exposure to a sample with unknown chemical
109
composition. The goal of our research was to develop a multi-species toxicity test procedure using six
110
commonly used test organisms (Aliivibrio fischeri (bacterium), Pseudokirchneriella subcapitata (green
111
microalga), Heterocypris incongruens (ostracod), Moina macrocopa (cladocera), Danio rerio (fish), Lemna
112
minor (aquatic macrophyte)) for ecotoxicological assessments of river waters collected at different sites
113
distributed among four watersheds impacted by industrial and municipal effluents in South Korea. In
114
addition, the frequency of teratologies (abnormalities) in diatoms (siliceous brown microalga) collected in
115
situ was also included in this multi-species toxicity assessment.
116
5
This study proposes an approach for a rapid screening of flowing waters with suspected toxic
117
contamination, and provides valuable knowledge for further development of a bioassay-based index for
118
future implementation in the national river water quality management program in South Korea.
119
2. Materials and methods
120
2.1. Water sample collection and on-site field measurements
121
Sites were selected based on an existing micropollutant dataset from an eight-year extensive
122
monitoring program, conducted by the South Korean government, to assess river water quality at 159 sites
123
receiving effluents from 34 industrial complexes (Cho et al. 2014) (Tables S1 and S2). The South Korean
124
Ministry of Environment (MOE) also performs regular water quality assessments of streams and rivers,
125
including measurements of metals (As, Ag, Cd, Cr, Cu, Hg, Ni, Pb, and Zn), total phosphorus (TP) and
126
total nitrogen (TN), biological oxygen demand (BOD5), total dissolved solids (TDS), pH, conductivity, and
127
total coliforms. Based on the available information on river water quality, 16 sites were chosen to cover
128
various sub-watersheds across South Korea. Additional information on the sampling sites selected and on
129
the four watersheds is provided in supplementary tables (Tables S1 and S2).
130
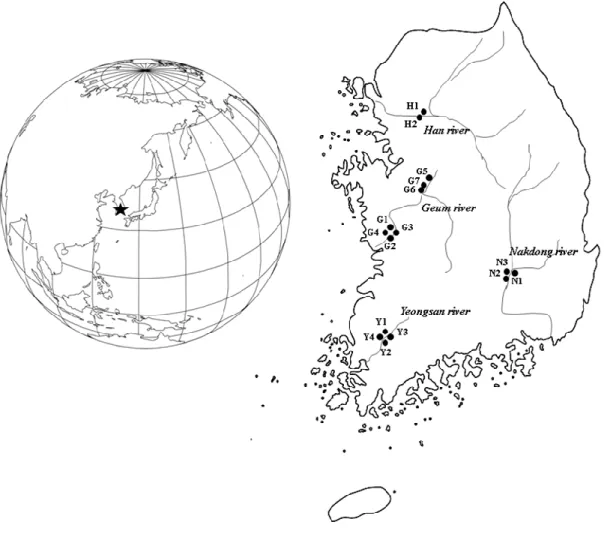
Surface water samples were collected in plastic bottles (2 litres) at the 16 selected sites distributed
131
along four major South Korean rivers in September 2015 (Fig. 1). The samples were kept cold during
132
sampling and transportation and were stored at 4°C upon arrival at the laboratory. Temperature, pH, and
133
dissolved oxygen were measured directly in the field with a multi-parameter display system (YSI 650,
134
USA). Conductivity was also measured on-site using a portable metre (Milwaukee, USA), and total
135
dissolved solids measurements were performed with a field amperometric graphite electrode (Hanna
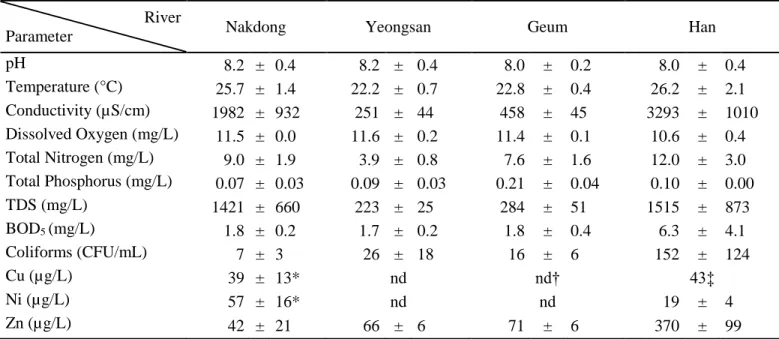
136
HI98301 DiST® 1, USA).
137
2.2. Chemical analyses
138
Biochemical oxygen demand was measured by dark and light bottle incubation for 24 h at 20°C in
139
controlled light conditions, and Colilert-18 tests (IDEXX) were carried out to estimate the total number of
140
coliforms. Water samples were filtered through 0.45 μm syringe filters prior to analyses of nutrients and
141
metals. An automatic water analyser (Skalar/ Netherlands, SAN ++) was used to measure TN and TP.
142
Analyses of metals were conducted by inductively coupled plasma-optical emission spectrometry
(ICP-143
OES; Varian Vista PRO, CA, USA). Standard solutions were prepared fresh and calibration curves (r2 >
144
6
0.995) were generated daily. Standard solutions were analysed after every 10 samples to verify their
145
concentrations. Measurement precision ranged from 94 to 107%, and detection limits were calculated based
146
on the standard deviations of blanks triplicates (range: 4 to 14 μg L−1). Organic compounds were analysed
147
by the South Korean Ministry of Environment, following the methods presented by Cho et al. (2014).
148
2.3. Toxicity assessment
149
2.3.1. Microtox bioassay (bacteria)
150
The Microtox® (Newark, DE, USA) bacterial acute toxicity assay was used to determine inhibition
151
in the metabolism of Aliivibrio fischeri when exposed for 30 minutes to each of the 16 surface water
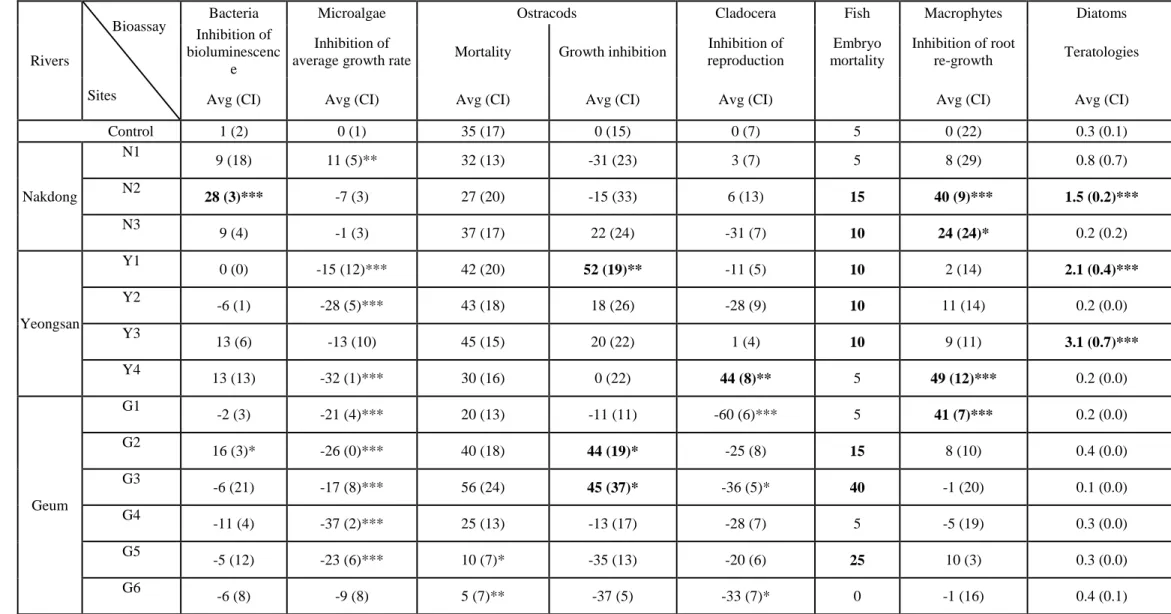
152
samples. The cultures were maintained at 15°C throughout the experiment. The control treatment consisted
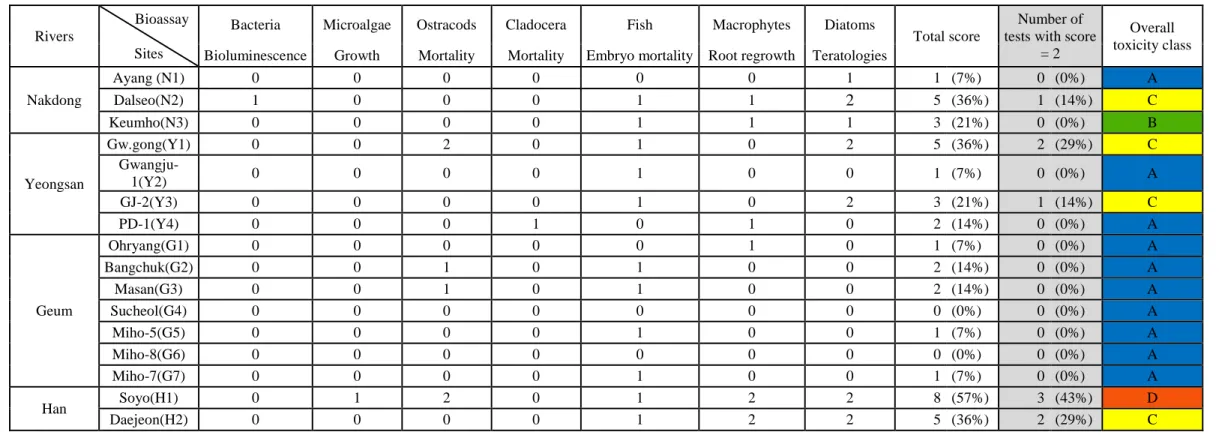
153
of 2% NaCl water. Bacteria were exposed in triplicates to each treatment, according to the standard
154
Microtox procedure (Tarkpea and Hansson 1989). Bioluminescence of the bacteria was measured with a
155
Microtox photometer (Model 500). Results were expressed as % inhibition in bioluminescence between
156
pre-exposure to the water samples and after 30 minutes of exposure, taking into account the temporal
157
changes in luminescence occurring in control (ISO 11348-1:2009; Parvez et al. 2006). Confidence intervals
158
(CI) were calculated for α-value = 0.05.
159
2.3.2. Microalgal bioassay
160
The test performed in triplicate on Pseudokirchneriella subcapitata was conducted using an
161
Algaltoxkit (Microbiotests, Belgium). The methods followed standard operational procedures provided by
162
the manufacturer and in accordance with the OECD Test Guideline 201 (OECD 1984). Microplates were
163
filled with 900 µL of test water (for the control, 900 µL of MBL medium (Nichols 1973) was used) and 100
164
µL of an algal-inoculum solution, with the initial number of algal cells being adjusted to 105 cells ml-1. The
165
exposure tests were performed for 72 h at 25°C under light conditions of 60-80 μmol photons m- 2 s- 1.
166
Determination of algal growth was conducted using absorbance values measured at a 670 nm wavelength
167
using a spectrophotometer (Scinco, S-3100, Korea). Optical densities of the blank and samples were taken
168
at 670 nm and then converted into cell densities (cells ml-1). The growth inhibition (% calculated as the
169
percentage reduction in average specific growth rate compared to the control, following OECD 1984) was
170
used as an indicator of the toxicity of the 16 river water samples. Confidence intervals (α = 0.05) were
171
calculated.
172
7
2.3.3. Ostracod bioassay
173
Hatching of ostracod (Heterocypris incongruens) cysts was initiated 48 h prior to the start of the
174
toxicity test, and freshly hatched ostracods were pre-fed (with Spirulina powder from Spirulina
175
International, Tilburg, Holland) for 4h. The toxicity test followed the procedure described in the
176
International Standard ISO 14371:2012. Pore sediment water was collected at each site and sand was used
177
as reference sediment following the protocol of Chial and Persoone (2002a). Multi-well plates were filled
178
with 100 µL of sediment and 2 ml of overlying water (distilled water for the control). Pseudokirchneriella
179
subcapitata was provided as food source. Ten ostracod eggs per treatment were placed in the dark at 25°C
180
for six days. Water was not replaced during the experiment—that is, the experiment was static. Each of the
181
16 river water treatments and the control was tested in triplicate. Ostracods were recovered from the
multi-182
well plates at the end of the six-day exposure to determine % mortality and growth length inhibition and
183
were compared to the controls. For both endpoints, confidence intervals (α = 0.05) were calculated.
184
2.3.4. Cladocera bioassay
185
Toxicity effects of the 16 river water samples on Moina macrocopa (≤ 24 h old) were tested after
186
adaptation of the OECD Test Guideline 211 (OECD 2012) for Daphnia magna to better reflect conditions
187
appropriate to M. macrocopa intrinsic population dynamics. Each toxicity test was conducted on 10
188
neonate female cladocerans, with one animal per well. Elendt M4 medium (Elendt 1990) was used as the
189
control water. Exposure was performed for nine days at 20 ± 2°C with 16 h light and 8 h dark photoperiods.
190
The test medium (river water) was renewed every three days and the cladocerans were fed daily ad libitum
191
with green algae (Chlorella vulgaris). Offspring production per female was recorded and expressed as % of
192
control values (CI: α = 0.05). Growth inhibition induced by the treatment, compared to the control, was
193
determined from individual length measurements. Mortality was determined as the percentage of dead
194
individuals at the end of the exposure.
195
2.3.5. Fish embryo test
196
The fish embryo toxicity test (FET; OECD Test Guideline 236 2013) was conducted with Danio
197
rerio. A total of 20 fertilised eggs for each treatment were incubated at 20°C for 96 h. Percent mortality
198
was evaluated based on the numbers of coagulated embryos or lack of heartbeat at the end of the
199
8
experiment. Criteria to establish the validity of the test were reached, with > 90% survival in the negative
200
controls, and 100% mortality in the positive control (3,4-dichloroaniline, 4 mg L-1).
201
2.3.6. Lemna root bioassay
202
A Lemna root bioassay was adapted from Park et al. (2017). Fresh green fronds of Lemna minor,
203
consisting of two fronds, were selected as the test material. Roots were excised, and rootless plants were
204
placed in a well plate with 3.0 ml of test water (3.0 ml of Steinberg medium for the control; Steinberg
205
1946). The experiment was conducted using 20 fronds per treatment. Toxicity tests were carried out in a
206
growth chamber for 72 h at 25°C under continuous light (90-100 μmol photons m-2 s-1). Plants were
207
examined after the 72 h incubation period and the root lengths were measured using an imaging analyser
208
(Moticam 2500, Ted Pella Inc., USA). Root elongation inhibition was then expressed as the % reduction in
209
the root length of exposed Lemna (measured in mm), compared to the control (CI: α = 0.05).
210
2.3.7. Deformity assessment in diatom frustules
211
The occurrence of deformities was assessed using on-site diatom assemblages chronically exposed
212
to river water impacted with industrial discharges. The methods for biofilm collection, sample preparation,
213
slide mounting, and deformity evaluation are explained in Pandey and Bergey (2016), Cerisier et al. (2018)
214
and Pandey et al. (2018). Briefly, biofilm samples were collected at each site by scraping hard substrates
215
such as stones and concrete walls (~ 25 cm2) using a blade and a brush. Diatom valve deformities were
216
enumerated using digested material mounted onto permanent microscope slides and observed at 1000x
217
magnification under an oil immersion microscope (Carl Zeiss, Axiostar plus, Germany). The proportion of
218
deformed diatom valves at each site was estimated based on 500 valve counts and expressed as %
219
deformity (CI: α = 0.05). For comparison purposes, biofilms were also sampled in least-impacted areas
220
upstream of the major sources of contamination (three sites and four samples per river), and these
221
“reference” diatom assemblages were examined for deformities. The average % deformity observed in the
222
upstream site samples was used as the control.
223
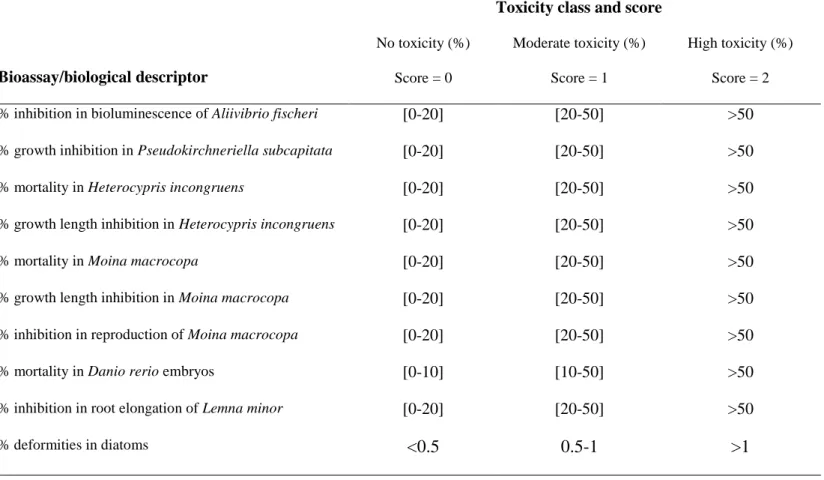
2.3.8. Scoring of bioassay results
224
For each test, three toxicity classes were established to estimate the level of contamination: no
225
toxicity, moderate toxicity, and high toxicity (Table 1). For all of the bioassays, > 50% response (i.e., above
226
the EC50 or LC50) was considered as the lower boundary for “high toxicity” of the water samples, in line
227
9
with classical toxicity criteria. This 50% effect threshold is commonly reported as a significant acute
228
toxicity value in the bioluminescence assay (Niemirycz et al. 2007; ISO 11348:2009), algal growth
229
inhibition test (OECD 1984), Lemna root regrowth test (Park et al. 2017), invertebrate mortality bioassays
230
(ISO-14371 2012; OECD 2012), and fish embryo toxicity test (OECD 2013). Samples resulting in a
20-231
50% toxicity response were assigned to the “moderate toxicity” class, in agreement with the test validity
232
criteria defined for A. fischeri bioluminescence (Niemirycz et al. 2007) or for ostracod and cladocera
233
mortality (ISO-14371 2012; OECD 2012). For the purpose of the present study, a 20% effect boundary was
234
used for the Lemna re-growth tests for which validity criteria have not yet been established. This criterion
235
ensures consistency with the results from the multiple-organisms trial and is in line with the hazard
236
classification system proposed by Persoone et al. (2003), which recommends the use of a 20% effect level
237
as the lowest significant toxic impact value. However, this threshold was lowered to 10% in the Danio
238
embryo tests, as per OECD (2013). The criteria for abnormal diatom valves (% teratologies) included three
239
categories with narrow ranges. The upper limit for the “no toxicity” class was set at 0.5%, which is
240
regarded as the baseline in natural conditions, as suggested by Morin et al. (2008a) and Arini et al. (2012).
241
Teratology percentages ranging between 0.5-1% were assigned to the category “moderate toxicity” based
242
on previous observations (Lavoie et al. 2012; Morin et al. 2012; Pandey et al. 2014, 2015; Pandey and
243
Bergey 2016), while values above 1% were assigned to the category “high toxicity”. The toxicity classes
244
for diatom teratologies are subjected to modifications due to insufficient information and data regarding the
245
presence and type of abnormalities as a response to stress along a contamination gradient (Lavoie et al.
246
2017).
247
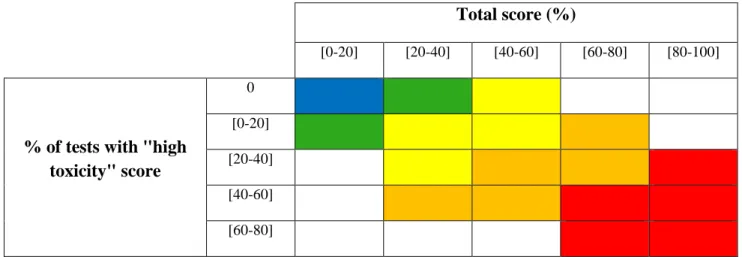
2.4 Overall toxicity assessment
248
A score was assigned to each toxicity class (“no toxicity” = 0, “moderate toxicity” = 1, and “high
249
toxicity” = 2), allowing for the calculation of a total score integrating the response of all organisms tested.
250
Where multiple endpoints were tested on an organism (reproduction, growth, and mortality), it was the
251
worst toxicity class observed that was considered for the calculation of the final score. Here, the maximum
252
total score possible is 14, based on the seven biological descriptors included in the present study. However,
253
this value will differ as a function of the number of bioassays tested in future bioassessments. The total
254
toxicity value is then reported as a percentage. Low values indicate no or low toxicity. Finally, each sample
255
10
was assigned an overall toxicity category by considering both their toxicity class and the number of tests
256
(expressed as %) that obtained a score of 2, “high toxicity” (Table 2). For example, a sample which would
257
obtain the following scores for each of the seven tests: 0, 2, 1, 0, 1, 0, and 2, would have a total score of 6
258
out of a maximum of 14 (6/14*100 = 43%). Two out of the seven tests would have been classified as “high
259
toxicity” (score value = 2), which represents 29% of the cases (2/7*100 = 29%). Following the criteria
260
proposed in Table 2, this sample would be categorised as “toxic” (D).
261
3. Results and Discussion
262
3.1. Physico-chemical assessment of water quality
263
The purpose of this study was to evaluate the potential of various toxicity bioassays for testing
264
water toxicity in natural freshwaters and to develop a scoring system allowing for an integrated assessment
265
of aquatic ecosystems health. An exhaustive presentation of the chemical and physical properties of the
266
tested waters is thus beyond the scope of this paper. Briefly, analysis of the physicochemical characteristics
267
of the 16 sites sampled (Table 3) revealed that all waters were nutrient-enriched. Particularly elevated
268
nitrogen concentrations and high conductivities were found at N2 and N3 (Nakdong River), as well as at
269
H1 and H2 (Han River). Water quality data for these four sites (N2 and N3; H1 and H2) represented the
270
most severely impacted conditions with particularly high suspended solids and elevated metal
271
concentrations (zinc at H1 and H2, Han River; copper and nickel at N2 and N3, Nakdong River). The
272
remaining sites were less impacted, based on the data available. However, it is worth highlighting the high
273
TP values measured in the samples collected on the Geum River, in particular, G1, G2, G3, and G4 (TP =
274
0.28 ± 0.03 mg L-1). Organic compound analyses were also conducted during this survey, and
275
concentrations were below detection limits (data not shown). The fact that organic contaminants were not
276
detected is surprising because these ecosystems receive wastewater effluents from 34 industrial complexes
277
distributed along the four main rivers studied. Moreover, Cho et al. (2014) published the results from an
278
extensive survey conducted by the South Korean government and reported the presence of numerous toxic
279
chemicals (mainly organochlorine and organophosphate pesticides, volatile organic compounds, solvents,
280
and plasticisers) in these environments. As stated previously, traditional water chemistry measurements are
281
not always reliable to fully characterise environmental conditions because they do not integrate fluctuations
282
in water quality, and they are susceptible to missing intermittent contamination unless samples are collected
283
11
during wastewater effluent release or high-resolution analyses are performed. It is also possible that the low
284
concentrations of organic contaminants observed in the present study, compared with the values reported in
285
Cho et al. (2014), reflect the efforts of the South Korean government to reduce contaminant inputs from
286
industrial effluents.
287
3.2. Bioassay-based toxicity assessment
288
According to a report on a survey and evaluation of aquatic ecosystem health in South Korea
289
(Hwang et al. 2011), some rivers and streams are considerably contaminated in the country and are in
290
worse biological condition than predicted by conventional chemical analysis data. As a result, the country
291
recently adopted the use of bioindicators to improve water quality evaluation as part of a more integrated
292
concept of ecological status assessment. The use of biological descriptors is now part of the surface water
293
management policy in South Korea with the creation of the “Nationwide Aquatic Ecological Monitoring
294
Program (NAEMP)”. This new monitoring program is similar to the Water Framework Directive
295
established in the European Union (2000/60/EC), where the use of organisms from multiple biological
296
compartments (different trophic levels and different life strategies) is recommended in addition to
297
chemical, physical, and bacteriological parameters for examining the ecological status of fluvial
298
ecosystems (Geiszinger et al. 2009). Data gathered from the multiple bioassays used in this study provide
299
preliminary considerations for the development of a biological index of river water toxicity and serve as a
300
foundation for future optimisation of the approach. The results from each test are presented in Table 4,
301
along with CI and F-statistics from analysis of variance (ANOVA). The overall toxicity index values for
302
the 16 tested waters are reported in Table 5, along with individual scores obtained for each test organism.
303
The toxicity categories were attributed based on the criteria presented in Tables 1 and 2. The results for all
304
biological descriptors, as well as the final toxicity categories, are presented in detail and discussed in the
305
following paragraphs.
306
3.2.1. Inhibition of bioluminescence
307
Bacterial bioluminescence inhibition assays are commonly used to evaluate the toxicity of
308
contaminants released by wastewater effluents (e.g., Rodrigues and Umbuzeiro 2011). Here, inhibition of
309
bioluminescence in Aliivibrio fischeri, after exposure to the 16 river water samples, was used to evaluate its
310
potential in determining the toxicity of natural river waters. Significant luminescence inhibitions were only
311
12
revealed for the N2 and G2 sites, with changes of -28% (CI = 3%) and -16% (CI = 3%), respectively (Table
312
4). Based on the criteria established for this bioassay (Table 1 and Table 2), almost all sites were
313
categorised as “no toxicity”, except N2, which exhibited “moderate toxicity” (Table 5). The higher metal
314
concentrations at N2 were probably responsible for the observed toxicity, potentially in combination with
315
other toxic organic compounds suspected to contaminate these rivers (according to Cho et al. (2014)).
316
Because the presence and concentrations of the various contaminants may vary greatly, depending on
317
various factors such as water level and timing of wastewater effluent release in the river water, it is possible
318
that the other water samples were not as toxic to bacteria as was previously observed (MOE 2007). It is
319
also possible that Aliivibrio fischeri is simply not very sensitive to the type and level of contamination
320
tested in this study, as was observed by Macken et al. (2009) with the same bacterium shown to be the least
321
sensitive indicator tested for Cd contamination. Stimulation of bacterial metabolism was also observed in
322
the present study, with a significant increase in bioluminescence for the water sample collected at H2 (19%,
323
CI = 15%). This increased bioluminescence, compared to the control, may result from interferences caused
324
by the presence of volatile or insoluble substances in the waters (ISO 11348-1), or from a biological
325
response. Indeed, the presence of higher (but non-lethal) concentrations of metals, nutrients, and organic
326
matter in the waters tested compared to the control may, in turn, favour bacterial metabolism. For example,
327
bioluminescence stimulation of Aliivibrio species was also observed under metal exposure in other studies
328
(Fulladosa et al. 2005, 2007; Shen et al. 2009) and was attributed to hormesis (Calabrese 2005).
329
Based on the lack of a clear response of the bacteria to the test waters in this study, i.e., no strong
330
inhibition observed and stimulation of bioluminescence noted for numerous samples, this bioassay does not
331
seem to be sensitive enough nor appropriate when used alone for routine biological assessments of flowing
332
water toxicity. Becouze-Lareure et al. (2016) came to the same conclusion when assessing water and
333
sediment quality of a peri-urban river subjected to combined sewer overflow, which is also supported by
334
others (Angerville 2009; Gonzalez-Merchan et al. 2014a, b). This acute bioluminescence test is usually
335
carried out with an exposure time of 30 minutes or less, which does not provide information on potential
336
adverse effects that may happen later (e.g., Backhaus et al. 1997). For example, Hsieh et al. (2004)
337
observed that chronic exposure (22 h) of Aliivibrio fischeri to seven priority pollutant metals showed a
338
13
toxic response at concentrations many-fold lower than for acute exposure (5 or 15 min). This suggests that
339
toxicity assessments based on bioluminescence could be better evaluated with longer exposure times.
340
3.2.2. Algal cell density
341
The Pseudokirchneriella subcapitata bioassay was selected for toxicity assessment in the present
342
study for various reasons. This species is easily available from culture collections and easily maintained
343
under laboratory conditions. It is among the most widely recommended species for freshwater toxicity
344
testing, with standard guidelines having been established (OECD 1984; Environment Canada 1992;
345
USEPA 1994), and this bioassay is currently being endorsed for regulatory purposes. Moreover, the
346
responses of P. subcapitata to a variety of contaminants and its relative sensitivity compared with other test
347
organisms have been studied extensively (e.g., Radix et al. 2000; Weyers et al. 2000).
348
Algal cells exposed to the 16 test water samples showed significant growth inhibition (Table 4)
349
when exposed to the water samples from H1 (-30%, CI = 8%) and N1 (-11%, CI = 5%), compared to the
350
controls (growth rate: 0.035 div h-1). Based on the selected toxicity thresholds, only H1 fell into the
351
“moderate toxicity” class (Table 5). These results are in contrast with the numerous reports of good
352
sensitivity of this test organism. For example, Katsumata et al. (2006) reported lower cell counts in P.
353
subcapitata when exposed to two herbicides (simazine and 3,5-dichlorophenol). However, it is most likely
354
that those pesticides have a more noticeable effect on algae (as their mode of action directly targets plant
355
functions) than do contaminants of largely industrial and municipal origin, as in the present study.
Moreira-356
Santos et al. (2004) reported a negative effect of a mine effluent (low pH, metals, and turbidity), with
357
growth inhibition reaching 98%, also suggesting good sensitivity of algal bioassays. The metal
358
concentrations in their study were much higher than the values observed in our selected South Korean
359
rivers which could explain why the magnitude of the effects we observed was lower. Moreover, acid mine
360
drainage (pH = 3) also likely inhibited algal growth in their study. The water samples from the Yeongsan
361
and Geum Rivers significantly stimulated algal growth (p < 0.005), which can most likely be attributed to
362
their nutrient-enriched waters (e.g., higher TP in the Geum River, see Table 3). This result suggests that the
363
potential toxicity of the samples may be overshadowed by the positive effect of nutrients on algae.
364
Although this algal bioassay does not seem to be very sensitive to the toxicity level and type of
365
contamination characterising the tested waters in the present study, it is worth noting that an increase in cell
366
14
density may provide information on the eutrophication potential of the waters. In other words, the fact that
367
most of the tested waters scored “no toxicity” does not guarantee good overall water quality.
368
3.2.3. Toxicity to Ostracoda
369
Freshwater ostracods are reported to be excellent bioindicators of surrounding physico-chemical
370
conditions and anthropogenic stressors (pesticides, hydrocarbons, and metals) (Ruiz et al. 2013). Mortality
371
in Heterocypris incongruens is a widely-used endpoint in ecotoxicology and constitutes a standardised
372
bioassay recognised by the International Organization for Standardization (ISO 2012). Ostracods in
373
bioassays are generally used to assess toxicity of solid phase matrices such as sediments or storm water
374
run-off particles (e.g., Chial and Persoone 2002a, b; Watanabe et al. 2008, 2011; Angerville et al. 2013)
375
because this organism spends most of its life in contact with sediments. However, this test has also been
376
used to assess the toxicity of various chemicals and to evaluate the toxicity potential of natural waters
377
(Toumi et al. 2015).
378
After six days of exposure to the tested waters, Heterocypris incongruens showed a mortality rate
379
higher than the 20% of the control. Mortality was significantly higher at H1 (with 100% mortality on the
380
date of recovery, p < 0.0001) and lower at G5 and G6 (≤ 10%, p <0 .05). Concerning growth, cell
381
elongation in control was higher than expected, with final ostracod lengths 2.8 (± 0.2)-fold the initial sizes.
382
With exposure to the tested waters, growth inhibition compared to the controls was highlighted at G2 (44%,
383
CI = 19%), G3 (45%, CI = 37%), and Y1 (52%, CI = 19%). Based on the criteria presented in Table 1, H1
384
and Y1 received the “high toxicity” score, while G3 and G2 were classified in the “moderate toxicity”
385
category. The remaining sites were classified as “no toxicity”. Compared to the bacterial and algal
386
bioassays, the response of the ostracods suggests that they have a higher sensitivity to the toxicity of the
387
samples, with four sites highlighting toxicity, including two with the highest score (Table 5). In a study on
388
the effects of metals on H. incongruens, Sevilla et al. (2014) observed that aquatic exposure to different
389
concentrations of dissolved Cd (3.2-339 µg L-1) and Cu (260-2600 µg L-1) resulted in high mortalities
(57-390
100% and 95-100%, respectively). Watanabe et al. (2011) also reported high mortality in ostracods exposed
391
to elevated concentrations of metals (Cu, Zn, Ni, As, Cd, and Pb). Based on water chemistry measurements
392
available for this study, metal concentrations were much lower than the above-mentioned values, which
393
could partly explain the lower mortality rates observed. Moreover, the toxicity found using the ostracod
394
15
bioassay in this study may also result from exposure to other substances that were not measured by the
395
targeted micropollutant analyses, or it may reflect an integrated response to a cocktail of multiple
396
chemicals.
397
3.2.4. Toxicity to Cladocera
398
The Daphnia magna acute toxicity test is a common standard protocol to help regulate wastewater
399
effluents. However, this organism has not been found in aquatic systems in Korea. Thus, it has been
400
suggested that a domestic species, rather than the international standard species, be used for the Korean
401
whole effluent toxicity criteria. Moina macrocopa, which has been widely used in ecotoxicology
402
applications, is one of the most promising domestic species for this purpose. Kim et al. (2012) found that
403
effluents discharged from wastewater treatment plants in Korea induce multi-level toxicity, including acute
404
toxicity, feeding rate inhibition, and oxidative stress in M. macrocopa. Yi et al. (2010) found that M.
405
macrocopa was more sensitive to toxins than Daphnia magna, based on an acute toxicity test with
406
industrial effluents. Ji et al. (2008) noted significantly higher % mortality (50-100%) in M. macrocopa
407
when exposed to PFOS (perfluorooctane sulfonic acid) and PFOA (perfluorooctanoic acid) than in the
408
control treatment. These results show the sensitivity of this cladoceran species when exposed to high
409
concentrations of contaminants or when directly incubated with wastewaters. However, in the context of
410
the present study, the contamination levels of the tested waters were undoubtedly lower, which could
411
explain the fact that most samples were categorised as “no toxicity” (Table 5). Mortality assessment was
412
invalidated by the 22% mortality in the controls. Growth was significantly affected by exposure to the
413
tested waters (F = 4.49; p ≤ 0.001), with significant growth inhibition at N1, H2, Y3, Y1, N3, G5, G6, and
414
Y4, compared to the control. However, despite significant differences with the control, growth inhibition
415
was always lower than 20% and therefore did not suggest toxicity. Contrastingly, reproduction expressed as
416
offspring production per female was inhibited by 44% (CI = 8%) at Y4, falling into the “moderate toxicity”
417
category (Table 5). Nine-day exposure to this water sample also led to 50% mortality (although this
418
endpoint was not considered due to >20% mortality in control). Interestingly, significant increases in
419
offspring production were observed in G1, G3, and H1 (p ≤ 0.05), where survival was 100%. The same
420
pattern, although not significant, occurred at N3. This suggests that Moina macrocopa was indifferent to, or
421
even stimulated by the substances present in these waters. It must be noted, however, that the test was not
422
16
replicated and was invalidated due to high mortality under control condition. Based on the reproduction of
423
M. macrocopa, all the natural waters tested reflected a non-toxic environment, except site Y4 in the
424
Yeongsan River.
425
3.2.5. Fish bioassay
426
Worldwide, zebrafish has proven to be popular for toxicity evaluations because they are easy to
427
keep and to breed in the laboratory, are free of pathogenic microorganisms, and deliver eggs of high quality
428
independent of the season (Bresch 1991). For the purpose of this study, fish embryos were incubated with
429
river waters and toxicity was estimated based on % mortality. The results suggest that the tested waters are
430
generally of “moderate toxicity”, based on the selected criteria (Table 5), except for the samples from N1,
431
Y4, G1, G4, and G6, which exhibited < 10% mortality (Table 4). It must be noted that this exposure test
432
was not replicated. One hundred percent of surviving eggs hatched within 96 hours, irrespective of the
433
treatment.
434
In line with numerous studies showing the sensitive response of zebrafish embryos to wastewaters
435
of differing compositions (e.g., Şişman et al. 2008; Vincze et al. 2014), the results obtained here from
436
exposure to natural waters showed some toxicity for more than 50% of the samples. This finding may
437
reflect the sensitivity of fish embryos to moderate contamination and/or to a wide variety of substances.
438
However, it is worth underscoring the fact that, following the OECD (2013) specifications, we used a more
439
conservative effect value (10%) as the lower boundary for the “moderate toxicity” class.
440
3.2.6. Lemna root re-growth
441
The small size, structural simplicity, and rapid growth of Lemna are some of the characteristics
442
that make it advantageous for use in laboratory toxicity tests (Park et al. 2017). Moreover, this plant is an
443
essential primary producer and has a wide geographical distribution. Bioassays using Lemna as a test
444
organism are traditionally based on endpoints such as the number of fronds, their growth rate and their wet
445
or dry biomass, which require standard exposure durations of at least seven days to detect toxicity (Park et
446
al. 2017). Roots of Lemna minor are highly sensitive to environmental stressors (Panda and Upadhyay
447
2003). However, there have been few studies incorporating root elongation as a test endpoint, partly due to
448
the fragility of the roots, which introduces difficulties into measurements (Davis 1981), and to the difficulty
449
of obtaining a sufficient number of test specimens with identical root lengths for exposure experiments.
450
17
The use of Lemna in ecotoxicology assessments has thus been re-evaluated (Gopalapillai et al. 2014; Park
451
et al. 2017) using root re-growth (after cutting them at the base) as an endpoint. This method has been
452
shown to be sensitive, precise, and ecologically significant in comparison with more traditional
453
measurements such as frond growth and biomass.
454
Root elongation under control conditions was 34 ± 4 mm. Compared to the controls, exposure of
455
L. minor to the 16 water samples collected in South Korean rivers showed significant toxicity for six sites
456
(Table 4). Samples from the Han River (H1 and H2) fell into the category “high toxicity”, and “moderate
457
toxicity” was noted for N2, N3, Y4, and G1; while the remaining 10 sites were considered “non-toxic”
458
(Table 5). The observed root re-growth inhibition may be a response to elevated zinc concentration in the
459
Han River, as this bioassay was shown to respond to metal contamination. For example, Park et al. (2013)
460
reported root elongation in three Lemna spp. exposed to Ag, Cd, Cr, Cu, and Hg to be a sensitive endpoint
461
to assess metal toxicity. However, in the sites where “moderate toxicity” was observed, metals do not seem
462
to represent a contamination concern, at least not based on measurements of punctual water samples taken
463
for these experiments. We cannot exclude a contribution of organic contaminants (and additive/synergistic
464
effects) to the observed toxicity, which may not have been detected owing to concentrations being below
465
the detection limit and/or because they were not targeted in the analysis (unknown compounds such as
466
degradation products).
467
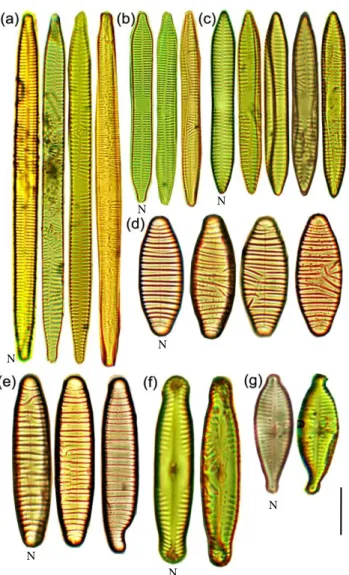
3.2.7. Diatom teratologies
468
Percent deformed frustules were examined from periphytic diatom samples collected at the 16
469
sites (Fig. 2). Diatom deformities were found at high abundance at H2 (5.9 ± 0.7%) and H1 (4.9 ± 0.4%).
470
N2, Y1, and Y3 also showed potential toxicity, with deformities present at > 1%. Based on the categories
471
tentatively suggested for this study, these teratology occurrences would place these five samples into the
472
category “high toxicity”. A marginal increase in diatom teratologies was also noticed at N1 (0.8 ± 0.7%)
473
and N3 (0.7 ± 0.1%), which were thus categorised as being of “moderate toxicity” (Table 5).
474
The approach based on diatom teratologies differs markedly from the six bioassays presented
475
above because it is conducted with organisms collected in situ, and therefore reflects an integrated response
476
to environmental fluctuations over a longer period of time. Moreover, the assessment of toxicity is not
477
based on the level of inhibition or mortality compared with a control. Rather, control conditions are
478
18
estimated to be the % of teratologies generally encountered in natural systems with minimal disturbance
479
(observed to be ≤ 0.5%, based on Morin et al. 2012). In this study, the % deformities averaged for three
480
sites (four replicates per site) sampled upstream of contamination was 0.3 ± 0.1%. One particular advantage
481
of using teratologies as indicators of contamination is that no exposure experiment is required because
482
samples are collected in situ and examined, which allows for sampling of multiple sites in a short period of
483
time. Moreover, analyses can be performed later if samples are properly stored and preserved.
484
The ecological status of the same 16 sites was also assessed based on a suite of diatom
485
descriptors (cell size, frustule health, lipid bodies, frustules deformities, etc.) in previous studies (Pandey
486
and Bergey 2016; Pandey et al. 2018). Overall, the authors found that water quality assessment based on
487
diatom assemblages and diatom-based metrics had a good fit with the available physicochemical data (least
488
versus most impacted sites). However, as was observed in the present study, a greater number of sites
489
showed signs of degradation based on the diatom metrics used (biological descriptors) compared with the
490
available physicochemical data. This suggests that the use of biotic indicators provides useful
491
complementary information on ecosystem health status at the selected sites, and that in situ diatom
492
assemblages are good assessment tools for monitoring rivers, alone or in combination with bioassays.
493
3.3. Bioassay scores and overall index values
494
3.3.1. Toxicity assessment of water samples: complementarity of the bioassays
495
The scores obtained for the six bioassays after exposure to the 16 test water samples as well as for
496
the diatom teratology assessment are presented in Table 5, along with the overall index classes. The test
497
organisms used covered different trophic levels, from decomposers (A. fischeri) and primary producers (P.
498
subcapitata, L. minor, diatoms), to primary consumers (H. incongruens and M. macrocopa) and, ultimately,
499
secondary consumers (D. rerio). The scores obtained for each test organism varied greatly, with certain
500
bioassays indicating high toxicity while others showed no response. The bacterial and microalgal bioassays
501
were the least sensitive because only one of the water samples was characterised as being of moderate
502
toxicity. The fish embryo test was the most sensitive to the types of contamination present in the test waters
503
because it showed a response in almost all samples. Different levels of responses to toxicity were observed
504
in the present study, with only ostracods, duckweed, and diatoms evidencing “high toxicity” for certain
505
samples. This heterogeneity in response sensitivity using multiple organisms was also noted in other
506
19
bioassay-based assessments (e.g., Persoone et al. 2003; Pandard et al. 2006; Mankiewicz-Boczek et al.
507
2008). Organisms from various trophic levels have also shown different responses to perturbations using
508
biological indices based on assemblage structure and other biological descriptors (e.g., Marzin et al. 2012;
509
Lainé et al. 2014). In fact, this combination of trophic levels allows for a better assessment of the overall
510
contamination of waters by substances with different modes of action as well as biological targets.
511
When contamination was high, such as at H1, most bioassays (five out of seven) highlighted potential
512
toxicity. This was also the case, to a lower extent, at N2 and H2. The advantages of this multi-bioassay
513
approach are more striking in the case of subtle water contamination. In the latter case, the type of
514
organisms affected, or the functions impaired, could provide valuable information to identify the potential
515
nature of contamination. For example, despite the low sensitivity of the P. subcapitata bioassay to water
516
toxicity, microalgal growth was significantly enhanced at 10 sites, where higher nutrient loads were found.
517
Analysing this response in light of the response of the other test organisms, two scenarios can be
518
hypothesised. First, growth could have been stimulated by higher nutrient availability at sites with low
519
concentrations of toxicants. This scenario may be valid at sites Y2, G2, G3, G5, G7, and G6, where no
520
toxicity was observed on other plant organisms tested (macrophytes and diatoms). In contrast, and given
521
the high sensitivity of the root re-growth assay to metal contamination (Park et al. 2013), and of diatom
522
teratologies (Morin et al. 2012 Lavoie et al. 2017), a second scenario likely occurred at Y1, Y3, Y4, G1,
523
and G4: the stimulating effects of nutrients on microalgae may have masked the potential toxicity of zinc
524
present in the test waters. Microalgal growth stimulation by nutrients in metal- (Cd/Zn) contaminated sites
525
was also observed in periphytic biofilms (Morin et al. 2008b). The first scenario, however, only discards
526
the presence of plant-targeting substances; indeed, some toxicity was observed in the growth of freshly
527
hatched ostracods and/or in fish embryo survival at G2, G3, G5, and G7. This suggests contamination by
528
compounds specifically affecting the first stages of animal cell development. In contrast, at N2 and H1,
529
moderate to high toxicity was found through diverse bioassays, covering different trophic levels; this may
530
be the consequence of contamination by narcotic toxicants (i.e., non-specific acting) or by a mixture of
531
dissimilarly acting compounds. The results from the present study underscore the significant benefit of
532
using a multi-organism approach allowing for a better integration of water quality testing, which in turn
533
results in a more complete assessment of complex environmental stresses. Moreover, this approach is of
534
20
particular significance in the goal to characterise the overall water toxicity of the freshwater ecosystem.
535
Organisms have the major advantage of reflecting the toxic potential of waters, which cannot be
536
sufficiently highlighted by chemical measurements alone due to the limitations stated below.
537
3.3.2. Toxicity scores versus water chemical analyses
538
Based solely on available water chemistry data, N2, N3, H1, and H2 are the sampling sites
539
suggesting more severely degraded conditions, mostly due to high metal concentrations, total nitrogen,
540
coliforms, BOD, and conductivity. No toxic contamination (metals or organic compounds) was found at the
541
other sampling sites based on water chemistry (Pandey et al. 2018). The results from the present
multi-542
bioassay study identified H1 as “highly toxic” to living organisms (class D). N2, H2, Y1, and Y3 were
543
classified into the “moderate toxicity” class (C), and N3 into the “slight toxicity” class (B). Some sites,
544
although exhibiting some impact (e.g., two assays indicating some toxicity at Y4, G2, and G3), fell into the
545
“no toxicity” category. All samples from the Geum River, as well as N1, Y2, and Y4, were considered not
546
toxic to aquatic life. The fact that additional sampling sites suggested some toxicity when using biological
547
descriptors compared to chemistry alone underscores that (i) chemical analyses cannot be exhaustive (some
548
compounds with toxicity may not have been targeted), (ii) quantification limits may be higher than the
549
toxic concentrations, and (iii) mixture effects are not considered. In fact, toxicity often results from the
550
effects of a cocktail of compounds and their degradation products (Kim Tiam et al. 2016), which renders
551
the task of water quality assessment even more challenging due to additive, synergistic, and antagonistic
552
interactions.
553
3.3.3. Scoring approach: preliminary considerations
554
Classification based on the “harmfulness potential” of natural waters is relatively uncommon as
555
bioassays are generally used to derive EC50 for particular chemicals or for wastewaters. The most similar
556
approach found for comparison is the scoring system presented by Persoone et al. (2003) and also used by
557
Mankiewicz-Boczek et al. (2008), where the scores obtained from the bioassays are expressed as an overall
558
degree of hazard or toxicity. Although the toxicity classes differ as well as the overall method for indexing
559
hazardous potential of the sample, the approach proposed in the present study is generally comparable to
560
that of Persoone et al. (2003). As mentioned in the methods, the criteria used to establish the toxicity
561
categories and scores might be subjected to change in the future as the use of this approach becomes more
562
21
popular and experience is gained. For example, the criteria were set using similar boundaries between
563
biotests for simplicity, but this may be refined as similar studies multiply. The final overall toxicity classes
564
may also have to be refined in the future, but as of now, this classification system seems to be appropriate
565
to adequately qualify the tested waters. This type of investigation is still in its infancy and it is presently
566
difficult to identify the most sensitive and reliable test organisms. As an example, bioluminescence does
567
not seem to be an appropriate bioassay based on the results from this study. However, this does not
568
necessarily mean that bacteria-based bioassays are inefficient. The potential toxic effects of natural waters
569
on bioluminescence need to be tested using a larger array of water samples covering a range of different
570
types of contamination. This statement is also valid for the other organisms tested. With experience, it
571
should become easier to select the suite of organisms that is most appropriate for the type of water tested,
572
based on the nature of the suspected contamination (when this applies). The main objective of this
573
preliminary investigation was to lay the foundation for this biomonitoring approach in South Korean rivers,
574
and the results are promising in the way that the test organisms used complemented each other and
575
supplemented traditional chemistry measurements.
576
Conclusion
577
South Korean rivers, as with many rivers worldwide, receive a great deal of various chemicals
578
from urban, industrial, and agricultural activities, which makes the measurement of all substances
579
practically impossible (e.g., Vörösmarty et al. 2010). Moreover, new chemical compounds are constantly
580
detected in surface waters, rendering the task of water toxicity assessment even more challenging and
581
costly. The toxicity index proposed in this study is a valuable tool for preliminary screening of water
582
contamination as an alternative or in addition to traditional chemistry-based assessments. Based on the 16
583
water samples collected, the various bioassays tested provided complementary information to chemical
584
analyses by flagging additional sites as being potentially degraded. The variability in the response of each
585
organism to water exposure underscores the need for testing toxicity based on a multi-organism approach,
586
which can possibly highlight the kind of toxic substance that is most responsible for water degradation. As
587
it would be utopic to recommend using all organisms in routine monitoring, suggesting to at least test water
588
samples using representative organisms from different trophic levels seems appropriate at this time.
589
22
Acknowledgement
591
This work was partly supported by Post-Doctor Research Program (2016) through Incheon National
592
University and Industrial Strategic Technology Development Program (Grant No. 10079956) funded by the
593
Ministry of Trade, Industry & Energy. We are grateful to Dr J.C. Taylor (North-West University, South
594
Africa) for his generous donation of Pleurax and to Emilie Saulnier-Talbot for valuable comments on the
595
manuscript and for English revision.
596
597
References
598
599
Ahlf, W., Hollert, H., Neumann-Hensel, H., & Ricking, M. (2002). A guidance for the assessment and
600
evaluation of sediment quality: a German approach based on ecotoxicological and chemical
601
measurements. Journal of Soils and Sediments, 2, 37–42.
602
Angerville, R. (2009). Evaluation des risques écotoxicologiques liés au déversement de rejets urbains par
603
temps de pluie (RUTP) dans les cours d'eau : Application à une ville française et à une ville
604
haïtienne. Chemical Sciences. INSA de Lyon, in French.
605
Angerville, R., Perrodin, Y., Bazin, C., & Emmanuel, E. (2013). Evaluation of ecotoxicological risks
606
related to the discharge of combined sewer overflows (CSOs) in a periurban river. International
607
Journal of Environmental Research and Public Health, 10, 2670-2687.
608
Ankley, G.T., Schubauer-Berigan, M.K., & Hoke, R.A. (1992). Use of toxicity identification evaluation
609
techniques to identify dredged material disposal options: a proposed approach. Environmental
610
Management,16, 1–6.
611
Arini, A., Feurtet-Mazel, A., Maury-Brachet, R.,Pokrovsky, O. S., Coste, M., & Delmas, F. (2012).
612
Recovery potential of periphytic biofilms translocated in artificial streams after industrial
613
contamination (Cd and Zn). Ecotoxicology, 21, 1403-1414.
614
Backhaus, T., Froehner, K., Altenburger, R., & Grimme, L. H. (1997). Toxicity testing with Vibrio fischeri:
615
A comparison between the long term (24 h) and the short term (30 min) bioassay. Chemosphere,
616
35, 2925-2938.
617
Becouze-Lareure, C., Thiebaud, L., Bazin, C., Namour, P., Breil, P., & Perrodin, Y. (2016). Dynamics of
618
toxicity within different compartments of a peri-urban river subject to combined sewer overflow
619
discharges. Science of the Total Environment, 539, 503–514.
620
Bresch, H. (1991). Early life-stage in zebrafish versus a growth test in rainbow trout to evaluate toxic
621
effects. Bulletin of Environmental Contamination and Toxicology, 46, 641–648.
622
Calabrese, E.J. (2005). Paradigm lost, paradigm found: The re-emergence of hormesis as a fundamental
623
dose response model in the toxicological sciences. Environ. Pollut, 138, 378-411.
624
Canesi, L., & Corsi, I. (2016). Effects of nanomaterials on marine invertebrates. Science of The Total
625
Environment, 565, 933-940.
626
Cerisier, A., Vedrenne, J., Lavoie, I., & Morin, S. (2018). Assessing the severity of diatom deformities
627
using geometric morphometry. Botany Letters, 1-9.
628
Chial, Z. B., & Persoone, G. (2002a). Cyst-based toxicity tests XII - Development of a short chronic
629
sediment toxicity test with the ostracod crustacean Heterocypris incongruens: selection of test
630
parameters. Environmental Toxicology, 17, 520-527.
631
Chial, Z. B., & Persoone, G. (2002b). Cyst-based toxicity tests XIV - Application of the ostracod
solid-632
phase microbiotest for toxicity monitoring of river sediments in Flanders (Belgium).
633
Environmental Toxicology, 17, 533-537.
634
Cho, E., Khim, J., Chung, S., Seo, D., & Son, Y. (2014). Occurrence of micropollutants in four major rivers
635
in Korea. Science of the Total Environment, 491-492, 138-147.
636
Chu, K. W., & Chow, K. L. (2002). Synergistic toxicity of multiple heavy metals is revealed by a
637
biological assay using a nematode and its transgenic derivative. Aquatic Toxicology, 6, 53–64.