Submitted 2 March 2018 Accepted 9 April 2018 Published 23 April 2018 Corresponding author Richard Villemur, richard.villemur@iaf.inrs.ca Academic editor Ludmila Chistoserdova Additional Information and Declarations can be found on page 20
DOI 10.7717/peerj.4679
Copyright 2018 Geoffroy et al. Distributed under
Creative Commons CC-BY 4.0
OPEN ACCESS
Strain-level genetic diversity of
Methylophaga nitratireducenticrescens
confers plasticity to denitrification
capacity in a methylotrophic marine
denitrifying biofilm
Valérie Geoffroy1,2, Geneviève Payette1, Florian Mauffrey3, Livie Lestin1, Philippe Constant1and Richard Villemur1
1Institut Armand-Frappier, Institut National de la Recherche Scientifique, Laval, Québec, Canada 2Lallemand, Montreal, Québec, Canada
3Laboratoire de santé publique du Québec, Ste-Anne-de-Bellevue, Québec, Canada
ABSTRACT
Background. The biofilm of a methanol-fed, fluidized denitrification system treating a
marine effluent is composed of multi-species microorganisms, among which
Hyphomi-crobium nitrativorans NL23 and Methylophaga nitratireducenticrescens JAM1 are the
principal bacteria involved in the denitrifying activities. Strain NL23 can carry complete
nitrate (NO−3) reduction to N2, whereas strain JAM1 can perform 3 out of the 4
reduction steps. A small proportion of other denitrifiers exists in the biofilm, suggesting the potential plasticity of the biofilm in adapting to environmental changes. Here, we report the acclimation of the denitrifying biofilm from continuous operating mode to batch operating mode, and the isolation and characterization from the acclimated biofilm of a new denitrifying bacterial strain, named GP59.
Methods. The denitrifying biofilm was batch-cultured under anoxic conditions. The
acclimated biofilm was plated on Methylophaga specific medium to isolate denitrifying
Methylophagaisolates. Planktonic cultures of strains GP59 and JAM1 were performed,
and the growth and the dynamics of NO−3, nitrite (NO−2) and N2O were determined.
The genomes of strains GP59 and JAM1 were sequenced and compared. The transcrip-tomes of strains GP59 and JAM1 were derived from anoxic cultures.
Results. During batch cultures of the biofilm, we observed the disappearance of
H. nitrativorans NL23 without affecting the denitrification performance. From the
acclimated biofilm, we isolated strain GP59 that can perform, like H. nitrativorans NL23, the complete denitrification pathway. The GP59 cell concentration in the acclimated biofilm was 2–3 orders of magnitude higher than M. nitratireducenticrescens JAM1 and H. nitrativorans NL23. Genome analyses revealed that strain GP59 belongs to the species M. nitratireducenticrescens. The GP59 genome shares more than 85% of its coding sequences with those of strain JAM1. Based on transcriptomic analyses of anoxic cultures, most of these common genes in strain GP59 were expressed at similar level than their counterparts in strain JAM1. In contrast to strain JAM1, strain GP59 cannot
reduce NO−3 under oxic culture conditions, and has a 24-h lag time before growth and
NO−3 reduction start to occur in anoxic cultures, suggesting that both strains regulate
reduce NO−2 as it carries a gene encoding a NirK-type NO−2 reductase. Based on the CRISPR sequences, strain GP59 did not emerge from strain JAM1 during the biofilm batch cultures but rather was present in the original biofilm and was enriched during this process.
Discussion. These results reinforce the unique trait of the species M.
nitratireducen-ticrescens among the Methylophaga genus as facultative anaerobic bacterium. These
findings also showed the plasticity of denitrifying population of the biofilm in adapting to anoxic marine environments of the bioreactor.
SubjectsBiotechnology, Genomics, Marine Biology, Microbiology, Biogeochemistry
Keywords Denitrification, Methylophaga, Methylotroph, Biofilm, Microbiology, Genomic heterogeneity, Marine environment, Bioprocess
INTRODUCTION
Denitrification describes the successive reduction of nitrate (NO−3) to nitrite (NO−2),
nitric oxide (NO), nitrous oxide (N2O), and nitrogen (N2) (Van Spanning, Delgado &
Richardson, 2005). This process is used by bacteria for respiration in environments with
low oxygen concentrations and with NO−3, NO−2, NO, and N2O as electron acceptors.
The process is driven by metalloenzymes NO−3 reductase, NO−2 reductase, NO reductase,
and N2O reductase (Einsle & Kroneck, 2004). As a facultative trait, denitrification occurs
frequently across environments, and is performed by bacteria of diverse origins (Zumft,
1997). Furthermore, numerous microorganisms carry incomplete denitrification pathways
for either their growth or detoxification, as NO−2 and NO are deleterious molecules (Kaspar,
1982;Poole, 2005;Schreiber et al., 2012;Simon & Klotz, 2013).
Several studies were carried out in our laboratory on a naturally-occurring multispecies denitrifying biofilm that has developed in a methanol-fed, fluidized denitrification continuous system that treated recirculating water of a marine aquarium at the Montreal Biodome. The biofilm consists of at least 15 bacterial species and numerous
protozoans (Labbé et al., 2003;Laurin et al., 2008), among which Methylophaga spp. and
Hyphomicrobiumspp. compose more than 50% of the biofilm (Labbé et al., 2007).Rissanen
et al. (2016) also observed the combination of Methylophaga spp. and Hyphomicrobium spp. in the fluidized-bed type denitrification reactors treating the recirculating seawater of the public fish aquarium SEA LIFE at Helsinki, Finland, suggesting the importance of these two genera in marine denitrification processes.
We isolated Hyphomicrobium nitrativorans NL23 and Methylophaga
nitratireducenti-crescensJAM1 from the biofilm of the Biodome denitrification system and showed they are
the main actors of the denitrifying activities (Labbé et al., 2003;Auclair et al., 2010;Auclair,
Parent & Villemur, 2012;Martineau et al., 2013a;Villeneuve et al., 2013). H. nitrativorans
NL23 can carry out complete NO−3 reduction to N2, whereas M. nitratireducenticrescens
JAM1 can perform three out of the four reduction steps; it misses the reduction of
NO−2 to NO (Martineau, Mauffrey & Villemur, 2015;Martineau et al., 2013b;Mauffrey et
H. nitrativoransNL23 and M. nitratireducenticrescens JAM1, we have demonstrated that a small proportion of other denitrifiers exists in the biofilm of the Biodome denitrification
system (Auclair, Parent & Villemur, 2012), suggesting the potential plasticity of the biofilm
in adapting to environmental changes.
Methylophagaspecies are halophilic marine methylotrophic gammaproteobacteria that
do not grow in the absence of NaCl and use one-carbon compounds (e.g., methanol) as sole carbon and energy sources with carbon assimilation proceeding via the
2-keto-3-deoxy-6-phosphogluconate (KDPG)-variant ribulose monophosphate (RuMP) pathway (Villeneuve
et al., 2013;Boden, 2012). The operating conditions of the Biodome denitrification process led to the enrichment of M. nitratireducenticrescens JAM1 in the biofilm, which is the only reported isolated Methylophaga species that can grow under anoxic conditions with
NO−3or N2O as sole electron acceptors (Auclair et al., 2010;Mauffrey et al., 2017;Mauffrey,
Martineau & Villemur, 2015). This trait is correlated with the presence in the genome of
two gene clusters encoding dissimilatory NO−3 reductases (narGHJI, referred as nar1 and
nar2), two gene clusters encoding cytochrome bc-type complex NO reductases (referred
as cnor1 and cnor2) and one gene cluster encoding a dissimilatory N2O reductase (nos)
(Villeneuve et al., 2013;Mauffrey, Martineau & Villemur, 2015). M. nitratireducenticrescens JAM1 lacks a gene encoding a dissimilatory copper- (NirK) or cytochrome cd1-type (NirS)
NO−2 reductase.
Our group has also investigated the potential of using the batch operating mode for the denitrification system instead of the continuous one as it prevailed at the Montreal Biodome. With this mode, a better real-time control was obtained to avoid sulfate-reduction
that can be easily occurring in seawater biotreatments (Labelle, 2004). In this report, we
aim to assess the impact of the batch operating mode on the bacterial population of the denitrifying biofilm. We observed the disappearance of H. nitrativorans NL23 without the loss of the denitrifying activities during the biofilm acclimation to this mode. We hypothesized that new denitrifiers were enriched during the biofilm acclimation, which displaced H. nitrativorans NL23. From this biofilm, a new denitrifying bacterial strain, named GP59, was isolated that is closely related to M. nitratireducenticrescens JAM1. We compared strain GP59 with M. nitratireducenticrescens JAM1 at the physiological, genomic and transcriptomic levels. Genomic data were also compared with available genomes of Methylophaga species. Our results present new insights of M. nitratireducenticrescens under anoxic environments. They also provide indications that strain-level genomic heterogeneities can influence the dynamism of the biofilm microbial population in adapting to new operating conditions.
MATERIAL AND METHODS
NO−
3, NO
−
2 and N2O measurements
Measurements of NO−3, NO−2 and N2O concentrations in all biofilm and planktonic
Biofilm acclimation
Artificial seawater (ASW) medium was composed of (for 1 liter solution): 27.5 g NaCl,
10.68 g MgCl2*6H2O, 2 g MgSO4*7H2O, 1 g KCl, 0.5 g CaCl2, 456µL of FeSO4*7H2O
4 g/L, 5 mL of KH2PO4 51.2 g/L, 5 mL of Na2HPO434 g/L. It was supplemented with
1 mL of trace elements (master solution: FeSO4*7H2O 0.9 g/L, CuSO4*5H2O 0.03 g/L
and MnSO4*H2O 0.2 g/L) (Labbé, Parent & Villemur, 2003) and NaNO3 (21.4 mM or
300 mg-N/L). The pH was adjusted (NaOH) at 8.0. Three 120-mL vials containing each 20 unused ‘‘Bioflow 9 mm’’ carriers (Rauschert, Steinwiessen, Germany) and 60 mL of ASW
were purged of oxygen for 10 min with pure nitrogen gas (N2, purity > 99.9%; Praxair,
Mississauga, ON, Canada), sealed with sterile septum caps and autoclaved. Prior use, these carriers were washed with HCl 10% (v/v) for 3 h, rinsed with water and autoclaved. A
90µL volume (72 mg) of filtered-sterilized methanol was then added to the vials (0.15%
v/v final concentration).
Carriers (Bioflow 9 mm) with the denitrifying biofilm were taken from the denitrification
system at the Montreal Biodome and frozen at −20◦C in seawater with 20% glycerol
(Laurin et al., 2006) until use. The biomass from several frozen carriers was thawed, scrapped, weighted and dispersed in the ASW medium at 0.08 g (wet weight)/mL. The
biomass (5 mL/vial, 0.4 g of biofilm) was then distributed with a syringe and an 18G112
needle to three vials. The vials were incubated at room temperature and 100 rpm with an orbital shaker in the dark. In average once a week, the vial was opened in ambient air, the carriers were taken, gently washed with ASW medium to remove the excess medium and the free bacteria, then transferred into vials with fresh anoxic medium, and incubated in
the same conditions (Fig. S1). Methanol and NO−3 were added when needed if NO−3 was
completely depleted during the week. After the 5th transfer, the biofilm was collected. One
part was preserved in 15% glycerol at −70◦C for further used such as DNA extraction (see
below). The other part was used to isolate bacterial isolates (next subsection). Isolation of Methylophaga sp. strain GP59
The acclimated biofilm was dispersed in saline solution (3% NaCl, 34.2 mM phosphate buffer pH 7.4), and serial dilutions were made and inoculated onto the Methylophaga medium 1403 (American Type Culture Collection [ATCC], Manassas, VA, USA)
supplemented with 1.5% agar and 0.3% v/v methanol. The plates were incubated at 30◦C
for no more than 7 days, under oxic conditions (no NO−3) or under anoxic conditions
in anoxic jars with a gaspak (BBLTMGasPakTM Plus Anaerobic System). For the latter
conditions, the medium was supplemented with 21.4 mM NaNO3. Several colonies were
picked and cultured in the Methylophaga 1403 liquid medium under oxic or anoxic conditions for 2–7 days. After restreaking three times onto agar medium, isolates were
tested for growth under anoxic conditions. NO−3 and NO−2 consumption was measured
after four days of incubation. Identification of the isolates was determined by extracting total DNA from the isolates, followed by PCR amplification of the 16S ribosomal RNA
(rRNA) genes (forward primer 50-AGAGTTTGATCCTGGCTCAG-30and reverse primer
to 1,540 in the Escherichia coli 16S rRNA gene) and the sequencing of the resulting PCR products (McGill University and Genome Quebec Innovation Center, Montréal QC, Canada).
Planktonic pure cultures
M. nitratireducenticrescensGP59 and JAM1 were cultured in the Methylophaga medium
1403 as described byVilleneuve et al. (2013)with 0.3% methanol. When required, NO−3
(NaNO3) was added to the medium. For the anoxic cultures, 70-ml vials with 30 ml
medium were flushed with pure nitrogen gas for 20 min, sealed with sterile septum caps
and autoclaved. Culture bottles were incubated at 30◦C (unless stated otherwise) in the
dark. In the determination of optimal growth conditions, the pH, temperature and NaCl
concentrations were adjusted in the Methylophaga medium 1403. For N2O measurements,
720-mL bottles with 60-ml medium were used. For oxic cultures, cultures were performed
in Erlenmeyer flasks and shaken at 150 rpm and 30◦C (Mauffrey et al., 2017). Bacterial
growth was monitored by spectrophotometry (OD600 nm). Bacterial flocs were dispersed
with a Potter-Elvehjem homogenizer prior to measurements when needed. DNA extraction of the biofilm and quantitative PCR
The frozen samples of the biofilm taken from the denitrification system and of the acclimated biofilm taken after the 5th transfer were thawed, and washed 3 times with 0.5 mL the TEN buffer (50 mM Tris–HCl pH 8.0, 10 mM EDTA.2Na, NaCl 150 mM) and 5,000 g centrifugation for 2 min. The biomass was dispersed in 0.5 mL TEN with lysozyme
(2.5 mg/mL) and incubated at 37◦C, 30 min. After adding sodium dodecyl sulfate and
β-mercaptoethanol (final concentrations of 2% and 1%, respectively), the biomass was subjected to three cycles of freeze-thaw (10 min dry ice/ethanol bath, followed by 5 min
at 65◦C), then treated with proteinase K (50µg/mL final concentration) at 45◦C for 2
h, and finally with RNAse A (20 µg/mL final concentration) at 37◦C for 15 min. The
DNA was purified by extractions with phenol/chloroform/isoamyl alcohol (25:24:1 v/v) and chloroform/isoamyl alcohol (49:1), and by precipitation with 0.25 volume of 10 M
ammonium acetate and 2 volumes of ethanol 95% (Sambrook & Russell, 2001). DNA
concentration was determined by the quantiFluor dsDNA system (Promega, Madison, USA). Quantitative PCR (qPCR) was performed with SYBR green in 20-µL volume with the Fast Start essential DNA Green Master (Roche Diagnostics, Laval, QC, Canada)
containing 200µM of primers (Table 1) and 50 ng biofilm DNA. The amplifications were
performed at 95◦C for 10 min, followed by 40 cycles at 95◦C for 20 s, at the annealing
temperature (Table 1) for 20 s, and at 72◦C for 15 s. After amplifications, specificity of the
PCR products and the presence of primer dimers were verified by performing a melt curve
by increasing the temperature from 65◦C to 95◦C by increments of 1◦C per step with a
pause of 5 s for each step. Reactions were performed in a Rotor-Gene 6000 real-time rotary analyzer (Qiagen Inc. Toronto, ON, Canada). The amplification efficiencies for all primer pairs varied between 0.9 and 1.1. The copy number of each gene per ng of biofilm was calculated according to standard curves using dilutions of a gel-purified, PCR-amplified fragment of the corresponding genomic region of strain JAM1 (tagH ) or of strain GP59
Table 1 PCR primers used for qPCR assays. Gene target Sequence (50
-30
) Annealing temperature (◦
C) Fragment length (nt) Comment
narG1(strain JAM1/GP59; locus Q7A_446). Nitrate reductase subunit alpha (Nar1 system)
narG1 AGCCCACATCGTATCAAGCA 61 149 qPCR
narG1 CCACGCACCGCAGTATATTG
tagH(strain JAM1, locus tag: Q7A_1110). Teichoic acid export ATP-binding proteina
TagH Forward CCGTCATTTCGCTTCAAGAT 55 711 Standard
TagH Reverse TCATGGCTTTTTCAGCCTTT
qTagH Forward GTTGCAAGGCTATAGTCGGAGT 55 119 qPCR
qTagH Reverse TGGTACGCATTCCAGATGAATA
nirK(strain GP59, locus tag: CDW43_15165). Copper containing nitrite reductase
NirK Forward CGTTCAATACATGGGGTAAAGG 55 1,134 Standard
NirK Reverse TGGGGCACAGTGATAAACAA
qNirK Forward AAGTCGGTAAAGTAGCCGTTGA 55 138 qPCR
qNirK Reverse TCTCCATCGTCATTTGAACAAC
napA(strain NL23, locus tag W911_13875) periplasmic nitrate reductase
qnapA Forward AGGACGGGCGGATCAATTTT 61 131 qPCR
qnapA Reverse CGGATATGCATCGGACACGA
Notes.
aThe function was deduced by RAST annotations.
GenBank accession number of the genome of strain JAM1:CP003390.3, strain GP59:CP021973.1, and strain NL23:CP006912.1.
(nirK ) (Table 1), or using dilution of the NL23 genomic DNA (napA) or the JAM1 genomic
DNA (narG1) as the template.
Genome sequencing and annotations
High molecular weight total DNA was extracted from GP59 and JAM1 pure cultures with the DNeasy Blood & Tissue Extraction Kit according to the manufacturer (Qiagen, Hilden, Allemagne). DNA samples were sent to the Genome Quebec Innovation Center for genome sequencing and assembly by using the PacBio technology. Genome assembly
used was the HGAP workflow version April 2016 (Chin et al., 2013). Coverage was
over 260 times with both genomes. Genome assembly was checked manually with the DNASTAR software (version 14.1) (Madison, WI, USA) for confirming or correcting pseudogenes. Gene annotations for the JAM1 genome were updated accordingly (Genbank
accession numberCP003390.3). For the GP59 genome, gene annotations were performed
at NCBI (GenBank accession numberCP021973). Annotations were also performed for
both genomes at the Rapid Annotation using Subsystem Technology (RAST) web site
(http://rast.nmpdr.org/seedviewer.cgi) and used for further analyses (Aziz et al., 2008;
Overbeek et al., 2014).
Alignment between GP59 and JAM1 genomes was performed at RAST and with the
Mauve Multiple Genome Alignment version 20150226 (progressive alignment) (Darling
et al., 2004). The resulting alignments were corrected manually to precisely determine the common and unique genes, but also the intergenic sequences. Riboswitches and non coding RNA (ncRNA) sequences were determined by the NCBI annotation system. The average
with window size 1,000 bp, step size 200 bp, minimum identity 70%, minimum length 700
bp, minimum alignment 50 (Goris et al., 2007;Rodriguez & Konstantinidis, 2016). Genomes
were analysed for tandem repeats athttps://tandem.bu.edu/trf/trf.html(Benson, 1999).
NirK Phylogenetic analysis
The deduced amino acid sequence of the GP59 nirK was compared with public protein databases by BLASTP at the NCBI web site to retrieve the closest NirK sequences. These
sequences were than aligned with Cobalt (Papadopoulos & Agarwala, 2007). Evolutionary
analysis was conducted using MEGA6.06 (Tamura et al., 2013) with the Maximum
Likelihood method based on the Le_Gascuel_2008 model (Le & Gascuel, 2008). Initial
tree(s) for the heuristic search were obtained automatically by applying Neighbor-Join and BioNJ algorithms to a matrix of pairwise distances estimated using a JTT model, and then selecting the topology with superior log likelihood value. A discrete Gamma distribution was used to model evolutionary rate differences among sites (five categories [+G, parameter = 0.8954]). The analysis involved 21 amino acid sequences. There were a total of 378 positions in the final dataset.
The transcriptomes of M. nitratireducenticrescens GP59 and JAM1 Anoxic cultures of strains GP59 and JAM1 were performed in triplicate in the Methylophaga
medium 1403 supplemented with 21.4 mM NaNO3. Cells were harvested when NO−3 was
almost reduced in all cultures. Total RNA extraction, RNA processing, cDNA sequencing
and transcriptome analyses were described by Mauffrey, Martineau & Villemur (2015),
with the exception that we used Transcripts Per Million (TPM) for normalization instead of Reads Per Kilobase Million. One replicate culture of strain GP59 generated inconsistent results and was not considered in the transcriptome analyses. Intergenic regions were also considered in the transcriptome analyses to detect possible missed annotated genes or non-coding expressed sequences. An intergenic region includes the sequence from the stop codon of a gene to the start/stop codon of the adjacent gene. This sequence was then trimmed of 50 nucleotides at both ends to exclude as much as possible the transcript reads that would belong to the adjacent genes. Significance for difference in gene expression of the corresponding genes/sequences (defined as TPM) between strain JAM1 (triplicate cultures) and strain GP59 (duplicate cultures) was performed with the R Bioconductor
NOIseq package v2.14.0 (NOIseqBio with replicates and q = 0.9) (Tarazona et al., 2011)
and run with the R software v3.2.3 (R Core Team, 2015). Genes/sequences of one strain
that had >2-fold higher level of TPM than the other strain showed significant differences. RNA-seq reads were deposited in the Sequence Read Archive (SRA) under the numbers
SRP066381(strain JAM1) andSRP132510(strain GP59) at NCBI.
RESULTS AND DISCUSSION
Biofilm acclimation to batch cultures
The biofilm of the denitrification system (operated under continuous mode) was dispersed in vials containing 20 Bioflow carriers, the same used in the denitrification system, and
0 5 10 15 0 5 10 15 20 25 NO3 -NO2 -NOx Time (h) N O3 - , N O2 - (m M ) Figure 1 NO− 3 and NO −
2 reduction by the acclimated biofilm. The biofilm was batch-cultured under
anoxic conditions. After the 5th transfer, the NO−3 and NO−2 concentrations were measured over different time intervals. NOx: combined measurements of NO
− 3 and NO
−
2. Each point is the average with standard
deviation of triplicate cultures.
Full-size DOI: 10.7717/peerj.4679/fig-1
growing biofilm were then transferred each week in fresh medium and cultured under the
same conditions (see ‘Material & Methods’Fig. S1). At the end of the 5th transfer culture
when the NO−3 and NO−2 consumption rates stabilized, the buildup of biofilm was enough
(Fig. S2) to extract total DNA and to perform culture assays on agar plates.
NO−3 and NO−2 concentrations were measured at regular interval times during the 5th
transfer culture. Complete reduction of NO−3 and NO−2 (NOx) was achieved within 15 h,
at 1.8 mM NOxh−1(Fig. 1). This is 5-times faster than what was measured by Laurin et al.
(24) with 60 Bioflow carriers taken directly from the denitrification reactor that operated
under continuous-mode conditions (0.37 mM NOxh−1or 5.2 NOx-N L−1h−1). This result
suggests that changes occurred in the microbial population of the batch biofilm cultures. qPCR assays were performed to determine the concentrations of M. nitratireducenticrescens JAM1 (narG1-targeted primers) and H. nitrativorans NL23 (napA-targeted primers) in the original and acclimated biofilm. In the original biofilm, strain JAM1 was at 2.5 ±
0.6 ×10⁴narG1-copies/ng biofilm DNA and H. nitrativorans NL23 at 6.2 ± 0.4 ×10⁵
napA-copies/ng biofilm DNA. In the acclimated biofilm, the concentration of strain JAM1
increased by one order of magnitude (3.8 ± 0.9 ×10⁵narG1-copies/ng biofilm DNA), but
decreased substantially for strain NL23 (2.0 ± 0.5 × 10²napA-copies/ng biofilm DNA).
With the decrease of strain NL23 and the increase of strain JAM1 in the acclimated biofilm with a gain of denitrification performance, we hypothesized that a subpopulation of M.
nitratireducenticrescensthat can perform the complete denitrification pathway was enriched
Strain GP59 displaced H. nitrativorans NL23 and M. nitratireducenticrescens JAM1
The acclimated biofilm from the 5th transfer cultures was dispersed and cultured onto
a Methylophaga specific medium, and several isolates were screened for NO−3 and NO−2
consumption (Fig. S1). One isolate, which we named strain GP59, was capable to consume
NO−3 and NO−2, and cultures showed gas production, suggesting full denitrifying activities
by this strain. The 16S rRNA gene sequence of strain GP59 has 100% identity to that of M. nitratireducenticrescensJAM1.
The concentration of strain GP59 was measured in the acclimated biofilm by qPCR to determine whether this strain is a major denitrifier. To distinguish strain GP59 from strain JAM1, primers targeted strain-specific sequences (tagH for strain JAM1 and nirK for strain
GP59) were developed based on their respective genome (Table 1; see below). The GP59 cell
concentrations went from undetected (below limit of PCR detection) in the original biofilm
to high level in the acclimated biofilm at 2.2 ± 0.35 ×10⁵nirK-copies/ng biofilm DNA. This
is 2–3 orders of magnitude higher than that of strain JAM1 (4.0 ± 1.7 ×10²tagH-copies/ng
biofilm DNA). These results confirm our hypothesis that a new M. nitratireducenticrescens strain with full denitrification capacity occurred in the acclimated biofilm, and displaced
H. nitrativorans NL23, but also M. nitratireducenticrescens JAM1. Comparative analyses
were then performed between strain GP59 and M. nitratireducenticrescens JAM1 at the physiological, genomic and transcriptomic levels.
Physiological characterization of strain GP59
Strain GP59 cultured under anoxic conditions (planktonic pure cultures) showed a 24-h
lag before growth occurred (Fig. 2A). The growth yields reached about 1.2 OD600nmwith
42.8 mM NO−3 exposure and did not increase significantly in cultures exposed with higher
NO−3 concentrations. Strain JAM1 cultured under the same conditions showed no lag
phase, and growth yields were 3- to 6-fold lower than those of the GP59 cultures (Fig. 2A).
The maximum specific growth rate (µmax) and the half-saturation constants of NO−
3 for
growth (Ks) were calculated (Table 2). Theµmax for strain GP59 is higher (3.3 times)
than that of strain JAM1. To assess the affinity of strain GP59 toward NO−3 for growth, the
µmax/Ks ratio was calculated (Healey, 1980) (Table 2). This ratio (1.2µM−1NO−3 h−1)
is not different than the one calculated for strain JAM1 at 1.3µM−1NO−3 h−1(Mauffrey,
Martineau & Villemur, 2015). These results concur with the genome sequences (see below) with near 100% identity between the two strains in gene clusters encoding the two Nar
systems and the NO−3 transporters (NarK).
As observed with growth, a 24-h lag period was observed in the GP59 cultures before
NO−3 started to be consumed, whereas complete NO−3 consumption occurred in the JAM1
cultures within 24 h (Fig. 2B). The NO−3 reduction rates increased linearly with the increase
of NO−3 concentrations in the GP59 cultures (Fig. 3A). The specific NO−3 reduction rates
(rates normalized by the biomass) averaged around 1.5 to 2 mM NO−3 h−1 OD−1 and
showed no significant changes at any NO−3 concentrations tested (Fig. 3B). In the JAM1
cultures, the NO−3 reduction rates reached a plateau at 24 mM NO−3 (Fig. 3A), and, as
0 50 100 150 0.0 0.2 0.4 0.5 1.0 a Time (h) OD 60 0 nm 0 20 40 0 10 20 0.0 0.5 1.0 1.5 2.0
b
Time (h)N
O
3 -, N
O
2 -(m
M
)
2N
O
(µ
m
ol
vi
al
-1)
NO3- (GP59) NO2- (GP59) N2O (GP59) NO3- (JAM1) NO2- (JAM1) N2O (JAM1) 42.8 mM (GP59) 9.6 mM (GP59) 9.6 mM (JAM1) 42.8 mM (JAM1)Figure 2 Growth, and NO−
3, NO
−
2 and N2O dynamics by Methylophaga nitratireducenticrescens GP59 and JAM1. (A) Growth. Strain GP59 and strain JAM1 were cultured under anoxic conditions with 9.6 or
42.8 mM NO− 3. (B) NO
− 3, NO
−
2 and N2O dynamics. Strain GP59 and strain JAM1 were cultured under
anoxic conditions with 21.4 mM NO−3, and NO − 3, NO
−
2 and N2O were measured over different time
inter-vals. Each point is the average with standard deviation of triplicate cultures for (A), and of duplicate cul-tures for (B).
Full-size DOI: 10.7717/peerj.4679/fig-2
reduction rates (averaged around 4 to 6 mM NO−3 h−1 OD−1) (Fig. 3B). Interestingly,
these specific rates are 2.4 to 5.4-fold higher than those of strain GP59, suggesting that the
JAM1 cells have a higher dynamism of NO−3 processing (e.g., NO−3 intake and reduction)
than the GP59 cells. Close examination of the respective genomes and transcriptomes (see below) did not reveal specific gene(s) that would explain these differences.
N2O was detected in the GP59 anoxic cultures and reached maximum accumulation
(ca. 0.5µmol N2O vial−1or 0.04% N-input) when NO
−
2 peaked in the medium, and then
Table 2 Kinetics of growth under anoxic conditions.
Strain GP59 Strain JAM1a
µmax (h−1) 0.0380 (0.0027) 0.0116 (0.0008)
Ks (mM) 30.7 (5.8) 9.2 (1.9)
µmax/Ks (µM−1h−1) 1.2 (0.2) 1.3 (0.3)
Notes.
µmax, maximum growth rates. Ks, half-saturation constants of NO−
3for growth. Values between parentheses are standard deviation of triplicates.
aFromMauffrey, Martineau & Villemur (2015).
0 1 2 3 GP59 JAM1
a
N O3 - red uc tio n ra te (m M h -1 ) 0 50 100 150 0 2 4 6b
Nitrate (mM) Sp ec ifi c NO 3 - red uc tio n ra te ( m M h -1 O D -1 ) Figure 3 Specific NO−3 reduction rates. (A) NO
−
3 reduction rates of strains GP59 and JAM1. Each point
is the average with standard deviation of triplicate anoxic cultures. (B) Specific NO−3 reduction rates.
These rates were calculated with the NO−3 reduction rates by the generated culture biomass (OD600nm) at
the end of the exponential phase.
Full-size DOI: 10.7717/peerj.4679/fig-3
complete denitrification pathway in strain GP59 as revealed by its genome sequence (see below).
Strain GP59 was cultured under oxic conditions with different concentrations of NO−3
(9.6 to 142.8 mM). Contrary to the JAM1 cultures that can reduce NO−3 to NO−2 under oxic
conditions (Mauffrey, Martineau & Villemur, 2015), no NO−3 consumption was observed
24-h lag period before nitrate reduction occurs in the GP59 anoxic cultures, suggest that strains GP59 and JAM1 regulate differently the expression of their denitrification genes.
Both strains cannot grow on methylamine and fructose. They showed similar growth profile related to NaCl concentrations (optimal growth at 1 to 5% NaCl; weaker growth at 8%; no growth at 0 and 10%), pH (optimal growth at pH 8; weaker growth at pH 7, 9
and 10; no growth at pH 6 and 11) and temperature (optimal growth at 30◦C; variability
in culture replicates at 22 and 34◦C; weak growth at 37◦C). Sensibility to antibiotics by
strain GP59 was also similar to those reported byVilleneuve et al. (2013)for strain JAM1
(chloramphenicol, trimethoprim, ampicillin, tetracycline, streptomycin, gentamycin and kanamycin).
The genome of strain GP59 contains nirK
The genome of strain GP59 was sequenced by the PacBio technology. Although strain JAM1 was already sequenced by the pyrosequencing technology, it was resequenced by
the PacBio technology to correct some discrepancies in the genome assembly (Data S1).
Analysis of the GP59 genome revealed the presence of two prophages (named GPMu1 and GPMu2) integrated side by side in the same orientation and separated by 11,102 nt
(Data S2). The intercalated sequence has a GC content of 40.1%, which is lower than in the
overall genome (44.8%). Gene arrangement of the prophages resembles to that of the E.
coliphage Mu and of the Haemophilus influenzae FluMu prophage (Morgan et al., 2002).
Gene clusters encoding Mu-type prophage proteins are also present in the genome of two
Methylophagaspecies such as M. frappieri JAM7 that was also isolated from the original
biofilm of the denitrification system (Auclair et al., 2010) (Data S2). No prophage was
found in the JAM1 genome.
The 11,102 nt intercalated sequence contains a gene encoding a NirK-type NO−2 reductase
of 363 amino acid residues (Data S2). Upstream of this nirK, is a gene encoding the NO
reductase activation protein NorD. The precise function of NorD is yet to be known, but the
norDmutant in Paracoccus denitrificans showed no activity of the cd1-type NO−2 reductase
(NirS) and of the NO reductase (DeBoer et al., 1996). Available genomic sequences from
other Methylophaga species and from metagenomic studies were screened for the presence of genes encoding NirK highly similar to the GP59 NirK. The closest affiliations of the GP59 NirK are with NirK encoded in three reconstituted Methylophaga sp. genomes from a
metagenomic study of marine subsurface aquifer samples (NCBI BioprojectPRJNA391950
by Tully, Wheat, Glazer and Huber, University of Southern California) (Fig. 4). These
three NirK have 84–85% similarity with the GP59 NirK sequence. In addition, norD is also present adjacent to nirK in these three Methylophaga sp. genomes.
The previous results suggest that there are Methylophaga strains in natural environments that carry denitrification modules. We further performed data mining to retrieve denitrification genes in available genomes of Methylophaga species or in reconstituted
Methylophaga genomes from metagenomic studies. Data provided by the Bioproject
PRJNA391950revealed that the metagenome of the Methylophaga sp. isolate NORP53
(accession number NVVW00000000) contains two gene clusters with one (contig
Nitrosomonas cryotolerans SFP39808.1 Nitrosomonas mobilis SCZ86535.1
Nitrosococcus oceani ATCC 19707 ABA56624.1 Cycloclasticus sp. NORP92 PHS70052.1
Bathymodiolus azoricus thioautotrophic gill symbiont WP_090717277.1
Methylophaga nitratireducenticrescens GP59, AUZ86105 Gammaproteobacterium NORP60 PCJ30753.1 Methylophaga sp. NORP93 PHS69590.1
Methylophaga sp. NORP33 PHR81400.1 Methylophaga sp. NORP65 PHS29800.1
Sunxiuqinia dokdonensis KOH43527.1 Nitrosovibrio tenuis SEL66906.1
Nitrosospira multiformis SDQ31436.1 Nitrosomonas marina SES75436.1
Shewanella denitrificans OS217 ABE56757.1 Marinobacter psychrophilus AKO51897.1 Oleispira antarctica RB-8 CCK74932.1
Pseudomonas nitroreducens OWP48825.1 Pseudomonas mosselii SJ10 AIN60781.1
Rubellimicrobium mesophilum DSM 19309 EYD77238.1 Roseovarius pacificus SHM21003.1 100 89 94 99 96 74 98 100 96 100 78 92 80 96 91 70 0.1
*
*
Figure 4 Phylogenetic analysis of NirK of Methylophaga nitratireducenticrescens GP59. An unrooted
phylogenetic tree demonstrating the evolutionary relationship of nirK deduced amino acid sequences is illustrated. The evolutionary history was inferred by using the Maximum Likelihood and the tree with the highest log likelihood (−7,598.4857) is shown. The percentage (values above 70%) of trees in which the associated taxa clustered together is shown next to the branches (bootstrap analysis with 1,000 repli-cates). The tree is drawn to scale, with branch lengths measured in the number of substitutions per site. The GenBank accession number is provided after each bacterial name. *: The Cycloclasticus sp. NORP92, Gammaproteobacterium NORP60, and the Methylophaga sp. NORP93, NORP33 and NORP65 are from the NCBI bioprojectPRJNA391950by Tully, Wheat, Glazer and Huber, University of Southern California.
Full-size DOI: 10.7717/peerj.4679/fig-4
JAM1 and GP59 genomes (narXL, NarK1K2GHJI ), and another one (NVVW01000010)
encoding a N2O reductase (nosRZDFYL). At the amino acid sequence level, these gene
clusters of isolate NORP53 are 67 to 90% similar with the corresponding gene products in the JAM1 and GP59 genomes. Finally, nirK sequences were found in the genome of
M. frappieriJAM7 and of 34 Methylophaga sp. retrieved from metagenomic studies (Data
S3). Although M. frappieri JAM7 does not grow under anoxic conditions with NO−3,
which concurs with the absence gene cluster encoding a dissimilatory NO−3 reductase, the
occurrence of nirK may be associated with the detoxification mechanism. All these results suggest that the different denitrification modules are carried by some Methylophaga species present in natural environments.
Strain GP59 belongs to the species Methylophaga nitratireducenticrescens
Table 3summaries the overall features of the GP59 and JAM1 genomes. Both genomes share
Table 3 Genomic features of M. nitratireducenticrescens strains JAM1 and GP59. JAM1 GP59 Genome Length (nt) 3,137,100 3,238,484 GC content (%) 44.75 44.86 CDSa 3,027 3,187b Common CDS 2,790 2,790 tRNA 44 44 rRNA (5S-16S-23S) 9 9 ncRNA 4 4
(TmRNA, SRP-RNA, RNase P, 6S RNA)
Riboswitch 11 11
Small Tandem Repeatsc
TCAGYCA 16 (785,393) 12 (710,616)
CTTCGG 55 (2,294,123) 19 (2,287,110)
GGYTCT 39 (2,660,735) 37 (2,669,276)
Large tandem repeatd
3095-nt repeats 1 (1,940,231; 93%d) 4 (1,904,086; 100%d) Plasmids None pGP32 pGP34 Length (nt) 32,421 33,560 GC content (%) 44.29 44.13 CDS 51 52 Notes.
aBased on RAST annotations.
bThe possible CDS in the ambiguous region of GPMu1 were not taking into account. Common CDS: seeData S4. cNumber of copies. Genome location under parenthesis. Only repeats with more than 10 copies are presented. dNumber of copies. Genome location under parenthesis. % identity between the 3095-nt long repeats (see text).
region containing the denitrification gene clusters nar1, nar2, nor1, nor2 and nos (Mauffrey,
Martineau & Villemur, 2015) is 99.94% identical (43 substitutions, no gap) between the two strains. Based on the genome annotations, functions associated with CDS that are unique to strain JAM1 have in most cases an equivalent in strain GP59. In addition to CDS associated with the two prophages and the intercalated sequence, the GP59 genome has CDS associated
with an integrated plasmid (position 724937 to 765476;Data S4). The GC skew between
the two genomes is relatively similar (Fig. S3). Two-way ANI analysis showed 99.30%
identity, and >80% conserved sequences between the two genomes, indicating that both
strains belong to the same species (Goris et al., 2007;Rodriguez & Konstantinidis, 2016).
Both genomes have small tandem repeats with >10 repeats positioned at equivalent locations. These tandem repeats vary in number of repeats between the two strains
(Table 3), and are located in CDS with no putative known function. A long tandem
repeat (four 3095-nt repeats) was found in the GP59 genome (Table 3). Genes encoding
an aspartate aminotransferase and a TonB-dependent siderophore receptor are among the three genes repeated 4 times. The equivalent region in the JAM1 genome shows no repetition, with 93% identity with the 3095-nt repeat sequence with most of the divergence in the TonB-dependent siderophore receptor gene.
Strain GP59 contains two plasmids here named pGP32 and pGP34 (Table 3). This result concurs with the observation of extra-chromosomic DNA when plasmid DNA
extraction was performed on GP59 biomass (Data S5). These plasmids encode type IV
secretion system as observed in many plasmids hosted by Gram negative bacteria (Data
S5) (Christie, 2001). They also carry genes encoding for recombinases, nucleases, DNA methyltransferases, toxin/antitoxin, and carbon storage regulator. These two plasmids show no homology with the integrated plasmid in the GP59 genome. M. frappieri JAM7 also carries a 48.5 kb plasmid, which resembles in its structure to the IncPalpha plasmids
(Data S5). It shares no homology with the pGP32 and pGP34 plasmids.
M. nitratireducenticrescens GP59 did not evolve from M. nitratireducenticrescens JAM1
Did strain GP59 evolve during the acclimation process of the biofilm from strain JAM1 that underwent series of chromosomic rearrangements and phage infections, or was strain GP59 present in the original biofilm and enriched during the acclimation? To try to answer this question, we analyzed the Clustered Regularly Interspaced Short Palindromic Repeats (CRISPR) region that has been identified in the GP59 and JAM1 genomes. The CRISPR system is an adaptive immunity system that is present in most archaea and many bacteria and that acts against invading genetic elements, such as bacteriophages and plasmids. The chromosomic arrangement of CRISPR system includes CRISPR associated genes (cas), a leader sequence upstream of an array of short repeats interspersed with unique spacers that are almost identical to fragments of bacteriophage and plasmid genes. The transcription of the spacer array provides complementary DNA targeting, for instance, phage genome
resulting in target DNA degradation (Barrangou & Marraffini, 2014;Garneau et al., 2010;
Makarova et al., 2011). Addition of new spacers in response, for instance, of bacteriophage infection occurs proximal to the leader sequence. Accordingly, CRISPR spacers provide a historical perspective of phage exposure, with spacers at the vicinity of the leader were relatively recently added, and those distal spacers likely originated from previous events (Horvath et al., 2008).
The CRISPR region in GP59 and JAM1 genomes comprises 5 associated CRISPR genes
(Fig. 5A). Except for the spacer sequences, the nucleotide sequence of the CRISPR genes and
the repeat sequences are identical in both genomes (Figs. 5A,5C). There are 105 and 115
spacers in the JAM1 and GP59 CRISPR regions, respectively (Fig. 5B). In the JAM1 CRISPR
region, 14 spacer sequences were found twice. The GP59 and JAM1 CRISPR regions share
29 spacer sequences (Fig. 5B); all of them are distal to the leader sequence (the most ancient
acquired sequences,Horvath et al., 2008). No spacer sequence was found twice in the GP59
CRISPR region. As both CRISPR regions do not share sequence between their proximal spacers, strains GP59 and JAM1 underwent a different history of phage infections from a common ancestry. This strongly suggests that strain GP59 did not originate from strain JAM1 that underwent series of chromosomic rearrangements and phage infections in a short period of time and in a closed environment, but rather was present in the original biofilm and was enriched during the acclimation phase of the biofilm.
Proximal distal M. aminisulfidivorans
M. sulfidovorans (Subtype I-E)
M. lonarensis
csy3
cas3 cse1 cse2 cas7 cas5 cas6 HP cas1 cas2 54 (29/32) 6 (29/32) 63 (29/32)
cas2cas3 csy4
cas1 HP HP
cas2-cas3 csy4
cas1 csy1 csy2
M. nitratireducenticrescens
JAM1/GP59 M. frappieri JAM7 (Subtype I-F)
JAM1: 105 (28/32) GP59: 115 (28/32)
68 (28/32)
M. nitratireducenticrescens JAM1/GP59 GTTCACTGCCGAACAGGCAGCTTAGAAA ||||||||||| ||||||||||||||||
M. frappieri JAM7 GTTCACTGCCGCACAGGCAGCTTAGAAA
|| | | | | | |||
M. sulfidovorans DSM 11578 GTGTTCCCCGTGCCCACGGGGAT GAACC ||||||||||||||||||||||| |||||
M. aminisulfidivorans MP GTGTTCCCCGTGCCCACGGGGAT GAACCG
||||||||| | || |||||| ||||||
M. lonarensis MPL GTGTTCCCCACGACCGTGGGGAT GAACCG
a. Gene arrangement c. Repeat sequence b. Spacer/repeat arrangement Strain GP59 Strain JAM1 ( )26 ( )39 c d e f g h i j k l m n o p q r s t u v w x y zaa 1 2 3 4 5 6 7 8 9101112 c d e f g h i j k l m n o p q r s t u v w x y zaa 1 2 3 4 5 6 7 8 910 1112 bbcc bbcc ( )46 a b 13 14 a b 13 14 a b leader leader Leader repeats
Figure 5 CRISPR chromosomic arrangement in Methylophaga genomes. (A) Gene arrangement.
Sequences were retrieved from GenBank. Accession numbers: M. nitratireducenticrescens JAM1:CP003390
(Q7A_2613 to Q7a_2609) and GP59:CP021973(CDW43_11545 to CDW43_11525); M. frappieri JAM7
CP003380(Q7C_1045 to Q7C_1040); M. aminisulfidivorans MP:NZ_AFIG01000001(MAMP_RS08465 to MAMP_RS08425), M. sulfidovorans DSM 11578: FOSH01000003 (SAMN04488079_1032 to
SAMN04488079_10310); M. lonarensis MPL, APHR01000054 (MPL1_10022 to MPL1_10062). Nomenclature is based onBarrangou & Marraffini (2014). HP, Hypothetical protein. Numbers at the right are the number of repeat units with the repeat/spacer nucleotide length in parentheses. (B) Spacer/repeat unit arrangement. Blue: the 29 common units. Green: the 14 units repeated twice in strain JAM1. (C) CRISPR repeat sequences in different Methylophaga species.
Full-size DOI: 10.7717/peerj.4679/fig-5
The GP59 and JAM1 CRISPR regions were also compared to other available
Methylophagagenomes. M. frappieri JAM7 contains 68 repeat units. The repeat sequence
has one-nt substitution with the GP59/JAM1 one (Fig. 5C). None of its spacer sequences
were found in the GP59 and JAM1 CRISPR regions. In the M. aminisulfidivorans MP, M.
sulfidovoransDSM 11578, M. lonarensis MPL genomes, 59, 6 and 63 spacer sequences were
found, respectively; none were repeated twice or were found in other Methylophaga species. The CRISPR genes and gene arrangement in M. frappieri JAM7 are typical of the subtype I-F CRISPR-Cas system, whereas those of M. aminisulfidivorans MP, M. sulfidovorans DSM
11578, M. lonarensis MPL are related to the subtype I-E one (Fig. 5A) (Makarova et al.,
2011). In strains GP59 and JAM1, the CRISPR genes and gene arrangement cannot be
associated to a defined subtype. However, the gene arrangement and the deduced amino acid sequences of cas3 and of the two downstream CDS are highly similar to CRISPR genes found in several bacterial genomes such as Legionella brunensis (GenBank accession number
LNXV01000004) and Moraxella atlantae (GenBank accession numberLZMZ01000013).
Transcriptome analyses
The GP59 and JAM1 genomes share more than 85% of their genes. However, gene variations, the presence of strain-specific genes, and the occurrence of plasmids in strain
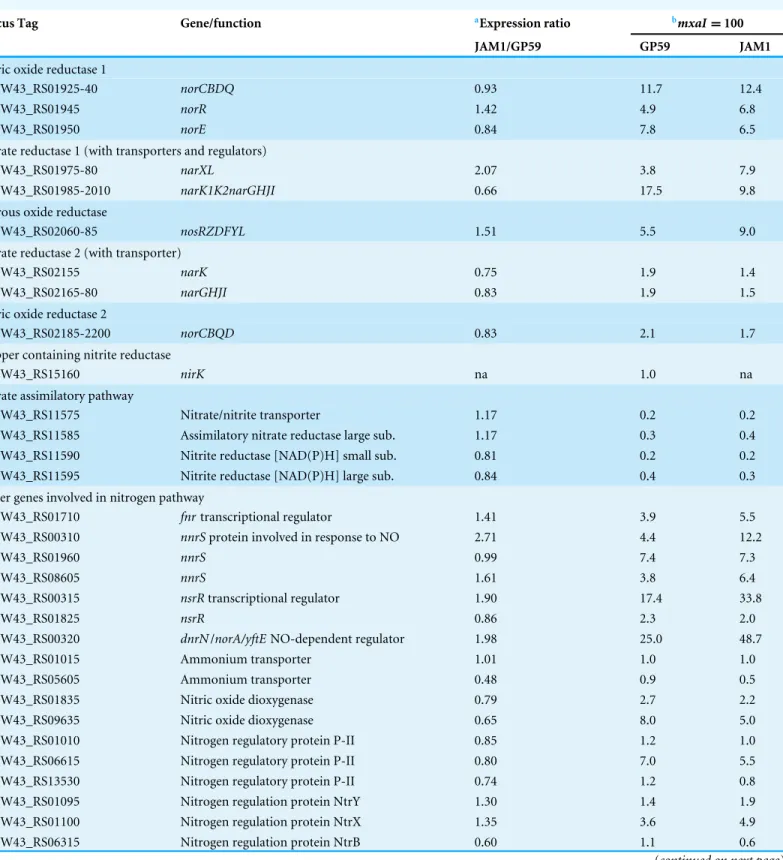
Table 4 Transcript levels of genes involved in the nitrogen pathway in Methylophaga nitratireducenticrescens JAM1 and GP59.
Locus Tag Gene/function aExpression ratio bmxaI =100
JAM1/GP59 GP59 JAM1
Nitric oxide reductase 1
CDW43_RS01925-40 norCBDQ 0.93 11.7 12.4
CDW43_RS01945 norR 1.42 4.9 6.8
CDW43_RS01950 norE 0.84 7.8 6.5
Nitrate reductase 1 (with transporters and regulators)
CDW43_RS01975-80 narXL 2.07 3.8 7.9
CDW43_RS01985-2010 narK1K2narGHJI 0.66 17.5 9.8
Nitrous oxide reductase
CDW43_RS02060-85 nosRZDFYL 1.51 5.5 9.0
Nitrate reductase 2 (with transporter)
CDW43_RS02155 narK 0.75 1.9 1.4
CDW43_RS02165-80 narGHJI 0.83 1.9 1.5
Nitric oxide reductase 2
CDW43_RS02185-2200 norCBQD 0.83 2.1 1.7
Copper containing nitrite reductase
CDW43_RS15160 nirK na 1.0 na
Nitrate assimilatory pathway
CDW43_RS11575 Nitrate/nitrite transporter 1.17 0.2 0.2
CDW43_RS11585 Assimilatory nitrate reductase large sub. 1.17 0.3 0.4
CDW43_RS11590 Nitrite reductase [NAD(P)H] small sub. 0.81 0.2 0.2
CDW43_RS11595 Nitrite reductase [NAD(P)H] large sub. 0.84 0.4 0.3
Other genes involved in nitrogen pathway
CDW43_RS01710 fnrtranscriptional regulator 1.41 3.9 5.5
CDW43_RS00310 nnrSprotein involved in response to NO 2.71 4.4 12.2
CDW43_RS01960 nnrS 0.99 7.4 7.3
CDW43_RS08605 nnrS 1.61 3.8 6.4
CDW43_RS00315 nsrRtranscriptional regulator 1.90 17.4 33.8
CDW43_RS01825 nsrR 0.86 2.3 2.0
CDW43_RS00320 dnrN/norA/yftE NO-dependent regulator 1.98 25.0 48.7
CDW43_RS01015 Ammonium transporter 1.01 1.0 1.0
CDW43_RS05605 Ammonium transporter 0.48 0.9 0.5
CDW43_RS01835 Nitric oxide dioxygenase 0.79 2.7 2.2
CDW43_RS09635 Nitric oxide dioxygenase 0.65 8.0 5.0
CDW43_RS01010 Nitrogen regulatory protein P-II 0.85 1.2 1.0
CDW43_RS06615 Nitrogen regulatory protein P-II 0.80 7.0 5.5
CDW43_RS13530 Nitrogen regulatory protein P-II 0.74 1.2 0.8
CDW43_RS01095 Nitrogen regulation protein NtrY 1.30 1.4 1.9
CDW43_RS01100 Nitrogen regulation protein NtrX 1.35 3.6 4.9
CDW43_RS06315 Nitrogen regulation protein NtrB 0.60 1.1 0.6
Table 4(continued)
Locus Tag Gene/function aExpression ratio bmxaI =100
JAM1/GP59 GP59 JAM1
CDW43_RS06320 Nitrogen regulation protein NR(I) 1.12 0.7 0.8
CDW43_RS15625 PTS IIA-like nitrogen-regulator PtsN 0.95 12.1 11.1
Notes.
aRatio of JAM1 transcripts per million (TPM) by GP59 TPM.
bTranscript levels relative to the expression of the methanol dehydrogenase small unit (mxaI ) set to 100 (seeData S6). For polycistronique operons, the values are the average val-ues of individual genes.
na, not applicable.
Locus tag refers to the genome sequence of strain GP59 (GenBank accession numberCP021973). Gene/function is based on RAST annotations, seeData S4.
GP59 could affect the expression pattern of these common genes. To assess whether these genes were expressed differently between strains GP59 and JAM1, the transcriptome of both
strains was derived from anoxic cultures at the end of the exponential growth when NO−3
was nearly completely reduced in both cultures. Among the 2857 common genes (CDS and ncRNA), more than 85% of those in strain GP59 showed no significant difference in the
transcription levels (<2-fold difference in TPM) (Data S4) with their counterparts in strain
JAM1. The vast majority of genes involved in the nitrogen pathways were expressed in
equivalent levels in both strains (Table 4). The fact that the cultures were sampled for RNA
extraction when both strains were at an equivalent physiological phase (anoxic conditions
with NO−3 almost consumed) could explain this high proportion of similar gene expression
between the two strains. Among genes with significant differences are those encoding the synthesis of the osmoprotectant ectoine, which were 3- to 6-fold higher in the JAM1
cultures than in the GP59 cultures (Fig. S4). This suggests that strain JAM1 could be more
resilient to changes in salinity.
The most expressed genes were sorted out from both transcriptomes to assess which specific metabolic pathways are the most solicited under denitrifying conditions. High levels of gene expression were found in both strains for genes involved in growth, energy and respiration (e.g., ribosomal proteins, ATP synthase, pseudoazurin), and the C-1 metabolic carbon such as methanol dehydrogenase, ribulose monophosphate enzymes (D-arabino-3-hexulose 6-phosphate formaldehyde-lyase, 6-phospho-3-hexuloisomerase),
formaldehyde activating enzymes (Data S6,Fig. S4). One of the highest expressed genes
in both genomes is located in the chromosomic region comprising three adjacent genes encoding similar proteins (>88% similarity). Each of these genes has a cyclic di-GMP riboswitch in their respective upstream sequence. The first of the three genes showed high
level of TPM in the riboswitch and in the coding sequence (Table 5). The other two genes
and their respective riboswitch showed much lower expression levels. The deduced amino acid sequence of these three similar proteins contains a carbohydrate-binding module 6
that is found in carbohydrate-active enzymes such as glycoside hydrolases (Henshaw et
al., 2004), and three transmembrane domains. Upstream and downstream of these three genes are genes encoding proteins involved in polysaccharide export and in the capsular polysaccharide biosynthesis. These proteins may participate in this synthesis. Finally, the pGP32 plasmid accounted for 23.1% of total TPM in the GP59 transcriptomes, whereas it
Table 5 Relative expression of selected genes under anoxic culture conditions.
Locus tag Function Strand Relative expression GP59 JAM1
CDW43_06820 Mannose-1-phosphate guanylyltransferase + 2.3 3.5
CDW43_06825 Capsular polysaccharide synthesis enzyme CpsA, sugar transferase, undecaprenyl-phosphate glucose phosphotransferase
+ 3.3 5.2
DW43_06835 Cyclic di-GMP riboswitch class I
Hypothetical protein, carbohydrate-binding module 6
+ 2,011
936
1,561 777 CDW43_06840 Cyclic di-GMP riboswitch class I
Hypothetical protein, carbohydrate-binding module 6
+ 9.1
7.3
13 7.6 CDW43_06845 Cyclic di-GMP riboswitch class I
Hypothetical protein, carbohydrate-binding module 6
+ 6.5
30
2.9 7.1 CDW43_06850 Periplasmic protein involved in polysaccharide export + 6.8 4.6
CDW43_06855 Hypothetical protein + 4.7 3.6
CDW43_06860 Exopolysaccharide transport protein, putative + 2.6 2.0
Notes.
Gene expression is relative to mxaI set to 100 (2602 TPM for strain GP59 and 4060 TPM for strain JAM1). Locus tag: from GenBank accession numberCP021973. Functions are based on RAST annotations.
for 20% of total TPM, among which are genes involved in restriction-modification systems
(Data S6).
CONCLUSIONS
Culturing the denitrifying biofilm under batch conditions has favored the enrichment of a new denitrifying subpopulation, representing by M. nitratireducenticrescens GP59 that displaced H. nitrativorans NL23 and M. nitratireducenticrescens JAM1. In addition of complete denitrification by strain GP59, two important differences were observed between
the two strains. Strain GP59 cannot reduce NO−3 under oxic conditions as does strain
JAM1, and a 24-h lag period was observed in GP59 anoxic cultures before growth and
NO−3 reduction occurs. These results suggest differences in regulation of the denitrification
genes between the two strains. The genome of strain GP59 showed insertions of two Mu-type prophages that probably brought a nirK gene, the missing denitrification gene in strain JAM1. Both genomes share more than 85% of their genes, and these genes were expressed at similar level under anoxic conditions at the end of the exponential growth. Finally, analysis of the CRISPR region suggests that strain GP59 did not originate from strain JAM1, but was present in the original biofilm and was enriched during the acclimation process.
These comparative analyses between strains GP59 and JAM1 unveiled that M.
nitratireducenticrescensspecies enriched in the biofilm of the bioreactor encompasses a
mosaic population structure. Although plasticity of the genomic landscape of bacterial species resulting to gene rearrangements, point mutations and lateral gene acquisition
was observed in nature (Allen et al., 2007;Bendall et al., 2016), the observation of M.
nitratireducenticrescensGP59 reported here shows functional consequences of population
variation on process rate and system performances. The reason why strain GP59 did occur in the acclimated biofilm but not in the Biodome denitrification system remains
obscure and is under investigation. This could be related to the batch-mode conditions
where the transient accumulation of NO−2 (up to 10 mM;Fig. 1) could have adverse the
growth of H. nitrativorans NL23, favoring the enrichment of M. nitratireducenticrescens
GP59. In the denitrification reactor at the Biodome, such accumulation of NO−2 was not
encountered probably due the continuous-operating mode or the lower denitrification rates that prevailed.
Our study broadens the ecology of M. nitratireducenticrescens with the occurrence of a microbial seedbank suited for anoxic conditions. So far among the genus Methylophaga, M. nitratireducenticrescensis the only reported species that can grow under anoxic conditions. Based on metagenomic studies, however, where denitrification genes were found in
Methylophaga-reconstituted genomes, this anoxic metabolism within this genus is more
widespread than previously thought. Methanol is generated by anthropogenic activities or by biogenic metabolisms such as plant growth and decomposition, and ocean ecosystems are thought to participate actively in its production. Furthermore, oceans are known to be
a sink of atmospheric methanol (Galbally & Kirstine, 2002;Millet et al., 2008). As they are
ubiquitous in marine environments, Methylophaga spp. are therefore important actors in the methanol turnover on Earth, either under oxic environments or, based on our studies with M. nitratireducenticrescens, under anoxic marine environments.
ACKNOWLEDGEMENTS
We thank Karla Vasquez for her technical assistance.
ADDITIONAL INFORMATION AND DECLARATIONS
Funding
This research was supported by a grant to Richard Villemur from the Natural Sciences and Engineering Research Council of Canada # RGPIN-2016-06061. The funders had no role in study design, data collection and analysis, decision to publish, or preparation of the manuscript.
Grant Disclosures
The following grant information was disclosed by the authors:
Natural Sciences and Engineering Research Council of Canada: #RGPIN-2016-06061. Competing Interests
The authors declare there are no competing interests. Author Contributions
• Valérie Geoffroy and Geneviève Payette conceived and designed the experiments, performed the experiments, analyzed the data, prepared figures and/or tables, authored or reviewed drafts of the paper, approved the final draft.
• Florian Mauffrey conceived and designed the experiments, performed the experiments, analyzed the data, authored or reviewed drafts of the paper.
• Livie Lestin performed the experiments, analyzed the data, approved the final draft. • Philippe Constant conceived and designed the experiments, analyzed the data,
contributed reagents/materials/analysis tools, authored or reviewed drafts of the paper. • Richard Villemur conceived and designed the experiments, performed the experiments,
analyzed the data, contributed reagents/materials/analysis tools, prepared figures and/or tables, authored or reviewed drafts of the paper, approved the final draft.
DNA Deposition
The following information was supplied regarding the deposition of DNA sequences:
The genome of strain JAM1 is accessible via GenBank accession numberCP003390.3.
The genome of strain GP59 is accessible via GenBank accession numberCP021973. The
RNA-seq reads were deposited in the Sequence Read Archive (SRA) under the numbers
SRP066381(strain JAM1) andSRP132510(strain GP59) in GenBank.
Data Availability
The following information was supplied regarding data availability:
The raw data and supplemental documents are available asSupplemental Files.
Supplemental Information
Supplemental information for this article can be found online athttp://dx.doi.org/10.7717/
peerj.4679#supplemental-information.
REFERENCES
Allen EE, Tyson GW, Whitaker RJ, Detter JC, Richardson PM, Banfield JF. 2007.
Genome dynamics in a natural archaeal population. Proceedings of the
Na-tional Academy of Sciences of the United States of America104:1883–1888
DOI 10.1073/pnas.0604851104.
Auclair J, Lépine F, Parent S, Villemur R. 2010. Dissimilatory reduction of nitrate in
seawater by a Methylophaga strain containing two highly divergent narG sequences.
ISME Journal4:1302–1313DOI 10.1038/ismej.2010.47.
Auclair J, Parent S, Villemur R. 2012. Functional diversity in the denitrifying biofilm of
the methanol-fed marine denitrification system at the Montreal Biodome. Microbial
Ecology 63:726–735DOI 10.1007/s00248-011-9960-2.
Aziz RK, Bartels D, Best AA, DeJongh M, Disz T, Edwards RA, Formsma K, Gerdes S, Glass EM, Kubal M, Meyer F, Olsen GJ, Olson R, Osterman AL, Overbeek RA, McNeil LK, Paarmann D, Paczian T, Parrello B, Pusch GD, Reich C, Stevens R, Vassieva O, Vonstein V, Wilke A, Zagnitko O. 2008. The RAST
server: rapid annotations using subsystems technology. BMC Genomics 9:75
DOI 10.1186/1471-2164-9-75.
Barrangou R, Marraffini LA. 2014. CRISPR-Cas systems: prokaryotes upgrade to
adaptive immunity. Molecular Cell 54:234–244DOI 10.1016/j.molcel.2014.03.011.
Bendall ML, Stevens SLR, Chan LK, Malfatti S, Schwientek P, Tremblay J, Schackwitz W, Martin J, Pati A, Bushnell B, Froula J, Kang DW, Tringe SG, Bertilsson S,
Moran MA, Shade A, Newton RJ, McMahon KD, Malmstrom RR. 2016.
Genome-wide selective sweeps and gene-specific sweeps in natural bacterial populations. ISME
Journal 10:1589–1601DOI 10.1038/ismej.2015.241.
Benson G. 1999. Tandem repeats finder: a program to analyze DNA sequences. Nucleic
Acids Research27:573–580DOI 10.1093/nar/27.2.573.
Boden R. 2012. Emended description of the genus Methylophaga Janvier, others, 1985.
International Journal of Systematic and Evolutionary Microbiology62:1644–1646
DOI 10.1099/ijs.0.033639-0.
Chin CS, Alexander DH, Marks P, Klammer AA, Drake J, Heiner C, Clum A, Copeland A, Huddleston J, Eichler EE, Turner SW, Korlach J. 2013. Nonhybrid, finished
microbial genome assemblies from long-read SMRT sequencing data. Nature
Methods10:563–569 DOI 10.1038/nmeth.2474.
Christie PJ. 2001. Type IV secretion: intercellular transfer of macromolecules by systems
ancestrally related to conjugation machines. Molecular Microbiology 40:294–305
DOI 10.1046/j.1365-2958.2001.02302.x.
Darling ACE, Mau B, Blattner FR, Perna NT. 2004. Mauve: multiple alignment of
conserved genomic sequence with rearrangements. Genome Research 14:1394–1403
DOI 10.1101/gr.2289704.
DeBoer APN, VanderOost J, Reijnders WNM, Westerhoff HV, Stouthamer AH, VanSpanning RJM. 1996. Mutational analysis of the nor gene cluster which encodes
nitric-oxide reductase from Paracoccus denitrificans. The FEBS Journal 242:592–600
DOI 10.1111/j.1432-1033.1996.0592r.x.
Einsle O, Kroneck PM. 2004. Structural basis of denitrification. Biological Chemistry 385:875–883.
Galbally IE, Kirstine W. 2002. The production of methanol by flowering plants and
the global cycle of methanol. Journal of Atmospheric Chemistry 43:195–229
DOI 10.1023/A:1020684815474.
Garneau JE, Dupuis ME, Villion M, Romero DA, Barrangou R, Boyaval P, Fre-maux C, Horvath P, Magadan AH, Moineau S. 2010. The CRISPR/Cas bacterial
immune system cleaves bacteriophage and plasmid DNA. Nature 468:67–71
DOI 10.1038/nature09523.
Goris J, Konstantinidis KT, Klappenbach JA, Coenye T, Vandamme P, Tiedje JM. 2007.
DNA-DNA hybridization values and their relationship to whole-genome sequence similarities. International Journal of Systematic and Evolutionary Microbiology
57:81–91DOI 10.1099/ijs.0.64483-0.
Healey FP. 1980. Slope of the monod equation as an indicator of advantage in nutrient
competition. Microbial Ecology 5:281–286 DOI 10.1007/BF02020335.
Henshaw JL, Bolam DN, Pires VMR, Czjzek M, Henrissat B, Ferreira LMA, Fontes CMGA, Gilbert HJ. 2004. The family 6 carbohydrate binding module
CmCBM6-2 contains two ligand-binding sites with distinct specificities. Journal of Biological
Chemistry279:21552–21559DOI 10.1074/jbc.M401620200.
Horvath P, Romero DA, Coûté-Monvoisin AC, Richards M, Deveau H, Moineau S, Boyaval P, Fremaux C, Barrangou R. 2008. Diversity, activity, and evolution of
CRISPR loci in Streptococcus thermophilus. Journal of Bacteriology 190:1401–1412
DOI 10.1128/JB.01415-07.
Kaspar HF. 1982. Nitrite reduction to nitrous-oxide by Propionibacteria- Detoxication
Mechanism. Archives of Microbiology 133:126–130DOI 10.1007/BF00413525.
Labbé N, Juteau P, Parent S, Villemur R. 2003. Bacterial diversity in a marine
methanol-fed denitrification reactor at the Montreal Biodome, Canada. Microbial Ecology
46:12–21DOI 10.1007/s00248-002-1056-6.
Labbé N, Laurin V, Juteau P, Parent S, Villemur R. 2007. Microbiological community
structure of the biofilm of a methanol-fed, marine denitrification system, and iden-tification of the methanol-utilizing microorganisms. Microbial Ecology 53:621–630
DOI 10.1007/s00248-006-9168-z.
Labbé N, Parent S, Villemur R. 2003. Addition of trace metals increases denitrification
rate in closed marine systems. Water Research 37:914–920
DOI 10.1016/S0043-1354(02)00383-4.
Labelle M-A. 2004. Optimisation d’un bioprocédé de dénitrification d’un sytème
aquacole marin en circuit fermé au Biodôme de Montréal. Master thesis, École Polytechnique de Montréal.
Laurin V, Labbé N, Juteau P, Parent S, Villemur R. 2006. Long-term storage conditions
for carriers with denitrifying biomass of the fluidized, methanol-fed denitrification reactor of the Montreal Biodome, and the impact on denitrifying activity and
bacte-rial population. Water Research 40:1836–1840DOI 10.1016/j.watres.2006.03.002.
Laurin V, Labbé N, Parent S, Juteau P, Villemur R. 2008. Microeukaryote diversity in a
marine methanol-fed fluidized denitrification system. Microbial Ecology 56:637–648
DOI 10.1007/s00248-008-9383-x.
Le SQ, Gascuel O. 2008. An improved general amino acid replacement matrix. Molecular
Biology and Evolution25:1307–1320DOI 10.1093/molbev/msn067.
Makarova KS, Haft DH, Barrangou R, Brouns SJJ, Charpentier E, Horvath P, Moineau S, Mojica FJM, Wolf YI, Yakunin AF, Van der Oost J, Koonin EV. 2011.
Evolu-tion and classificaEvolu-tion of the CRISPR-Cas systems. Nature Reviews. Microbiology
9:467–477DOI 10.1038/nrmicro2577.
Martineau C, Mauffrey F, Villemur R. 2015. Comparative analysis of denitrifying
activities of Hyphomicrobium nitrativorans, Hyphomicrobium denitrificans, and
Hyphomicrobium zavarzinii. Applied and Environmental Microbiology 81:5003–5014
DOI 10.1128/AEM.00848-15.
Martineau C, Villeneuve C, Mauffrey F, Villemur R. 2013a. Hyphomicrobium
nitra-tivoranssp. nov., isolated from the biofilm of a methanol-fed denitrification system treating seawater at the Montreal Biodome. International Journal of Systematic and
Evolutionary Microbiology63:3777–3781DOI 10.1099/ijs.0.048124-0.
Martineau C, Villeneuve C, Mauffrey F, Villemur R. 2013b. Complete genome sequence
of Hyphomicrobium nitrativorans strain NL23, a denitrifying bacterium isolated from biofilm of a methanol-fed denitrification system treating seawater at the Montreal Biodome. Genome Announcements 2:e01165–13.