The causal in‡uence of social capital on immigrant
health conditions in Canada
Caroline Berchet (Université Paris-Dauphine) Audrey Laporte (Toronto University)
Résumé
A partir d’une enquête représentative de la population immigrée au Canada ("The Longitu-dinal Survey of Immigrant in Canada"), ce chapitre s’intéresse à l’in‡uence causale du capital social (mesuré par la participation associative) sur la santé et le recours aux soins des immigrés. Ce chapitre apporte par ailleurs un éclairage empirique sur la relation existante entre le capital social, le capital humain et la santé des immigrés. Nous commençons par estimer des modèles Probit puis nous résolvons le problème d’identi…cation du capital social en utilisant plusieurs modèles Probit dynamiques bivariés. Les résultats des estimations sont cohérents avec la littéra-ture existante puisque nous montrons une in‡uence positive de la participation sociale sur l’état de santé et le recours aux soins des immigrés. De plus, nos résultats indiquent que certaines acti-vités sociales sont plus protectives que d’autres, telles que la participation à des groupes sportifs, religieux, les clubs culturels ou encore les associations politiques. Plus important encore, nous montrons que l’e¤et du capital social sur la santé des immigrés di¤ère selon leur niveau de capi-tal humain, mesuré par leur niveau d’éducation. En particulier, le capicapi-tal social semble être un substitut au capital humain dans la fonction de production de la santé des immigrés alors que le capital social et le capital humain apparaissent complémentaires pour accroitre l’utilisation des services de santé des immigrés.
Abstract
Using a representative longitudinal survey of the immigrant population in Canada (the "Lon-gitudinal Survey of Immigrants in Canada"), this article assesses the causal in‡uence of social capital (as measured by social participation) on immigrant health status and health care use. Furthermore, it sheds light on the relationship existing between social capital, human capital and immigrant health conditions. We begin with Probit models but then address the identi…-cation issue of social capital using several bivariate dynamic Probit models. Estimation results are consistent with exiting literature since we …nd a positive in‡uence of social participation on immigrant health status and health care use. Moreover, our analyses reveal that some so-cial activities are more protective than others such as participation to sporting groups, church groups, cultural clubs or political associations. More importantly, the e¤ect of social capital on immigrant health conditions seems to di¤er according to their human capital level, measured through educational attainment. In this respect, social capital appears to act as a substitute for human capital to enhance immigrant health status while we found a complementary e¤ect between social and human capital to increase immigrant health care utilisation.
1. Introduction
The World Health Organization’s Commission on Social Determinants of Health (CSDH) identi…ed social determinants as the most important determinants of health, beyond the tradi-tional boundaries of the health-care sector. Therefore, they represent good candidates for the focus of public health policies aimed at “closing the gap” in health inequalities (CSDH, 2008). According to Epstein et al. (2009), one important issue that has not been fully addressed em-pirically is whether there is a causal link between social determinants of health and health inequalities. While a number of studies have documented the existence of di¤erences in health or health care use according to socioeconomic status (Devaux and de Looper, 2012 ; Bago d’Uva and Jones, 2009 ; Van Doorslaer, Koolman and Jones, 2004 ; Wagsta¤ and Van Doorslaer, 2000), few provide evidence of a causal impact of social determinants of health, and as a consequence, it has been di¢ cult to identify potential tools for tackling health inequities (Epstein et al.,2009 ; Marmot et al.,2008).
Apart from the usual socioeconomic characteristics, such as education, income, occupation, housing and working conditions, some recent studies have stressed the importance of factors relating to social capital to explain di¤erences in individual health (Kawachi et al.,2008 ; Berkman et al., 2000). In the past decade, evidence has accumulated from many countries …nding an association between health status and social capital, where social capital is most often measured by social participation (Jusot et al.,2008 ; Sche- er and Brown, 2008 ; Islam et al.,2006). However, only a few studies have provided evidence of the causal impact of social capital on health status (Ronconi et al.,2012 ; Sirven and Debrand, 2012 ; d’Hombres et al.,2010 ; Folland, 2007). An important consideration in this literature is the potential endogeneity of social capital : is a large stock of social capital the result of good health or is good health the result of a large stock of social capital (Kawachi, 2007). Another issue that has not been fully explored is the extent to which social capital has a protective e¤ect for certain population sub-groups, and in particular for immigrants who by virtue of coming from another country may have weaker links, at least initially to the formal health and social care service sectors. Finally, the interaction between social capital, human capital and health is less understood, some studies suggest that there is a substitution e¤ect between social and human capital while others suggest that they are complementary to each other to improve population health (OECD, 2010a).
This research contributes to the existing literature in two ways. Firstly, it overcomes the problem of endogeneity and explores the causal e¤ect of social capital on immigrant health conditions. Secondly, it sheds light on the relationship existing between social capital, human capital and immigrant health conditions in Canada. Using a representative longitudinal survey of the immigrant population in Canada, we assess the causal in‡uence of social capital on immigrant health status and health care use according to their level of human capital. We begin with Probit models but then address the identi…cation issue of social capital using several bivariate dynamic Probit models.
The article is structured as follows : the next section (section 2) presents a brief overview of the existing literature on immigrant health and social capital in Canada. Section 3 introduces the data and variables used in the regression analyses. The methodology and the estimation strategy are presented in section 4. The results are presented in section 5, followed by a conclusion in section 6.
2. Previous literature on immigrant health and social
capital in Canada
Immigrants represent an increasing proportion of the Canadian society, accounting for 21.3% of Canada’s population in 20101. Welcoming a high number of immigrants (281 000 new perma-nent immigrants and 384 000 new temporary residents in 2010), Canada is a major immigrant-receiving country (OECD, 2012). Immigration policies are based since 1967 on a points system to highly select immigrants according to their education, language pro…ciency or work expe-rience (OECD, 2006). The points system has substantially modi…ed the immigration pattern in Canada in terms of source countries and quali…cation. The proportion of recent immigrants born in Asia (such as China, India, Pakistan or Philippines) has largely increased : only 12.1% of newly immigrants were born in Asia in the late 1960s against 40.8% of recent immigrants in 2006 (Statistic Canada, 2006). Immigrants in Canada also are highly educated and have in average more tertiary quali…cations than the native population (OECD, 2006). Furthermore,
1Department of Economic and Social A¤airs of United Nations : Trends in International Migrant Stock : The
immigrants to Canada are required to be screened for serious chronic conditions and infec-tious diseases, which excludes from migration individuals in poor health (Health Canada, 2010). This legislation makes immigrants to have higher health than the native population, a selection process known as the “Healthy Immigrant E¤ect”. The Healthy Immigrant E¤ect suggests, in addition, that immigrants in good health are more likely to immigrate because they are the strongest members of their population of origin (Fennelly, 2007).
Although existing literature has con…rmed that immigrants are healthier than the native population at the time of arrival, there is strong evidence suggesting that their health decline and converge with the native-born population’s level over time (McDonald and Kennedy, 2004 ; Newbold and Danforth, 2003). Several explanations have been proposed to understand why their initial health advantages disappear with an increased length of stay in the host country. First, barriers to access the health care system may result in immigrants under-using health care services, worsening their health status (Newbold, 2009). If universality is one of the core principles of the Canada Health Act2 (Elgersma, 2008), new immigrants3 must face a wait of three months to be entitled to health insurance in 5 provinces (Ontario, Quebec, Nunavut, Yukon Territorry and Manitoba). In practice, the average waiting period is much longer than the three mandatory months since it can average 2.1 years (Caulford and Vali, 2006). As a result, immigration agencies recommend immigrants to buy private insurance to cover the …rst months of residency but this alternative is often declined by new immigrants (OMR, 2011). Furthermore, Community Health Centers o¤er free health care services for new immigrants but there are long waiting list that limit their access to care (OMR, 2011). Even though immigrants are entitled to a Provincial health program, the provided services is limited since prescription drugs, dental care or eyes glasses are not covered in some Canadian provinces. As a result, new immigrants to Canada may face a number of health care access problems related to …nancial constraints, waiting lists to access doctors or to access health facilities (Kuile et al.,2007), which have been shown to imply important health consequences (Elgersma, 2008).
Beyond barriers to access the health care system, the decline in immigrant health levels has
2The Canada Health Act entitles all residents to provincially ensured health services. A resident is a person
lawfully entitled to be in or to remain in Canada and does not include tourists, transients or visitors (Elgersma, 2008, pp. 1).
3In the case of refugees with no permanent residency, the Interim Federal Health Program enables them to
also been attributed to unhealthy habits such as smoking, drinking or poor dietary practices (Cairney and Ostbye, 1999 ; McDonald and Kennedy, 2005). Immigrant’s disadvantaged socio-economic status has also been associated to immigrant poorer health status. As a matter of fact, immigrant population may su¤er from a loss of social status in the host country and may face a lower income than native population. Finally, new immigrants may su¤er from social isolation, a loss of social networks or more broadly su¤er from a lower level of social capital, factors which have been widely associated with health status or health care use4.
In the Canadian context, the work of Deri (2005), Van Kemenade et al. (2006), Newbold (2009), and Zhao et al. (2010) provide recent evidence of the association between social capital and immigrant health or health care use. In adopting a network approach to measure social capital at the individual level, these studies show a positive relationship between immigrant social capital and health status or health care utilisation.
Deri (2005) …nds that social networks, measured using an index of linguistic concentration, seems to play an important role by in‡uencing health care utilisation. Accordingly, immigrants living in areas with a high concentration of people from their own language group have an increased likelihood to access to care (Deri, 2005). However, the study reveals that social capital may reduce health care utilisation if utilisation of the formal health care system is not part of the social network norms of the particular immigrant group. In addition, the study conducted by Van Kemenade et al. (2006) based on the Canadian General Social Survey provides evidence of a signi…cant positive association between the size of network, measured as the number of ties or the participation in social activity and the immigrant health status. In contrast, using the Longitudinal Survey of Immigrants in Canada, Newbold (2009) …nds that having family members or close friends is not a statistically signi…cant factor in‡uencing immigrant health status after six months of residency in Canada. However, the results do indicate that the risk of transition from good to poorer health status after two or four years of residency is lower for immigrants who had at least a monthly social interaction with friends or family. Finally, the study conducted by Zhao et al. (2010) also based on the Longitudinal Survey of Immigrants in Canada measures social capital through social networks using di¤erent dimensions such as kinship, friendship and organisational network. Their results show that the density or the diversity of friendship networks
4The reader could refer to chapter 1 for a more comprehensive literature review on the link between social
plays an important positive role in explaining the health status of recent immigrants while participation in social activities does not appear to in‡uence immigrant health status, except for family class immigrants (i.e. those who have immigrated to Canada by being sponsored by a family member).
The main limitation of the studies presented above lies in the fact that they do not address the problem of causality between social capital and immigrant health. Actually, social capital may be associated with good health status but good health may result in a higher stock of social capital (e.g. the healthier you are, the more likely you are to engage in social activities), which implies an identi…cation issue. In addition, these studies do not consider the interaction between immigrant social capital and their educational level whereas the relationship between social capital, human capital and health is less clear (OECD, 2010a). In this respect, there is contrasting evidence : some studies suggest that human and social capital could act as substitutes while others reveal that they could be complementary to each other to improve health or health care utilisation (Ross and Wu, 1995 ; Pevalin and Rose, 2000 ; Miller et al.,2006 ; Sche- er et al.,2007 ; Sche- er et al.,2008 ; Yoon, 2008). Accordingly, the in‡uence of social capital on the health production function would di¤er by individual level of human capital, which is mostly measured through educational level.
In actual fact, some of the empirical literature based on the general population found a complementary e¤ect between social and human capital. Ross and Wu (1995) have shown that education improves health directly but also indirectly through its impact on individual social support. Accordingly, it is possible that people with a higher level of education constitute a more in‡uential or more reliable social network which may explain the greater health return to social capital that was observed for highly educated people. Similarly, the …ndings of Yoon (2008) reveal no statistically signi…cant e¤ect of social capital on lifestyles among people with a lower level of education, while a positive e¤ect was found among the highly educated people. The OECD report (OECD, 2010a) speci…es that more educated individuals may use social capital more e¢ ciently because human capital provides greater abilities to understand and use information or social norms related to social capital.
Alternatively, if a substitution e¤ect is found, social capital could be considered as an alter-native resource helping individuals with low educational levels to improve their health status
(OECD, 2010a). Few researches have directly demonstrated the substitution e¤ect between hu-man and social capital. The study conducted by Miller et al. (2006) provides evidence of a protective e¤ect of community level social capital, as measured by the number of community or-ganizations, on performing Activity Daily Living (ADL) for those with low education. However, they found no statistically signi…cant correlation between social capital and ADL for individuals with a high education level, thereby reinforcing the substitution hypothesis. Other studies reveal a stronger in‡uence of social capital among individuals with poorer socioeconomic conditions. In this light, Pevalin and Rose (2000) have shown that the in‡uence of social participation on health outcomes is greater among individuals that do not work.
Besides, Sche- er et al. (2007, 2008) have highlighted only a signi…cant association between community-level social capital, measured through the Petrix Social Capital Index (PSCI), and objective measures of health among individuals living in areas with low household income or among those whose family income is inferior to the median. Accordingly, poorer individuals may be more prone to rely on their social networks to achieve better health outcomes and thus to counterbalance their lack of education, income or employment (OECD, 2010a).
To our knowledge, no empirical analysis has been proposed to (i) examine the assumptions of a substitution or a complementary e¤ect between social and human capital on immigrant health conditions and (ii) to determine its causal in‡uence on immigrant health conditions. In this research, we consider individual social capital measured through the participation in a range of social activities.
The aim is threefold : …rstly, to determine whether individual social capital is associated with better health status and a higher health care utilisation among the immigrant population. Then, we are interested in testing a di¤erent e¤ect of social capital according to immigrant level of human capital (as measured by their educational level) and …nally, our objective is to determine the causal impact of social capital on immigrant health conditions.
3. Source and variables
3.1. Data source
The analysis of the in‡uence of social capital on immigrant health status or health care use is based on the three waves of the Longitudinal Survey of Immigrants in Canada (LSIC) collected by Statistics Canada. The LSIC is a national survey that provides a dynamic picture of the integration experience of recent immigrants to Canada. It was designed to study im-migrant integration over time and to explore the factors that hinder or assist the adaptation process in Canada. It contains information on the immigration status, demographics, socioe-conomic characteristics, language pro…ciency, settlement experience, social network, values and attitudes. The target population is immigrants who arrived in Canada between October 2000 and September 2001 and who were 15 years of age or older at the time of arrival5. During the …rst LSIC interview, some 12,000 immigrants aged 15 and over were interviewed between April 2001 and March 2002, about 6 months after their arrival. During the second LSIC interview in 2003 approximately two years after their arrival, about 9,300 of the same immigrants were interviewed again. In the last LSIC interview wave in 2005, about 7,710 of the same immigrants were interviewed for the third time ; approximately four years after their arrival. The analysis is based on the sample of immigrants that have been tracked over the 3 waves (7,710 immigrants) and longitudinal weights designed by Statistics Canada are used to account for sample attrition (Statistic Canada, 2007)6.
3.2. Health related variables
Two dichotomous dependant variables are considered to analyse immigrant health status and the use of health care services over time : self-rated health status and health care utilisation. Self-rated health status is derived from the following question : “In general, would you say your health is excellent, very-good, good, fair or poor ?”. Respondent self-rated health is dichotomized, for each wave, to consider separately immigrants in good health (those reporting an excellent,
5http ://www.statcan.gc.ca/pub/11f0019m/2008312/s5-eng.htm
6In our data set, we only observed the 7,710 immigrants that have been tracked over the 3 waves. That is the
reason why we are working on a balanced sample of immigrants and why we could not analysed the attrition in the sample.
very good or good health status) and immigrants in poor health (those reporting a fair or poor health status).
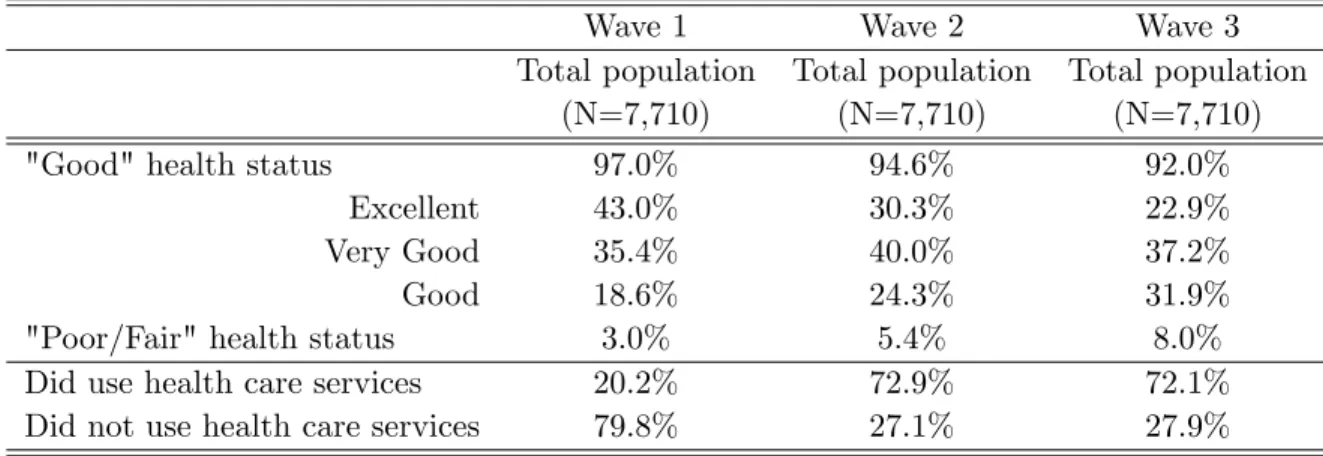
The univariate analysis depicted in Table 1 shows a decline in immigrant health status over time. The health of new immigrants is high as 97% of them report excellent, very good or good health status six months after their arrival. However, the trend seems to decline gradually over time. After two and four years of residency in Canada, the proportion of immigrants reporting a good health status is about 94.6 % and 92%7. One reason of this decline in health could be the ageing of immigrant population over time or the fact that immigrants cope with stress related to settlement or acculturation, decreasing or worsening their own health perception (Finch and Vega, 2003).
Table 1. Weighted distribution of health status and health care utilisation by wave
Wave 1 Wave 2 Wave 3
Total population Total population Total population
(N=7,710) (N=7,710) (N=7,710)
"Good" health status 97.0% 94.6% 92.0%
Excellent 43.0% 30.3% 22.9%
Very Good 35.4% 40.0% 37.2%
Good 18.6% 24.3% 31.9%
"Poor/Fair" health status 3.0% 5.4% 8.0%
Did use health care services 20.2% 72.9% 72.1%
Did not use health care services 79.8% 27.1% 27.9%
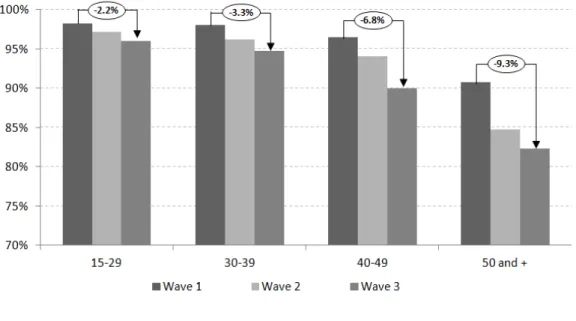
Similar declines in health status are observed in Figure 1 for each age group of immigrants. As expected, the decline in the proportion of immigrants reporting a good health status gradually increases with age, going from 2.2% for the youngest group to 9.3% for the oldest group of immigrants.
7Tests of mean equality indicate that di¤erences in self-reported health status between the 3 waves are
Figure 1. Proportion of immigrants reporting a good health status by age group and wave (Surrounded …gures represent the relative change in health status between wave 1 and wave 3)
For health care utilisation, the question asked to respondents was modi…ed across the three waves. During the …rst wave, the question is only asked to immigrants that reported some medical problems, such as physical, dental, emotional or other medical problems. If respondents reported a medical problem, they were then asked “Did you receive medical or dental attention in Canada for this or any of these problem(s) ?”. However, during the second and third waves respondents were asked : “Since your last interview, have you received any medical attention ? (For example, visited or contacted a doctor, hospital or clinic)”. Although the questions were modi…ed, we dichotomised the health care utilisation variable taking the value 1 if respondents received any medical attention.
As illustrated by Table 1, the pattern of immigrant health care utilisation largely di¤ers across waves 1, 2 and 3. Six months after arriving, only 20.2% of immigrants reported having received medical attention while in waves 2 and 3 (after 2 and 4 years of residency) 72.9% and 72.1% of immigrants respectively did so, which suggests a decrease in utilisation of 1.1% between the last two waves8.
8This di¤erence in immigrant health care utilisation between waves 2 and 3 is signi…cantly di¤erent from zero
The small proportion of immigrants who reported having used health care services at wave 1 may be …rstly explained by the fact that only respondents with health problems were asked about their health care utilisation. Secondly, immigrants residing in Canada for only 6 months must have other concerns related to the adaptation process rather than their medical needs. Finally, as mentioned previously immigrants must complete a three month waiting period before being entitled to a provincial health insurance plan, which may limit immigrant health care utilisation.
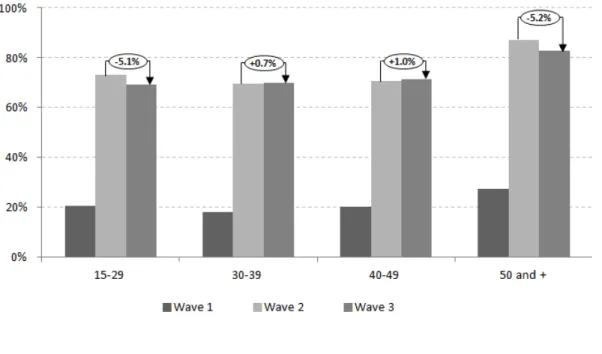
Figure 2. Proportion of immigrants using health care services by age group and wave (Surrounded …gures represent the relative change in utilisation between wave 2 and wave 3)
The pattern of health care utilisation appears more heterogeneous for each immigrant age group (Figure 2). The increase in health care utilisation between the two …rst waves occurs for each immigrant age group but no general trend can be outlined regarding the change in health care utilisation between waves 2 and 3. Although utilisation seems to slightly increase for immigrants aged between 30 and 39 years old and those aged between 40 and 49 years old, a decline in health care utilisation is observed for the youngest and oldest groups of immigrants (by 5.1% and 5.2% respectively).
3.3. Social participation as a proxy of social capital
To measure social capital, we used information relating to participation in social activities to determine the extent to which individual social capital in‡uences health related variables. Involvement in a social activity is, for each wave, measured through the following question : “Are you a member, or have you taken part in the activities of any groups or organisations in Canada (such as religious groups, ethnic associations, sport club, cultural clubs or political organisations) ?”. The variable is given the value of one if respondents claimed to take part in at least one of these activities and zero if they did not.
Table 2. Weighted distribution of social capital by type of social activity
Wave 1 Wave 2 Wave 3
Total population Total population Total population
(N=7,710) (N=7,710) (N=7,710)
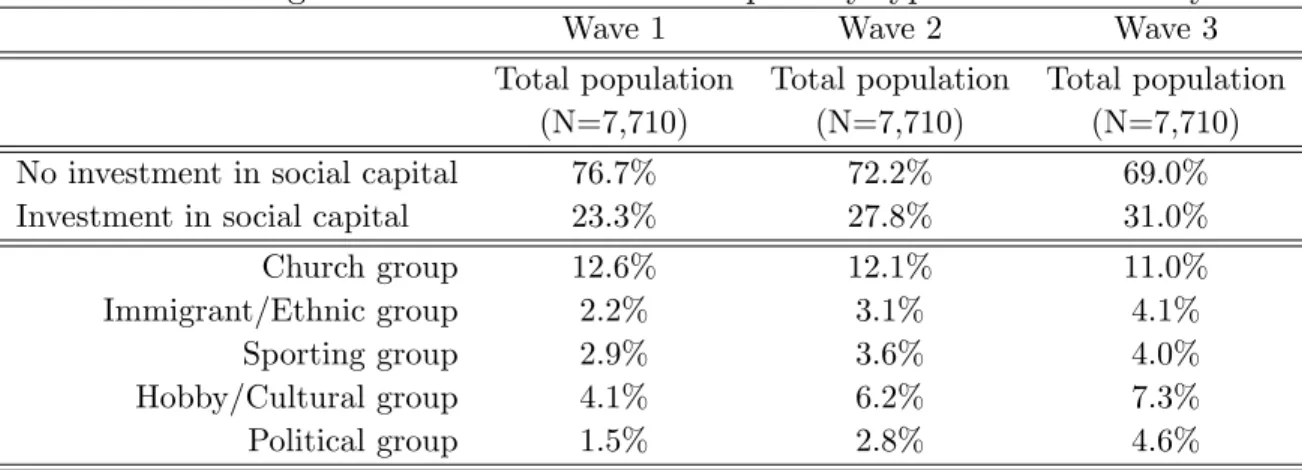
No investment in social capital 76.7% 72.2% 69.0%
Investment in social capital 23.3% 27.8% 31.0%
Church group 12.6% 12.1% 11.0%
Immigrant/Ethnic group 2.2% 3.1% 4.1%
Sporting group 2.9% 3.6% 4.0%
Hobby/Cultural group 4.1% 6.2% 7.3%
Political group 1.5% 2.8% 4.6%
Immigrant social participation seems to increase across the three waves, going from 23.3% in wave 1 to 31.0% in wave 3 (Table 2).
Table 2 also presents the distribution of social participation according to the type of social activity for each wave. Within our sample, immigrants involved in social participation are prima-rily members of a religious organisation (12.6% of the sample in wave 1 and 11% of the sample in wave 3) or members of a cultural and hobby club such as art club, service club or community organisation (4.1% of immigrants in wave 1 and 7.3% in wave 3). Although the proportion of immigrants involved in religious organisation decreases over time, the reverse trend is observed for the four other types of social participation.
3.4. Other covariates
To test the assumption that social capital may have a di¤erent impact on health conditions according to the level of immigrant human capital, we considered educational level on arrival as a proxy of immigrant human capital. Educational level on arrival was divided into three categories : high school degree or less, college degree and university level including bachelor, master or PhD degree. Within our sample, the proportion of highly educated people is signi…cant since 58.2% of immigrants reported having a university degree or more while 26.3% of immigrants graduated from high school or less and …nally, 15.5% of them had a diploma similar to a college degree (Table A1 in Appendix A).
To control for other characteristics that in‡uence health status or health care use, we also in-troduce demographic characteristics including age (continuous) and sex (considering males as the reference group). The immigrant place of birth is grouped into 7 broad areas countries : America, Europe, Asia, Middle East, Africa, Caribbean or Guyana and …nally Oceania or Australia.
Income is measured by economic family income, which refers to a group of two or more per-sons who live in the same dwelling and are related to each other by blood, marriage, common law or adoption (Statistic Canada, 2007). We created income quintiles and included a category for respondents with missing income values in any of the three waves. The possession of health insurance is a dichotomous indicator that is given the value of one if respondents have obtained a provincial health card that entitles them to medical care in their province. Information related to employment and main activity status was used to create six activity statuses : working, ho-memaker, student, retired, looking for a job and other activity status. Marital status is divided into three di¤erent levels : single, married or in a common law relationship and …nally separated, divorced or widowed. English pro…ciency on arrival is a dichotomous indicator which indicates whether respondents speak poorly or cannot speak English at all. To control for the in‡uence of other social interactions, we included two dichotomous variables indicating whether respondents have family in Canada and whether the respondent received information. For the latter informa-tion, respondents were asked "Did you receive any information that helped you adjust to life in Canada ?"9. Five provinces of destination are considered : Quebec, Ontario, British Colombia,
9The types of information received relate to the following : …nding housing, looking for a job, getting a medical
Alberta and other provinces. Finally, a variable for immigrant class was created to distinguish between family immigrants (i.e. those who have immigrated to Canada by being sponsored by a family member), economic immigrants (i.e. those who arrived as skilled workers or on a business class visa) and refugee immigrants (i.e. those claiming refugee status outside Canada).
Tables A1 and A2 in Appendix A report the distribution of others covariates used in the analysis. Within our sample, the vast majority of immigrants arrived to Canada as skilled workers or on a business class visa (66.2%), which explains why immigrants are highly educated, and they are for 63.9% of the sample native from Asian countries.
4. Econometric strategy
Our methodological approach has three components. First, we ran Probit models with random e¤ects to explore the association between social capital and health or health care use ; then we measured the relative contribution of social capital to immigrant health conditions ; and …nally we built several bivariate dynamic models of health and health care use to explore the causal in‡uence of social capital. For each component, estimates are …rst conducted on the whole population of immigrants and then by immigrant educational level to test the di¤erent e¤ect of social capital according to the immigrant level of human capital. We divided the sample of immigrants between those who are "highly" educated, which includes immigrants having at least a university degree (58.2% of the sample), and those who are "poorly" educated which includes immigrants having at most a high school or a college degree (41.8% of the sample).
4.1. Determinants of immigrant health and health care use in Canada
Using only the second and third waves of the LSIC, we …rst estimated Model A which consists of two Probit models that attempt to understand an individual’s health condition. In one such model, the dependent variable is measured by self-rated health status and in the other the dependent variable is health care use. Let us assume that health or health care use of respondent i at wave t is measured by a continuous latent variable Yit which is proxied by the binary variable Yitas follow :
credentials/work experience assessed, getting Canadian equivalencies for foreign quali…cations, how to receive basic needs and services or how to contact immigration agencies.
Model A : 8 < : Yit = 1 if Yit > 0 Yit= 0 if Yit 0
The general health production function that models health or health care use can be written as follows :
Yit = 1Sit+ 2Di+ 3Xit+ ui+ vit (4:1)
with i = 1; 2; :::; N and t = 2; 3. In equation 4.1, individual health at time t is explained by individual social capital Sit which is a dummy indicator representing whether respondent is involved in social activities. The vector Dicaptures the time invariant determinants of health and health care use (such as sex, education level at arrival, immigrant class, place at birth, etc.) and the last set of controls Xit consists of time variant determinants of health or health care use (such as age, activity status, marital status, etc.). We also introduced in the health care use model, a dummy variable representing the immigrant health status. vit is the time variant individual speci…c error term, which is assumed to be normally distributed and uncorrelated across individuals and waves while ui is the time invariant unobserved e¤ect which captures unobserved individual characteristics such as genetics, preferences or others personality traits (Cutler and Lleras-Muney, 2010).
We …rstly estimated Probit models with random e¤ects10, assuming that the errors are inde-pendent over time and uncorrelated with the explanatory variables (Maddala and Lahiri, 2009). These models explore the determinants of immigrant health and health care use and highlight the relationship between immigrant social capital, as measured by their participation in social activities, and their health status (Model A1) or health care use (Model A2) after controlling for unobserved heterogeneity. As mentioned previously, estimations are …rst conducted on the whole population of immigrants and then by immigrant educational level to test the di¤erent e¤ect of social capital according to immigrant level of human capital. We attempted to identify a complementary or a substitution e¤ect between human capital and social capital depending on the sign and signi…cance of the parameterc1 in the health production function. If, for instance,
10Fixed e¤ect models are not used in the analysis because it would have substantially reduced the sample size
insofar as the likelihood estimation would has been only based on immigrants that have seen a change in their health status or health care use between both waves. In addition, in using a …xed e¤ect model we could not estimate the parameters associated with time invariant explanatory variables that may be of interest such as immigrant class, place at birth or educational level at arrival (Maddala and Lahiri, 2009).
in Model A1 (on the health status equation)c1 0among the most educated immigrants while c1 > 0among the least educated immigrants, we then will assume that social capital and human capital are substitutes for each other to improve immigrant health status. Conversely, if in Model A2 (on the health care use equation)c1 > 0 among the most educated immigrants whilec1 0 among the least educated immigrants, we then will assume that social and human capital are complementary to each other to improve health care utilisation.
Finally, we attempted to determine whether the association between social capital and immi-grant health conditions di¤ers by type of membership in social activity. For this purpose, we ran the same random e¤ect Probit (Model A) on the whole population of immigrants considering the following social activities separately : (i) religious groups, (ii) ethnic or immigrant associations, (iii) sporting clubs, (iv) cultural or hobby organisations and …nally, (v) political organisations.
4.2. The causal in‡uence of social capital on immigrant health
conditions
Up to now we have not addressed several important issues. Firstly, any association between social capital and health conditions that we may observe in the Probit model may not be due to causality but be the result of other factors that determine both variables (implying inconsistency of parameters). One econometric solution to overcome the issue of endogeneity is to perform a bivariate Probit model to estimate simultaneously the health and social capital equations. Secondly, social capital and other covariates at each wave may have an impact on current health directly but also indirectly in in‡uencing past health. To account for the potential correlation between social capital and the other covariates with past health conditions, we used a dynamic speci…cation in which we introduced past health conditions. However, modelling a dynamic relationship with lagged value of health implies an “initial condition” issue, meaning the individual e¤ect will be correlated with the lagged value of health (Jones, 2007). Wooldridge (2005) makes this point when he notes that individual initial health status or health care use cannot be assumed to be random because it also re‡ects the individual’s past experience. To overcome this last issue, Wooldridge (2005) has suggested to model the distribution of individual unobserved e¤ect (ui) conditional on the initial value of health and the mean value of the time variant exogenous variables.
Considering these important issues, we built a dynamic bivariate Probit model with two equations in which lagged and initial values of each dependent variable were included11 (Model B). The …rst equation explains health conditions (measured alternatively by self-rated health status in Model B1 and health care use in Model B2), whereas the second explains immigrant social participation.
We …rst model the dynamic bivariate Probit model as follows :
Model B : 8 < : Yit = 1 if Yit > 0 Yit = 0 if Yit 0 and 8 < : Sit = 1 if Sit> 0 Sit = 0 if Sit 0 with 8 < : Yit = a1Yi0+ a2Yit 1+ 1Sit+ 2Di+ 3Xit+ "1it Sit = b1Si0+ b2Sit 1+ 1Di+ 2Xit+ 3Zi0+ "2it (4:2) (4:3)
Yit and Sitare the unobserved latent variables measuring respectively individual health condi-tions and individual social capital at wave t. In the …rst equation of Model B (eq: 4:2), individual health conditions at wave t are made dependent on the initial value of health conditions (Yi0), on lagged health conditions (Yit 1), on social participation at wave t (Sit) and on the set of time invariant (Di) and time variant (Xit) covariates. In the second equation of Model B (eq: 4:3), individual social capital at wave t is explained by the initial value of social capital (Si0), by lagged social capital (Sit 1), the common set of time invariant (Di) and time variant (Xit) covariates. We …nally considered Zi0;a speci…c set of covariates that is only included in the social capital equation (eq:4:3) to be used as the identifying variable. In actual fact, Lollivier (2006) states that parameters a1; a2; 1; 2; 3 of equation 4:2 are identi…able at the …rst order if and only if covariates in equation 4:2 are di¤erent from those in equation 4:3.
In this respect, we need to identify at least one variable that signi…cantly a¤ects the proba-bility of being involved in social activity but not a¤ecting immigrant health conditions. From a
11As mentioned, Wooldridge (2005) suggested not only to include the initial value of each dependant variable
but also the mean value of time variant covariates. In our research, we assume that the time variant covariates such as marital status, activity status or family income did not deeply vary between waves. Therefore, in section 4.5.2 are presented estimate results from the dynamic bivariate Probit model which solely includes initial and lagged values of each dependant variable. Nevertheless and for the sake of comparison, Table D1 in Appendix D outlines the main estimate results from the dynamic bivariate Probit model in which are also included the mean value of time variant covariates.
theoretical point of view, the choice of the identifying variable is not obvious since, to our know-ledge, no formal studies exploring the causal relationship of social capital on immigrant health have been conducted. Nevertheless, in following an empirical strategy we found two identifying variables12 that are not statistically signi…cant with immigrant health conditions but statistically signi…cant with the social capital equation.
For the …rst identifying variable, we considered a binary variable indicating whether or not respondents met friends at least once a week during the …rst wave of the survey. Although the frequency of meeting friends may be considered as a measure of individual social capital13, an immigrant’s social network during the …rst six months after his arrival may also encourage identi…cation with a social group, fostering the creation of shared norms and values which in turn increase the likelihood that an immigrant gets involved in social activities. The second identifying variable relies on the following question “What is the most useful thing that was done to help you settle in Canada ?”14. We speculate that the tangible help received by a respondent (such as the help received from government program or from immigrant services) during the …rst six months of residency may provide information, enhancing the adaptation process and increasing opportunities to get involved in social activities.
One should notice that under some assumptions on residual terms15 the parameters may also be identi…able at the second order, meaning that exclusion restrictions are not strictly necessary for the identi…cation of both equations in the case of a Bivariate Probit. We thus considered a second bivariate model (Model C) in which identifying variables were removed from the analysis16.
12Table A3 in Appendix A presents the distribution of both identifying variables. 13Refer to chapter 1.
14The answer to the question is categorised into the following items : nothing, social relationship, …nding a job
or a place to live, education or language program, government program and services for immigrants, personal quality and other things.
15Those parameters may be identi…able at the second order in supposing that conditional on the covariates,
the residual terms "1itand "2ithave a given variance, respectively 21and 22and present the following correlation
E("1it"2itjXit) = 1 2 . Given these assumptions, the model is identi…able at the second order even if the set
of covariates are identical between both equations (Lollivier, 2006).
16We performed both models B and C to test if results di¤er according to the method used in the analysis
The ultimate model to be considered can be written as follows : Model C : 8 < : Yit = 1 if Yit 0 Yit = 0 if Yit < 0 and 8 < : Sit = 1 if Sit 0 Sit = 0 if Sit < 0 with 8 < : Yit = a1Yi0+ a2Yit 1+ 1Sit+ 2Di + 3Xit+ "1it Sit = b1Si0+ b2Sit 1+ 1Di+ 2Xit+ "2it (4:4) (4:5)
The two equations of Models C and B respectively, are jointly estimated by Maximum Like-lihood (allowing the residuals "1it and "2it of both equations to be correlated) and represents the correlation coe¢ cient between both residual terms. If is signi…cantly di¤erent from zero, it indicates that the residual terms of both equations are correlated, and in other words that there is unobserved characteristics that in‡uence both health conditions and social participation. A signi…cant value of would thus con…rm the endogenity issue of social participation and would suggest that simultaneous estimations are needed to get consistent estimates of the parameters. We performed several robustness checks to test the validity of our results. We started with Model B speci…cation which includes identifying variables and then we estimated Model C in which identifying variables were not included. To further test the quality of our model with the identifying variables, we also replicated Model B on linear speci…cations by using a Two-Stage Least Square (2SLS) model17.
5. Results
5.1. Descriptive analysis of the determinants of immigrant health
status and health care use in Canada
Before assessing the causal impact of social capital on immigrant health conditions, this sec-tion presents an outline of the main factors associated with a good health status for immigrants and their utilisation of health care services. Table 3 and Table 4 present coe¢ cients estimated from Probit model with random e¤ect based on waves 2 and 3 only (Model A). The model was
17The bivariate Probit speci…cation does not enable to performed formal test of validity for our set of identifying
…rst estimated based on the whole population of immigrants (column 1 of each table), then on the least educated population (column 2 of each table) and …nally on the most educated sub-population (column 3 of each table).
* The probability of reporting good health status
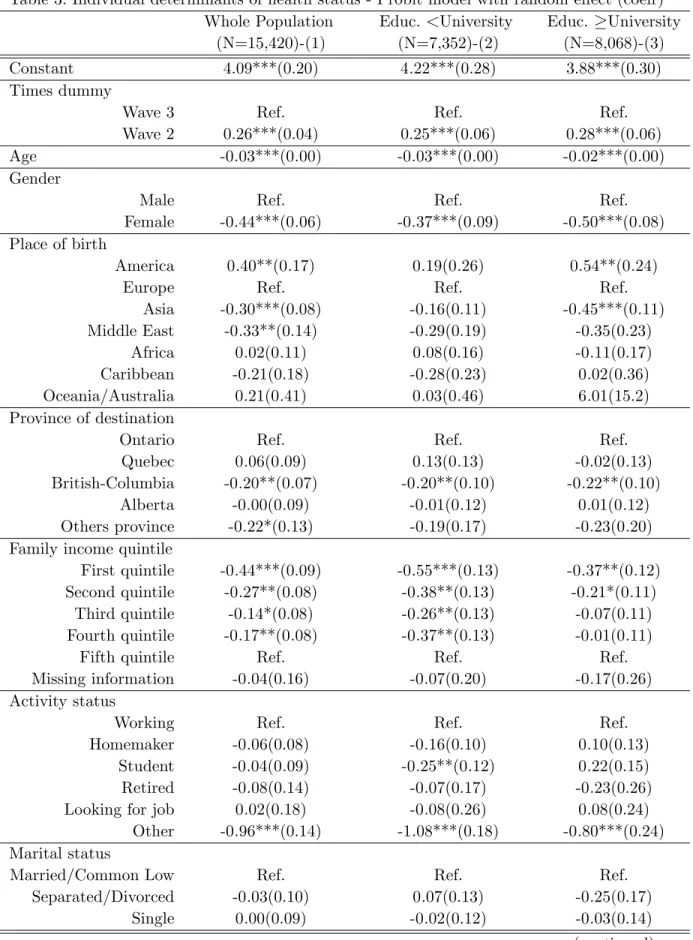
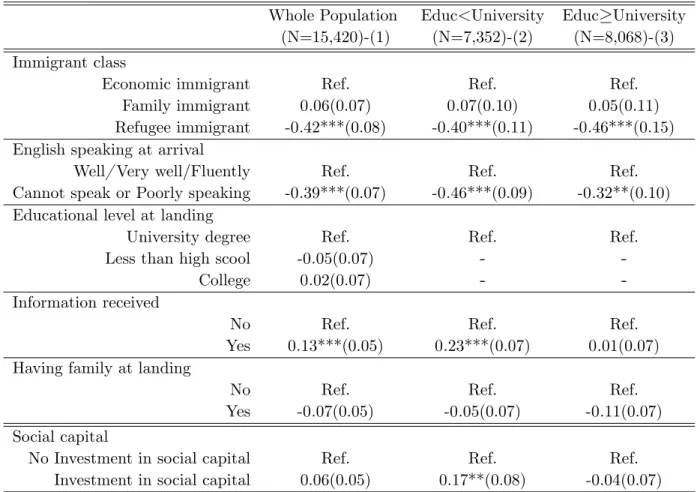
Results of the random e¤ect Probit model of health status (Model A1) are presented in Table 3. Of particular interest is the association between the level of social capital, as measured by participation in social activities, and the likelihood of reporting a good health status. The results displayed in the lower part of Table 3 show that being involved in any organisation has no signi…cant e¤ect on health status on the whole immigrant population18 (Column 1). However, social capital seems to have a signi…cant positive in‡uence on the likelihood of reporting a good health status but only among the least educated population (c1=0.17**) (Column2). Therefore, our results suggest that less educated immigrants who are engaged in any social activity report a better health status than those not engaged in social activities ceteris paribus. Surprisingly, among the most highly educated immigrants (Column 3) the coe¢ cient associated with social capital is negative and not statistically signi…cant (c1=-0.04), suggesting no health return from social capital for this sub-population. This …rst analysis reveals that social capital is positively associated with health among immigrant with a low level of education, which may suggest that social capital may act as a substitute for human capital to improve immigrant health status19.
Other covariates included in the model yield the expected in‡uence on health status and are thereby consistent with the literature on social determinants of health (Marmot et al.,2008). Regardless of the immigrant level of education, females are less likely than males to report a good health, and the likelihood of reporting good health status declines with age. Both highly and poorly educated immigrants (columns 2 and 3) residing in British Columbia appear to have a
18Nevertheless, the coe¢ cient associated with social participation is statistically signi…cant at the 10% level on
the whole population of immigrant when the other variables related to social interaction are removed from the analysis, namely when we removed "having family in Canada" and "having received information". This result means that both variables partly capture the e¤ect of social capital on immigrant health status.
19Another way to test the correlation between social participation and health status is to perform a pooled
Probit model to estimate the association between social participation and the likelihood of su¤ering from health deterioration. The new dependant variable is equal to 1 if immigrant health status has deteriorated between waves 2 and 3, versus 0 if there is no di¤erence or if there is a positive di¤erence in health status between those waves. Table B1 in Appendix B suggest a signi…cant health return to social participation among less educated immigrants (c1=-0.019**) while no signi…cant health return was found among highly educated people (c1=-0.02
lower likelihood of reporting a good health status than those living in Ontario. Among the whole population, immigrants residing in other regions are less likely to report a good health status than those residing in Ontario, while the e¤ect is not observed among both sub-populations.
In addition, the place at birth has a signi…cant impact on health status suggesting an impor-tant role played by cultural factors or by exposure factors before migration (Spallek et al.,2011). Although immigrants born in the American continent report better health status than those born in Europe, immigrants who were born in Asia or the Middle East have a decreased likelihood of reporting a good health status. Nevertheless, the e¤ect di¤ers according to the immigrant’s level of human capital since no signi…cant di¤erence according to the place of birth is found among the least educated immigrants. Looking at the in‡uence of socio-economic characteris-tics, there are large di¤erences in health status across the income distribution. Immigrants in the lowest income quintile are less likely to report a good health status regardless of their human capital level, although correlations are more statistically signi…cant among the least educated population. All other things being equal, an immigrant’s educational level at arrival and their marital status are not signi…cantly associated with their health status. For the whole population of immigrants, those having an activity status other than being a homemaker, retired, or job seeker, present a lower likelihood of reporting a good health status. Nevertheless, among the least educated immigrants, being a student decreases the propensity of reporting a good health status compared to being employed.
Table 3. Individual determinants of health status - Probit model with random e¤ect (coe¤)
Whole Population Educ. <University Educ. University
(N=15,420)-(1) (N=7,352)-(2) (N=8,068)-(3)
Constant 4.09***(0.20) 4.22***(0.28) 3.88***(0.30)
Times dummy
Wave 3 Ref. Ref. Ref.
Wave 2 0.26***(0.04) 0.25***(0.06) 0.28***(0.06)
Age -0.03***(0.00) -0.03***(0.00) -0.02***(0.00)
Gender
Male Ref. Ref. Ref.
Female -0.44***(0.06) -0.37***(0.09) -0.50***(0.08)
Place of birth
America 0.40**(0.17) 0.19(0.26) 0.54**(0.24)
Europe Ref. Ref. Ref.
Asia -0.30***(0.08) -0.16(0.11) -0.45***(0.11) Middle East -0.33**(0.14) -0.29(0.19) -0.35(0.23) Africa 0.02(0.11) 0.08(0.16) -0.11(0.17) Caribbean -0.21(0.18) -0.28(0.23) 0.02(0.36) Oceania/Australia 0.21(0.41) 0.03(0.46) 6.01(15.2) Province of destination
Ontario Ref. Ref. Ref.
Quebec 0.06(0.09) 0.13(0.13) -0.02(0.13)
British-Columbia -0.20**(0.07) -0.20**(0.10) -0.22**(0.10)
Alberta -0.00(0.09) -0.01(0.12) 0.01(0.12)
Others province -0.22*(0.13) -0.19(0.17) -0.23(0.20)
Family income quintile
First quintile -0.44***(0.09) -0.55***(0.13) -0.37**(0.12)
Second quintile -0.27**(0.08) -0.38**(0.13) -0.21*(0.11)
Third quintile -0.14*(0.08) -0.26**(0.13) -0.07(0.11)
Fourth quintile -0.17**(0.08) -0.37**(0.13) -0.01(0.11)
Fifth quintile Ref. Ref. Ref.
Missing information -0.04(0.16) -0.07(0.20) -0.17(0.26)
Activity status
Working Ref. Ref. Ref.
Homemaker -0.06(0.08) -0.16(0.10) 0.10(0.13)
Student -0.04(0.09) -0.25**(0.12) 0.22(0.15)
Retired -0.08(0.14) -0.07(0.17) -0.23(0.26)
Looking for job 0.02(0.18) -0.08(0.26) 0.08(0.24)
Other -0.96***(0.14) -1.08***(0.18) -0.80***(0.24)
Marital status
Married/Common Low Ref. Ref. Ref.
Separated/Divorced -0.03(0.10) 0.07(0.13) -0.25(0.17)
Single 0.00(0.09) -0.02(0.12) -0.03(0.14)
Table 3. Continued
Whole Population Educ<University Educ University
(N=15,420)-(1) (N=7,352)-(2) (N=8,068)-(3)
Immigrant class
Economic immigrant Ref. Ref. Ref.
Family immigrant 0.06(0.07) 0.07(0.10) 0.05(0.11)
Refugee immigrant -0.42***(0.08) -0.40***(0.11) -0.46***(0.15)
English speaking at arrival
Well/ Very well/Fluently Ref. Ref. Ref.
Cannot speak or Poorly speaking -0.39***(0.07) -0.46***(0.09) -0.32**(0.10)
Educational level at landing
University degree Ref. Ref. Ref.
Less than high scool -0.05(0.07) -
-College 0.02(0.07) -
-Information received
No Ref. Ref. Ref.
Yes 0.13***(0.05) 0.23***(0.07) 0.01(0.07)
Having family at landing
No Ref. Ref. Ref.
Yes -0.07(0.05) -0.05(0.07) -0.11(0.07)
Social capital
No Investment in social capital Ref. Ref. Ref.
Investment in social capital 0.06(0.05) 0.17**(0.08) -0.04(0.07)
Standard errors are in parentheses. *,**,*** indicate signi…cantly di¤erent from 0 at the 10%, 5% and 1% level
The analysis also con…rms that signi…cant di¤erences in health status exist between immi-grant classes while controlling for a wide range of health determinants. Although there is no signi…cant di¤erence between economic immigrants and family immigrants, results indicate that for both sub-populations refugee immigrants are less likely to report good health status than economic ones. The language pro…ciency at landing appears as a strong determinant of immi-grant health status since individuals speaking poorly English present a reduced likelihood of reporting good or better health status. Having family in Canada upon landing is not signi…-cantly associated with better health status among both sub-populations while having received information increases signi…cantly the likelihood to report good health status among the least educated immigrant. Finally, time dummies are statistically signi…cant, suggesting that all immi-grants report ceteris paribus better health status two years after arrival compared to four years after arrival. Presumably, immigrants may cope with psychosocial stress related to settlement in the host country, which decreases or worsens their own health status.
* The use of health care services
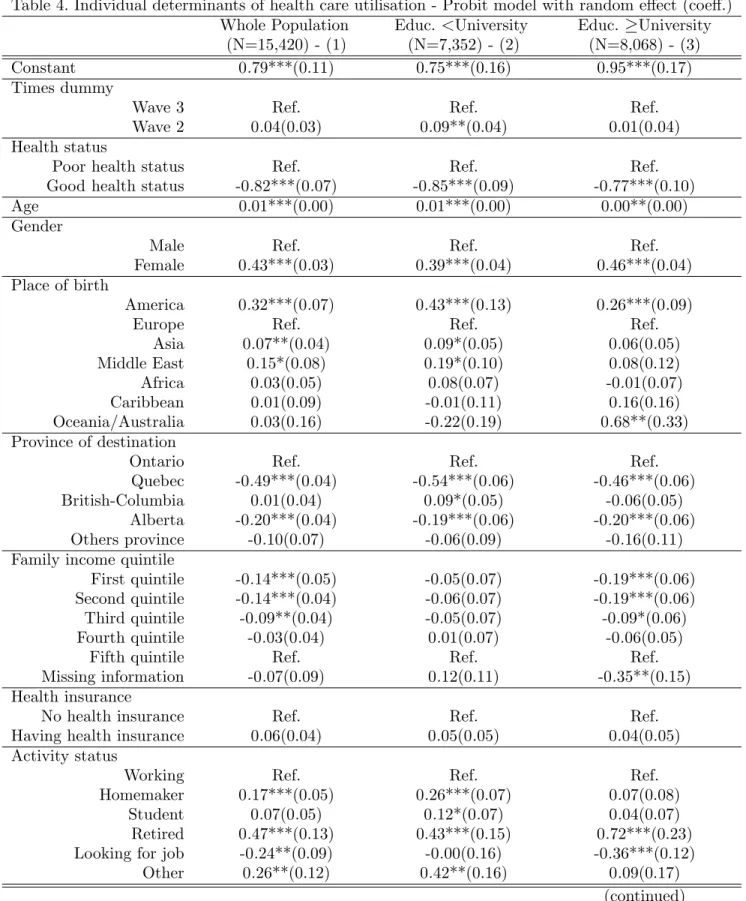
Results of the random e¤ect Probit on health care use equation (Model A2) are presented in Table 4. Consistent with previous literature on social capital in Canada (Van Kemenade et al.,2006 ; Laporte et al.,2008), immigrants engaged in social activities report an increased likelihood of using medical services than those not engaged in social activities (lower part of Table 4, Column 1). Social capital networks appear to be a signi…cant determinant of immigrant health care utilisation, possibly by sharing information on available medical resources and by providing …nancial or psychosocial support. Nevertheless, the in‡uence of social participation greatly varies according to the immigrant’s level of human capital. Although the e¤ect of social capital is strongly signi…cant among the most educated immigrants (c1=0.14***) , no signi…cant e¤ect is found among the least educated immigrants (c1=0.06)20. Therefore, at …rst sight the analysis highlights that higher levels of human capital may improve the e¢ ciency of social capital to foster the utilisation of health care services, making social and human capital complementary. Among the other determinants of the use of health care services, results indicate that having a good health status decreases the likelihood of using health care services. Among the other determinants of the use of health care services, results suggest that having a good health status decreases the likelihood of using health care services. The use of medical services also increases with age and is higher among women than men. As expected, there is a large social gradient according to income distribution, indicating that immigrants with a low level of income tend to underuse health care services compared to those with a higher level of income. Rather sur-prisingly, this social gradient is only observed among the most educated immigrants, meaning that income is not statistically signi…cant to explain health care utilisation by poorly educated immigrants.
20In addition, Table B2 in Appendix B presents the results from a pooled Probit model that estimates the
association between social participation and the likelihood to have a lower use of medical services between waves 2 and 3. The dependant variable is equal to 1 if immigrant health care use has deteriorated, versus 0 if there is no di¤erence or if there is a positive di¤erence in utilisation between those waves. Our results indicate that social participation is not signi…cantly associated with a lesser use of medical services among the whole population of immigrants as well as the sub-populations of immigrants. The lack of a signi…cant e¤ect of social participation may be the result of a slight variability in health care utilisation between waves 2 and 3. In addition, Table B2 reveals very little or no correlation between the other covariates and the likelihood of presenting a lesser use of medical services, which may also indicate a mis-speci…cation of the model.
Table 4. Individual determinants of health care utilisation - Probit model with random e¤ect (coe¤.)
Whole Population Educ. <University Educ. University
(N=15,420) - (1) (N=7,352) - (2) (N=8,068) - (3)
Constant 0.79***(0.11) 0.75***(0.16) 0.95***(0.17)
Times dummy
Wave 3 Ref. Ref. Ref.
Wave 2 0.04(0.03) 0.09**(0.04) 0.01(0.04)
Health status
Poor health status Ref. Ref. Ref.
Good health status -0.82***(0.07) -0.85***(0.09) -0.77***(0.10)
Age 0.01***(0.00) 0.01***(0.00) 0.00**(0.00)
Gender
Male Ref. Ref. Ref.
Female 0.43***(0.03) 0.39***(0.04) 0.46***(0.04)
Place of birth
America 0.32***(0.07) 0.43***(0.13) 0.26***(0.09)
Europe Ref. Ref. Ref.
Asia 0.07**(0.04) 0.09*(0.05) 0.06(0.05) Middle East 0.15*(0.08) 0.19*(0.10) 0.08(0.12) Africa 0.03(0.05) 0.08(0.07) -0.01(0.07) Caribbean 0.01(0.09) -0.01(0.11) 0.16(0.16) Oceania/Australia 0.03(0.16) -0.22(0.19) 0.68**(0.33) Province of destination
Ontario Ref. Ref. Ref.
Quebec -0.49***(0.04) -0.54***(0.06) -0.46***(0.06)
British-Columbia 0.01(0.04) 0.09*(0.05) -0.06(0.05)
Alberta -0.20***(0.04) -0.19***(0.06) -0.20***(0.06)
Others province -0.10(0.07) -0.06(0.09) -0.16(0.11)
Family income quintile
First quintile -0.14***(0.05) -0.05(0.07) -0.19***(0.06)
Second quintile -0.14***(0.04) -0.06(0.07) -0.19***(0.06)
Third quintile -0.09**(0.04) -0.05(0.07) -0.09*(0.06)
Fourth quintile -0.03(0.04) 0.01(0.07) -0.06(0.05)
Fifth quintile Ref. Ref. Ref.
Missing information -0.07(0.09) 0.12(0.11) -0.35**(0.15)
Health insurance
No health insurance Ref. Ref. Ref.
Having health insurance 0.06(0.04) 0.05(0.05) 0.04(0.05)
Activity status
Working Ref. Ref. Ref.
Homemaker 0.17***(0.05) 0.26***(0.07) 0.07(0.08)
Student 0.07(0.05) 0.12*(0.07) 0.04(0.07)
Retired 0.47***(0.13) 0.43***(0.15) 0.72***(0.23)
Looking for job -0.24**(0.09) -0.00(0.16) -0.36***(0.12)
Other 0.26**(0.12) 0.42**(0.16) 0.09(0.17)
Table 4. Continued
Whole Population Educ<University Educ. University
(N=15420)-(1) (N=7352)-(2) (N=8068)-(3)
Marital status
Married/Common Low Ref. Ref. Ref.
Separated/Divorced -0.05(0.06) -0.06(0.08) -0.03(0.10)
Single -0.16***(0.04) -0.21***(0.05) -0.05(0.06)
Immigrant class
Economic immigrant Ref. Ref. Ref.
Family immigrant 0.24***(0.04) 0.24***(0.05) 0.21***(0.06)
Refugee immigrant 0.05(0.04) 0.02(0.05) 0.12(0.08)
English speaking at landing
Well/ Very well/Fluently Ref. Ref. Ref.
Cannot speak or Poorly speaking -0.08**(0.04) -0.06(0.05) -0.14**(0.06)
Educational level at arrival
University degree Ref. Ref. Ref.
Less than high scool 0.05(0.04) -
-College -0.01(0.04) -
-Information received
No Ref. Ref. Ref.
Yes 0.12***(0.03) 0.19***(0.04) 0.06*(0.04)
Having family at landing
No Ref. Ref. Ref.
Yes 0,16***(0.03) 0,17***(0.04) 0,15***(0.04)
Social capital
No Investment in social capital Ref. Ref. Ref.
Investment in social capital 0,10***(0.03) 0,06(0.04) 0,14***(0.04)
Standard errors are in parentheses. *,**,*** indicate signi…cantly di¤erent from 0 at the 10%, 5% and 1% level
Educational level is not signi…cantly associated with the use of medical services, as well as the possession of a provincial health insurance card21. As previously outlined, the region of residence and the place of birth display a signi…cant correlation with immigrant health care utilisation, although correlations may di¤er according to the immigrant’s level of human capital.
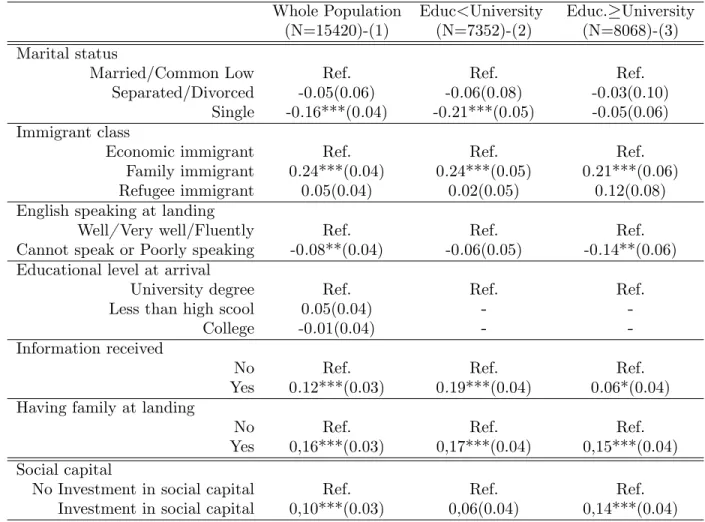
Among less educated immigrants, single individuals appear to have a lower use of medical services than married ones. However, there is no signi…cant di¤erence between married, single or divorced individuals among highly educated immigrants. Likewise, activity status has a dif-ferent impact on health care utilisation according to immigrant human capital. Among the least educated immigrants, those who are homemakers, students, retired or who are in other activities statuses are more likely to use medical services compared to employed immigrants. Conversely, among the most educated immigrants, only retired individuals are more likely to use health
21When we remove family income quintile from the estimation, health care utilisation signi…cantly increases
care services. As in the previous model, results show signi…cant di¤erences in health care use according to immigrant classes. There is no signi…cant di¤erence between economic and refugee immigrants, but family immigrants are more likely than economic ones to use health care ser-vices regardless of their level of education at arrival. Similarly, speaking English poorly decreases signi…cantly the propensity of using medical services and this is observed for all sub-populations of immigrants.
Finally, the other covariates related to social interactions are statistically associated with the likelihood of using medical services. Immigrants having family in Canada on arrival or having received information have an increased likelihood of using health care services. Furthermore, the model estimates do not show signi…cant di¤erences between the immigrant pattern of health care utilisation between waves 2 and 3, excepted for poorly educated immigrants who tend to use health care services signi…cantly more often two years after their arrival compared to four years after their arrival.
* Quantifying the association between social capital and health conditions
To quantify the association between social participation and immigrant health conditions, we carried out an alternative situation from the one currently observed and then we predicted immigrant health considering the new estimated parameters. In our case, the alternative situation supposes that all immigrants in the sample are involved in a social activity. This strategy enables us to measure the potential gain a change in the rate of social capital could on average have on immigrant health or health care utilisation (Sirven and Debrand, 2008). Accordingly, our aim was to explore the evolution of the current situation caused by the modi…cation of immigrant social participation.
For this purpose, two situations were considered : (i) the current one ("situation 0") and (ii) the situation that would be observed if every immigrant in the sample gets involved in a social activity ("situation 1"). We thus performed the same random e¤ect Probit models (Models A1 and A2) presented in section 4.4.1 considering successively "situation 0" and "situation 1" to estimate the probability of reporting a good health status and to use health care services22. The
22In “situation 0”(the current one), the random Probit models (Models A1 and A2) are estimated with social
estimated parameters from both situations were then used to compute, for the whole sample of immigrants, the average predicted probability of reporting a good health or of using health care services in the current and the alternative situation, after control for all individual covariates.
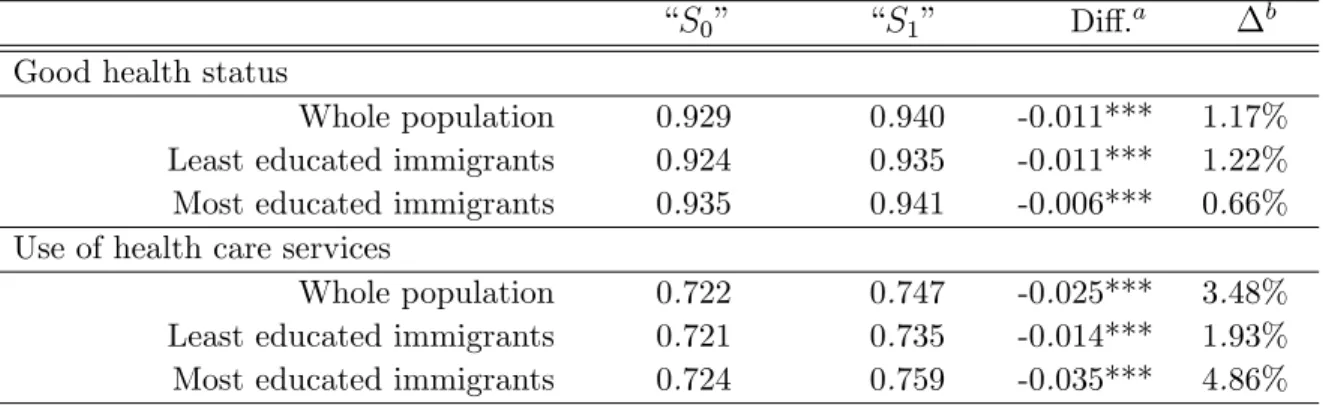
Finally, our objective was to compare the distribution of the predicted probabilities in order to examine the contribution of social capital to the average increase of immigrant health conditions. We used mean comparison tests and also computed the cumulative distribution functions for each situation to con…rm whether the contribution of social capital to immigrant health conditions is on average statistically signi…cant. Table 5 reports the predicted probability for the current ("S0") and the alternative situation ("S1") according to immigrants’educational level.
Table 5. Average predicted probabilities in the current "S0"and the alternative analysis "S1"
“S0” “S1” Di¤.a b
Good health status
Whole population 0.929 0.940 -0.011*** 1.17%
Least educated immigrants 0.924 0.935 -0.011*** 1.22%
Most educated immigrants 0.935 0.941 -0.006*** 0.66%
Use of health care services
Whole population 0.722 0.747 -0.025*** 3.48%
Least educated immigrants 0.721 0.735 -0.014*** 1.93%
Most educated immigrants 0.724 0.759 -0.035*** 4.86%
*,**,*** indicate signi…cantly di¤erent from 0 at the 10%, 5% and 1% level.
a. Signi…cance level of mean comparison tests between "S0" and "S1". b. Relative variation in % [(S1 S0)/S0].
Signi…cant di¤erences appear between the predicted probability in the observed situation and the alternative situation for both health outcomes (Table 5). According to mean comparison tests, the di¤erences between the current and the alternative situations are statistically signi…cant (p-value<0.000) among the whole population as well as the sub-populations of immigrants. Although descriptive, these results indicate that the more immigrants invest in social capital, the higher is the likelihood that they report a good health status or use health care services. Moreover, Figures C1 in Appendix C show a modi…cation of the distribution of the predicted variables. In “situation 1”(the alternative situation in which all immigrants are engaged in social activities), the random Probit models (Models A1 and A2) are estimated with only the other individuals controls (time variant and invariant characteristics) as independent variables. Therefore, “situation 1”is only conducted for immigrants that are getting involved in a social activity.
probabilities and suggest that social capital slightly improves immigrant health and health care use.
Nevertheless, the relative contribution of social capital is rather limited depending on the health outcomes considered. Regarding the likelihood of reporting a good health status, estimates reveal that on average social participation would lead to a relative increase in the share of immigrants reporting a good health status by 1.17%. Likewise, the share of individuals reporting a good health status would increase by 1.22% among the least educated immigrants due to an improvement of their social participation rate23. Turning now to the likelihood of using health care services, the evolutions caused by the modi…cation of immigrant social participation appear more pronounced. Social capital would contribute to a relative increase in the proportion of immigrants having used medical services by 3.48% for the whole population, by 4.86% for the most educated immigrants and by 1.93% for the least educated ones.
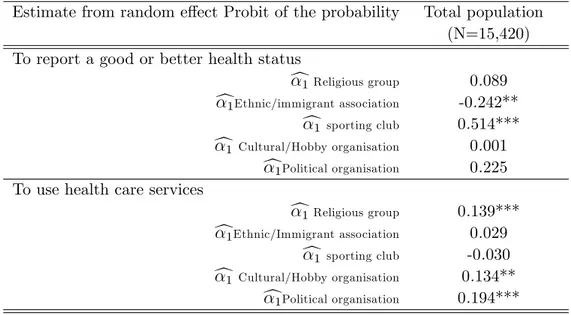
* The association between social capital and immigrant health conditions by type of social activity The following section attempts to determine whether the correlations di¤er by type of mem-bership in social activity. To achieve this purpose, we ran the same estimates previously used (Models A1 and A2) on the whole population of immigrants and we considered now the follo-wing social activities separately : (i) religious groups, (ii) ethnic or immigrant associations, (iii) sporting clubs, (iv) cultural or hobby organisations and …nally, (v) political organisations. The social capital variable is therefore divided in its …ve components. The main estimates24 of the results are reported in Table 6.
With regards to the likelihood of reporting a good health status between waves 2 and 3, estimates indicate that only membership in sporting clubs is protective for immigrant health status. As expected, immigrants who are involved in a sporting club are more likely to report a good health status. This result may however be the result of a reverse causality between membership in sporting club and health status : immigrants in a good health status are more likely to be involved in a sporting club. We will consider this causality issue in the second part of this article.
23The relative change among the most educated immigrant is even more limited with an average increase in
the share of individuals reporting a good health status by nearly 0.7%.
24We did not report the e¤ect of the other covariates because their in‡uence remains similar to the ones
Table 6. Summary of the estimated coe¢ cients associated with each type of social activity
Estimate from random e¤ect Probit of the probability Total population
(N=15,420) To report a good or better health status
c1 Religious group 0.089 c1Ethnic/immigrant association -0.242**
c1 sporting club 0.514*** c1 Cultural/Hobby organisation 0.001
c1Political organisation 0.225
To use health care services
c1 Religious group 0.139*** c1Ethnic/Immigrant association 0.029
c1 sporting club -0.030 c1 Cultural/Hobby organisation 0.134**
c1Political organisation 0.194*** Standard errors are in parentheses.
*,**,*** indicate signi…cantly di¤erent from 0 at the 10%, 5% and 1% level.
More surprisingly, we found a negative correlation between membership in an ethnic or im-migrant association and the chance of reporting a good health status. Our data is limited in exploring this negative relationship, but we suppose that ethnic or immigrant groups could be more isolated groups and at higher risk of discrimination, which might explain why members re-ported worse health status. These competing e¤ects explain why we did not observed a signi…cant e¤ect of social capital on immigrant health status (Model A1 in Table 3).
Turning now to the probability of using medical services, results from the random e¤ect Probit highlight a signi…cant protective e¤ect of being a member of a church group, hobby or cultural club as well as being a member of a political group. The creation of social bonds and social networks through membership in these social activities could thus foster the sharing of information, thereby lowering the cost of health information. In addition, participation in these social activities may also yield mutual assistance ensuring access to the health care system through for instance the provision of …nancial assistance, psychosocial support or transportation services.
Although the contribution of social capital to immigrants health condition appears on average relatively limited (between 1 and 3 percentage points) and depend on the type of membership in social activity, our results suggest that higher levels of individual social capital could improve
both the level of immigrant health status and health care utilisation. Up to now, we have observed a positive association between membership in social activities and immigrant health conditions, but we have not proved so far the causal impact of social capital on health which is the purpose of the following section.
5.2. The causal impact of social capital on immigrant health
condi-tions
The dynamic simultaneous models provide new insights into the causal in‡uence of social capital on immigrant health status and health care use. Table 7 presents estimate results from the dynamic bivariate models of health status and social capital with identifying variables (Model B1). This model was …rst estimated on the whole population of immigrants (columns 1 and 2), then on the least educated population (columns 3 and 4) and …nally on the most educated population (columns 5 and 6).
* Social capital and human capital act as substitutes to improve health status
Columns 1, 3 and 5 of Table 7 report our estimate results regarding the likelihood of reporting a good health status (Model B1). As expected, results indicate that health status follows a time path dependency : being in good health status at time t 1 has a positive e¤ect on being in good health at time t. The in‡uence of the time invariant and time variant characteristics on immigrant health status is similar to the …rst analysis presented in section 4.5.1(Table 3)25.
Column 1 of Table 7 also reports the in‡uence of social capital on immigrant health status26. The results are consistent with the empirical literature (Sirven and Debrand, 2012 ; D’hombres et al.,2010) in suggesting that social capital has a positive causal in‡uence on immigrant health status.
25Health status is signi…cantly associated with immigrant age, gender, income, activity status, province of
resi-dence, region of birth, immigrant class, language pro…ciency and the other social interaction proxies. Nevertheless, the individual determinants of immigrant health status are somewhat di¤erent according to their educational level on arrival. Refer to section 4.5.1 for a more comprehensive analysis of individual determinants of health status.
26Table D1 in Appendix D reports the main estimate results from the dynamic bivariate Probit model when
we also included the mean value of time variant covariates (Wooldridge, 2005). As expected, the introduction of mean variables did not modify the signi…cant in‡uence of social capital. The sign and the magnitude of the coe¢ cient is fairly identical (c1=0.52***).