For Peer Review Only
A review of simulated climate change impacts on groundwater resources in Eastern Canada.
Journal: Canadian Water Resources Journal Manuscript ID TCWR-2017-0081.R2
Manuscript Type: Original Paper Date Submitted by the Author: 16-Jul-2018
Complete List of Authors: Larocque, Marie; UQAM, Sciences de la Terre et de l'atmosphère Levison, Jana; University of Guelph, School of Engineering Martin, Alexandre; UQAM, Sciences de la Terre et de l'atmosphère Chaumont, Diane; Ouranos Consortium, Climate scenarios Keywords: Groundwater, Eastern Canada, Model, Climate change
For Peer Review Only
A review of simulated climate change impacts on groundwater
1
resources in Eastern Canada
2
3
Marie Larocque1*, Jana Levison2*, Alexandre Martin1, Diane Chaumont3
4
5
1
Département des sciences de la Terre et de l’atmosphère and GEOTOP Research
6
Center, UQAM, C.P. 8888 succ. Centre-ville, Montreal, QC, Canada, H3C 3P8,
514-7
987-3000 ext. 1515, [email protected]
8
2
School of Engineering and G360 Institute for Groundwater Research, University of
9
Guelph, 50 Stone Road E., Guelph, ON, N1G 2W1, [email protected]
10
3
Ouranos Consortium, 550 Sherbrooke West, 19th floor, Montreal, QC, H3A 1B9,
11
12
For Peer Review Only
Abstract14
In Eastern Canada, groundwater is the main water supply for most of the rural regions
15
and in many large urban communities. An understanding of the impacts of climate
16
change on this resource is crucial for sustainable water management in this region. The
17
objectives of this paper are to summarize the state of knowledge about possible climate
18
change impacts on groundwater dynamics in Eastern Canada thus providing a clearer
19
understanding of future conditions. Twenty-two studies are reviewed including Ontario,
20
Québec, New Brunswick, Nova Scotia, and Prince Edward Island, to identify the impacts
21
on groundwater recharge and river baseflows. The studies disagree in their estimates of
22
changes in future recharge conditions, and no trend from West to East was revealed. This
23
could be due to the use of different modelling approaches (model type, climate change
24
scenario, future horizon). Nonetheless, more inter-annual variability during the summer
25
and earlier snowmelt periods causing seasonal shifts in the recharge cycle are expected.
26
This review provided new insights that lead to the following recommendations for future
27
studies: 1) use a variety of climate models and emission scenarios; 2) promote the use of
28
integrated models when possible; 3) study long-term climate change impacts on
29
groundwater resources at different scales; 4) simulate the combined effects of climate
30
change and other pressures; and 5) develop models that cover other regions of Eastern
31
Canada as dictated by stakeholders and water managers.
32
33
Key words: Groundwater, Eastern Canada, Model, Climate change
34
For Peer Review Only
Résumé36
Dans l’est du Canada, l’eau souterraine est la principale source d’approvisionnement en
37
eau en région rurale et dans plusieurs grandes villes. La compréhension des impacts des
38
changements climatiques sur cette ressource est cruciale pour la gestion durable de l’eau
39
dans cette région. Les objectifs de cette revue étaient d’établir l’état des connaissances
40
sur les impacts possibles des changements climatiques sur la dynamique des eaux
41
souterraines dans l’est du Canada afin de mieux appréhender les conditions futures.
42
Vingt-deux études portant sur les provinces de l’Ontario, du Québec, du
Nouveau-43
Brunswick, de la Nouvelle-Écosse et de l’Ile-du-Prince-Édouard ont été analysées pour
44
déterminer les impacts sur la recharge des eaux souterraines et les débits de base des
45
cours d’eau. Les études ne s'entendent pas sur une l’évolution future de la recharge et
46
aucune tendance de l’ouest vers l’est n’a été mise en évidence. Ceci pourrait être causé
47
par les différentes approches de modélisation utilisées (type de modèle, scénario
48
climatique, horizon futur). Néanmoins, les résultats montrent généralement une plus
49
grande variabilité interannuelle de la recharge estivale et une recharge printanière plus
50
hâtive. Les études montrent que les débits d’étiage pourraient diminuer, ce qui induirait
51
des conditions critiques pour les approvisionnements en eau et pour les écosystèmes.
52
Cette revue a fourni un nouvel éclairage qui a conduit aux recommandations suivantes
53
pour les études futures: 1) utiliser une variété de modèles climatiques et de scénarios
54
d'émission; 2) utiliser des modèles intégrés lorsque possible; 3) étudier les impacts à long
55
terme des changements climatiques sur les ressources en eaux souterraines à différentes
56
échelles; 4) simuler les effets combinés du changement climatique et d'autres pressions;
For Peer Review Only
et 5) élaborer des modèles qui couvrent d'autres régions de l'est du Canada dictées par les
58
intervenants et les gestionnaires de l'eau.
59
60
Most-clés: eau souterraine, est du Canada, modèle, changement climatique
61
62 63
For Peer Review Only
INTRODUCTION64
Throughout the world, climate change has become evident from the observations of
65
global mean temperature rise and the higher frequency of extreme weather events (IPCC
66
2013). These changes could affect groundwater resources in a variety of ways (Taylor et
67
al. 2012). In a warmer climate, increasing demand of water is expected to lead to
68
increased pumping rates for drinking water and irrigation. Conditions of depleting
69
groundwater reservoirs and reduced groundwater flow to rivers, wetlands, and lakes are
70
either already clearly evident or expected around the world in the next decades (Ferguson
71
and Gleeson 2012; Crosbie et al. 2013; Castle et al. 2014; Döll et al. 2014; Kløve et al. 72
2014; de Graaf et al. 2017).
73
Canada is amongst the world’s richest countries in terms of fresh water resources
74
(FAO 2003). Throughout Canada, groundwater provides approximately 30% of the
75
population with potable water and is often the only source of water in rural areas (ECCC
76
2017). When investigating the presence of climate change impacts in past time series of
77
baseflows and groundwater levels across the country, Rivard et al. (2009) have identified
78
mixed increasing and decreasing trends country-wide. However, the Atlantic Provinces
79
showed statistically significant decreases of baseflows, while some regions north of 55°N
80
had increasing baseflows. The majority of the longer time series showed negative trends
81
during the summer months. Chen (2015) assessed the impact of climate change on
82
groundwater dynamics at the continental-scale using the integrated HydroGeoSphere
83
model (Therrien et al. 2010) for the entire country and the northern part of the
United-84
States. Confirming some of the trends identified by Rivard et al. (2009), Chen (2015)
For Peer Review Only
showed that annual streamflow in most of the northern main rivers could increase under
86
climate change, but results for the southern regions were less clear.
87
In 2016, more than 68% of the country’s population resided in Eastern Canada,
88
notably in Ontario and Québec (Statistics Canada 2016). In Eastern Canada, groundwater
89
is a frequent source of water for many usages like municipal water supply, irrigation for
90
agriculture, and private wells for potable water. In Ontario, Québec, and the Atlantic
91
Provinces respectively, 14, 17, and 12% of irrigation water for farming was taken from
92
groundwater in 2012 (Statistics Canada 2012). A rainfall rate increase is expected, based
93
on a high-resolution regional climate modelling study over the Great Lakes basin
94
(d'Orgeville et al. 2014). Among other effects, climate change is expected to lead to
95
earlier spring flood events and to more severe summer low flows (Ouranos 2015). In the
96
Atlantic Provinces, more storm events and increasing storm intensity, rising sea levels,
97
storm surges, and coastal erosion are expected from climate change (Climate Action
98
Network 2017). The impacts of climate change on groundwater resources are not fully
99
understood and a global picture of possible future conditions is not yet available for water
100
managers.
101
The simulation of possible groundwater flow conditions provides interesting outlooks
102
for potential conditions in future decades. However, modeling studies are expensive, are
103
often of local application, and can be based on a wide array of future conditions (e.g.,
104
stemming from different climate models, groundwater flow models, and emissions
105
scenarios). Holman et al. (2011) made methodological recommendations aimed at
106
improving the assessment of climate change impacts on groundwater. In recent years, the
107
general approach has tended towards implementing these recommendations. As a result,
For Peer Review Only
recent studies now commonly used multiple climate change scenarios, including
109
scenarios from global climate models (GCMs), regional climate models (RCMs),
110
different greenhouse gas (GHG) emission scenarios, different downscaling methods and
111
different future horizons (see discussion in Kurylyk and MacQuarrie 2013). Additionally,
112
modeling studies are performed on a wide variety of spatial scales, using models that
113
simulate the dynamics of the entire water cycle or fluxes in some reservoirs only (soil,
114
aquifer, or river). For all these reasons, it is difficult to compare modeling results and to
115
use them in water management decisions that would include adaptation options. The
116
objective of this paper was to summarize the state of knowledge about simulated climate
117
change impacts on groundwater dynamics in Eastern Canada, in order to provide a clearer
118
understanding of possible future conditions and to make recommendations for future
119 studies. 120 121 BACKGROUND INFORMATION 122
Hydrological, hydrogeological, and integrated models
123
A wide array of models are available to study issues related to groundwater flow.
124
Models such as the spatially distributed HYDROTEL model (Fortin et al. 2001) or the
125
conceptual HBV model (Lindström et al. 2007), can be used to simulate surface flow
126
processes. They usually include a highly simplified representation of the aquifer that
127
empties with a calibrated reservoir coefficient. Nevertheless, surface flow models can be
128
useful to study climate change impacts on groundwater resources if they are used to
129
provide information on future base flow which corresponds to groundwater discharge to
130
the surface in rivers.
For Peer Review Only
Groundwater flow models such as MODFLOW (saturated flow; Harbaugh 2005) and
132
FEFLOW (saturated and unsaturated flow; DHI-WASY 2013) are widely used. This
133
category also includes models dedicated to simulate recharge and which are used with
134
groundwater flow models to provide the upper boundary condition of water that reaches
135
the aquifer through the surface. The most widely used in this category is the HELP model
136
(Schroeder et al. 1994). The SUTRA model (Voss and Provost 2002) allows the
137
simulation of coupled groundwater flow and groundwater temperature and is used to
138
understand the warming effect of climate change on groundwater flow systems. The
139
SEAWAT model (Guo and Langevin 2002) is software based on MODFLOW/MT3DMS
140
(Bedekar et al. 2016). It simulates 3D density-dependent groundwater flow and is
141
frequently used to simulate saltwater intrusion in coastal aquifers.
142
Integrated models represent the entire land water cycle and usually include
143
evapotranspiration, snow accumulation and melting, runoff, water routing at the surface
144
and in the river channel, infiltration, groundwater flow and groundwater discharge to
145
surface reservoirs. HydroGeoShere (Therrien et al. 2010), MikeSHE (DHI Software
146
2007), and CATHY (Camporese et al. 2010) are three examples of integrated models that
147
are widely reported in the scientific literature.
148
149
Emission scenarios, climate models, and projected horizons
150
Earlier climate modeling studies were based on GHG emission scenarios. IPCC (2000)
151
recommended the use of different emission scenarios to be used in climate modeling
152
studies (A1, A2, B1 and B2, including sub-scenarios). Representative Concentration
153
Pathways (RCPs) including four GHG concentration trajectories are now used to replace
For Peer Review Only
the former emission scenarios in climate modeling and research (van Vuuren et al. 2011).
155
The RCPs describe potential futures of the main drivers of climate change: greenhouse
156
gas and air pollutant emissions. The scenarios are named based on the change in radiative
157
forcing in 2100 compared to pre-industrial values. The RCP4.5 scenario (optimistic)
158
represents an increase in radiative forcing of 4.5 W/m2 relative to pre-industrial values. It
159
is associated with a capping of emissions which would stabilize the radiative forcing
160
caused by climate change in 2100. The RCP8.5 scenario (pessimistic) represents no
161
change in current human behaviour. Emissions continue to rise beyond 2100 when the
162
radiative forcing is increased by 8.5 W/m2 relative to pre-industrial values. Most of the
163
recent climate change impact studies use these two RCPs to account for GHG
164
concentration scenarios.
165
Climate projections are generated either directly from GCMs or from RCMs driven by
166
GCMs. The shift from SRES to RCPs also corresponds to the replacement of the CMIP3
167
global climate model ensemble (Meehl et al. 2007) with the CMIP5 ensemble (Taylor et
168
al. 2012). There are currently 20 GCMs and 12 pairs of RCM-GCM combinations for
169
North America operated by different research groups around the world for which climate
170
projections are available. Using multiple climate scenarios combining climate models and
171
emission scenarios is the usual approach for climate change impact studies to provide an
172
array of possible futures.
173
Data from climate models that are readily available for use in hydrological and
174
hydrogeological models are air temperature (daily minimum, maximum or average) and
175
precipitation. These data are generated on grids of various sizes, depending on the
176
climate model used to simulate them. Because the hydrological and hydrogeological
For Peer Review Only
models are usually of more local scale than the climate models’ resolution, and their
178
outputs usually include statistical bias, the climate model outputs are often adjusted using
179
post-processing methods. When using statistical downscaling (Themeßl et al. 2010;
180
Teutschbein and Seibert, 2012), climatic variables are linked to local meteorological
181
variables using different methods (e.g., quantile mapping, linear regression, analog
182
method). This method takes into consideration changes in climate variability. The delta
183
change method (Diaz-Neto and Wilby 2005) calculates mean deviations in temperature
184
and precipitation between future and past periods. It can be used on monthly or daily
185
data. This method assumes that rainfall frequency is not modified with climate change.
186
Dynamical downscaling (Giorgi and Mearns 1991) corresponds to running a fine scale
187
regional climate model on a sub-domain driven at its boundary by a global climate
188
model. Results from these models sometimes still need to be post-processed.
189
The earliest studies of climate change impacts on groundwater resources used climate
190
scenarios for 30 to 40 years over which the future conditions were to be considered
191
constant, and compared to simulated recent climate. The more recent climate impact
192
studies use continuous scenarios in which the simulated future conditions evolve through
193
time from past conditions in the 1950s to future 2100 conditions.
194
195
STUDIED REGIONS
196
The surveyed literature concerns studies that simulate future groundwater flow
197
conditions for the provinces of Ontario, Québec, New Brunswick, Nova Scotia, and
198
Prince Edward Island. Newfoundland and Labrador was not included in this overview
199
because no provincial- nor local-scale studies were available. Only peer-reviewed studies
For Peer Review Only
surface-groundwater flow models, recharge models, as well as surface flow models
202
which include at least a simple representation of aquifers and a quantification of
203
baseflows were considered. Surface flow studies with little or no representation of
204
groundwater reservoirs or without any explicit quantification of recharge or groundwater
205
contributions to rivers were excluded. A total of 22 studies have thus been summarized
206
spanning a wide region between southern Ontario and the Magdalen Islands (QC)
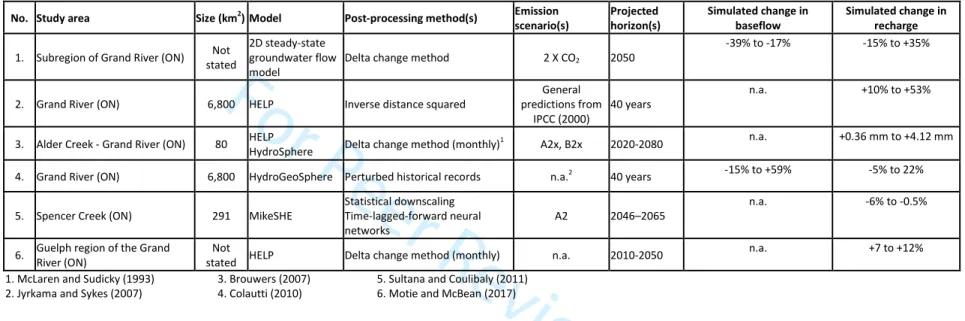
207 (Figure 1). 208 209 Ontario-based studies 210
Six studies focusing on groundwater resources and climate change have been reported
211
in the literature for Ontario (see Table 1 and Figure 1b). The studies have been conducted
212
only in southwestern Ontario with no models applied to eastern or northern Ontario.
213
Various hydrological modelling approaches, from strictly recharge models (HELP), to
214
fully-integrated models (e.g., HydroGeoSphere (HGS) and MikeSHE) have been
215
employed. Most of the studies were based on data from multiple climate models. The
216
emission scenarios included A2, B2, and a doubled CO2 equilibrium (prior to the IPCC
217
(2000) Special Report Emission Scenarios). Projected simulated durations ranged from
218
20 years (Sultana and Coulibaly 2011) to 60 years (Brouwers 2007). The earliest future
219
horizon starts in 2020 (Brouwers 2007), and the latest ends in 2080. Some studies
220
projected a future time span without using specific years (40 years in Jyrkama and Sykes
221
2007 and Colautti 2010). McLaren and Sudicky (1993) projected their future steady-state
222
flow conditions in 2050 (no time-span).
223
One of the most studied aquifer systems in Canada regarding climate change impacts
224
For Peer Review Only
southern Ontario. As early as the 1990s, researchers were anticipating the potential
226
impacts of the climate change on its groundwater resources. For instance, McLaren and
227
Sudicky (1993) used a 2D, steady-state groundwater flow model for a subregion of the
228
Grand River watershed to examine predicted head and baseflow changes. In the
229
groundwater model, a recharge change of -15 to -35% lead to baseflow changes of -17 to
230
-39%.
231
Jyrkama and Sykes (2007) presented a physically-based method to evaluate temporal
232
and spatial variability of climate change impacts on the recharge over the Grand River
233
watershed (6,800 km2). They used a GIS version of the HELP model, a distributed water
234
balance and routing model using a pseudo-2D representation to simulate the recharge.
235
Combining scenarios for temperature, precipitation and solar radiation changes yielded
236
+10% to +53% for future groundwater recharge, -12% to +10% for future surface runoff,
237
+3% to +12% for future evapotranspiration. Among various conclusions for the Grand
238
River watershed, the authors outlined that the increased recharge projected for the future
239
would not be uniformly distributed. Moreover, impacts were controlled by local
240
groundwater elevations, types of soil and land uses.
241
Brouwers (2007) coupled the HELP model with the HydroSphere model (precursor of
242
the HGS model) for saturated groundwater flow to simulate the projected behaviour of
243
the Alder Creek basin (80 km2), a subwatershed of the Grand River. The simulations
244
showed a shift in the snowmelt timing, causing a general reduction of the runoff, an
245
increase of the evapotranspiration (mainly during the summer months), and a general
246
increase of the infiltration. Impacts on groundwater were generally lower than on surface
247
water. Changes in average monthly recharge ranged from +0.36 mm (urban land,
For Peer Review Only
2060) to +4.12 mm (agricultural land, 2060-2080). The author reports that recharge
249
increased the most during the spring, with a shift of the melting season towards earlier
250
dates, although this is not apparent from the average monthly values.
251
Colautti (2010) applied the integrated HGS model in the Grand River watershed
252
(6,800 km2) using five climate scenarios. Future scenarios were constructed based on
253
modifying the 1960-1999 historical precipitation record (by -5%, +5%, +10%, +15%,
254
+20%), bounded by GCM-based climate scenario ranges. These scenarios yielded
255
recharge changes of -5% to +22%, and river discharges changes of -15% to +59% with
256
changes in groundwater levels between -0.55 m and +1.25 m. At the local-scale, Colautti
257
(2010) highlighted that simulated depth below ground surface to water table responded
258
differently from one zone to another, suggesting that the local flow patterns may be more
259
sensitive to future climate changes.
260
Sultana and Coulibaly (2011) used the integrated MikeSHE model for the evaluation
261
of climate change impacts on the Spencer Creek watershed (291 km2) in southern Ontario
262
The simulations predicted a change of annual groundwater recharge between 6% and
-263
0.5%. This decrease was particularly visible during summer and fall seasons. The authors
264
did not quantify the change in river baseflow, but they note that it is expected to decrease
265
due to the reduction of recharge.
266
Recently, Motiee and McBean (2017) applied HELP in the Guelph region (unspecified
267
study area) of the Grand River watershed to investigate the impacts of climate change on
268
recharge. The authors predicted increased evaporation and decreased summer recharge,
269
with increased recharge in the winter months due to changing freeze/thaw dynamics.
270
They determined a future recharge change between +7% and +12%.
For Peer Review Only
272
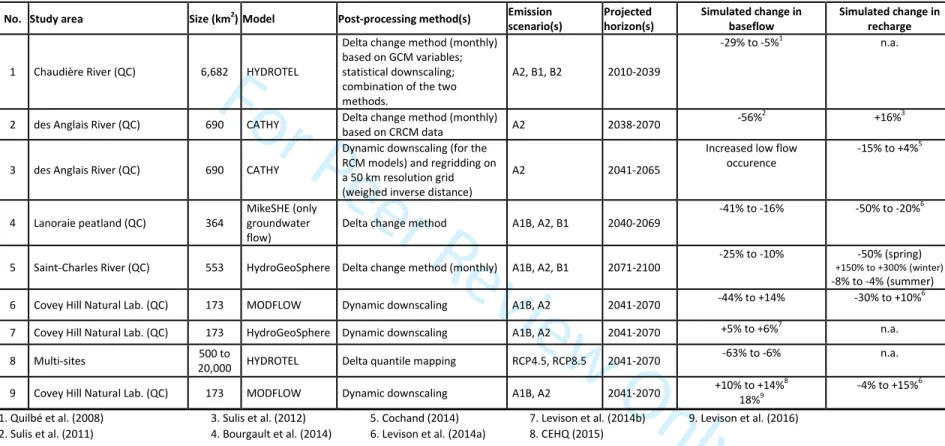
Quebec-based studies
273
Ten local to regional-scale climate change and groundwater studies in the province of
274
Québec have been reported in the literature (see Table 2 and Figure 1c). The models used
275
a surface flow (HYDROTEL), a groundwater flow (MODFLOW), or integrated
surface-276
groundwater flow (CATHY, HGS, and MikeSHE). All the studies were based on data
277
from multiple climate models. Simulated future time periods are all similar in lengths,
278
ranging between 24 years (Sulis et al. 2012) and 32 years (Sulis et al. 2011), with
279
projected horizons starting as early as 2010 (2010-2039; Quilbé et al. 2008) and as late as
280
2071 (2071-2100; Cochand 2014). The latest end for future horizons was 2100 (Cochand
281
2014). The Québec-based study from Lemieux et al. (2015) in the Magdalen Islands is
282
discussed in the Atlantic studies because of their geographical proximity.
283
Quilbé et al. (2008) assessed the effect of climate change on the Chaudière River
284
watershed (6,682 km2), with the HYDROTEL model. The results that are of interest for
285
the current paper concern the critical streamflow sequences over seven days and return
286
periods of two and ten years (Q2-7 and Q10-7), as well as critical streamflow sequences
287
over 30 days for five years return periods (Q5-30), which are considered to represent river
288
baseflows during the summer period. Interestingly, the scenarios performed with the
289
Delta method showed changes in the critical low flows of -23% to -5% for the Q2-7, -25%
290
to -7% for the Q10-7, and -29% to -7% for the Q5-30. The simulations performed with
291
statistical downscaling showed no obvious effect of climate change on summer low
292
flows.
For Peer Review Only
Sulis et al. (2011) evaluated the climate change impacts on the Anglais River
294
(690 km2; Montérégie region) with the integrated CATHY model. The authors identified
295
that the impacts on the river flow at the outlet were greater during winter peaks and
296
summer droughts. In future conditions, the total recharge changed by +16%; however, the
297
changes throughout the year were not constant. The winter recharge was higher (+49%)
298
due to increased rain and snowmelt, the spring recharge remained the same, and the
299
summer recharge was lower (-8%) due to increased evapotranspiration. The fall recharge
300
was higher (+22%) due to increased precipitation. A spatial analysis of recharge patterns
301
shows that the greatest variations in recharge are expected to occur at the highest
302
elevations. The future simulated river flows at the outlet during the June, July, and
303
August summer months (considered as baseflows) were 56% lower than those of the
304
reference period.
305
In the same des Anglais watershed, Sulis et al. (2012) also investigated the impact of
306
climate change uncertainty in hydrological processes using the CATHY model.
307
Hydrological responses (streamflow, recharge and groundwater storage) reacted
308
differently to the precipitation and temperature variations between the climate models.
309
River discharge changes varied from -18% to +11%. For the future climate, the low flow
310
occurrence frequency increased for all simulations, with a percentage change in low flow
311
occurrence between +12% and 25% for the members (comparison based on the
312
percentage of days with a discharge lower than the first decile of present-day discharges).
313
The change in total recharge varied between a -15% and +4%. The authors underline the
314
impact of changing sequences of rainy days on groundwater recharge.
For Peer Review Only
Bourgault et al. (2014) simulated aquifer-peatland-river interactions under climate
316
change in the Lanoraie peatland complex (364 km2). The authors used MikeSHE and
317
activated only its groundwater flow component. From three climate scenarios, the
318
recharge was estimated using a simple water budget calculation, based on the hypothesis
319
that there is no runoff on the highly permeable sand aquifer. The resulting recharge
320
variations ranged between 0% and -50%. The authors used average recharge scenarios of
321
-50% and -20% to simulate groundwater flow. It appeared that the storage capacity of the
322
organic deposits contributed to prevent drastic drawdown to the surrounding aquifers and
323
limit river baseflow decreases. However, despite the mitigating role of the peatland, the
324
climate scenarios indicated a change in river baseflows between -41% and -16%.
325
Cochand (2014) simulated the impact of climate change on the Saint-Charles River
326
watershed (553 km2) using the integrated HGS model. The summer and fall low flows
327
(June to October) changed between -25% and -10%, mainly due to increased
328
evapotranspiration. Increasing temperatures in winter and early snowmelts triggered
329
recharge increases (+150 to +300%) between December and March and recharge
330
decreased (-50%) in April-May. Recharge decreased also between June and October, but
331
less markedly (-4 to -8%). The winter recharge increase was observed in the higher
332
topography areas.
333
Levison et al. (2014a) developed a groundwater flow model for the Covey Hill Natural
334
Laboratory in southern Québec (173 km2; Montérégie region) using a steady-state
335
groundwater flow model (MODFLOW). Similarly to Bourgault et al. (2014), the authors
336
compared the net precipitation from the future horizon to that of the reference period for
337
all the members, with changes in net precipitation ranging between -30% and +10%.
For Peer Review Only
Assuming that recharge variations should be similar to the net precipitation variations,
339
they imposed recharge change scenarios of -30%, -15% and +10%,. The total
340
contribution from the aquifer to the rivers and streams over the study area varied between
341
-44% and +14% for the +10% and -30% recharge scenarios respectively. Near the
342
peatland, the direction of hydraulic gradients also changed in the future conditions,
343
making the peatland feed the aquifer during the summer, the fall and the winter seasons.
344
In the same location, Levison et al. (2014b) simulated the dynamics of small bedrock
345
springs under climate change conditions using the HGS model representing local scale
346
discrete fractures. Levison et al. (2014b) applied 10 climate change scenarios directly to
347
the HGS model instead of using a sensitivity analysis approach and imposed net
348
precipitation at the soil surface. The simulated spring flow rates changed by +5 to +6%
349
under future conditions, depending on the spring elevation. Results also indicated a
350
significant increase in the number of days of spring flow activity (+1 to +2%) and
351
generally more variability in the duration of the flow for all springs, although these
352
increases varied considerably depending on the spring location. The authors proposed
353
that this location might be resilient enough to face the projected climate changes, but
354
emphasized the importance of improving follow-up programs on ecologically sensitive
355
sites to acquire more information about the ability of natural habitat to face different
356
climate conditions.
357
With the Hydroclimatic Atlas, the CEHQ (2015) synthesized the impact of climate
358
change on the river regime of 50 medium size basins (500 to 20 000 km2) in southern
359
Québec. The HYDROTEL model was used to simulate flows. Changes in a series of
360
indicators were quantified to assess the impact of climate change on the watershed
For Peer Review Only
hydrology. The indicators of interest here are those for summer low flows which are
362
associated with baseflows. The results showed that summer low flows events will
363
generally be more severe and longer for all scenarios and all watersheds: Q2-7 changed by
364
-54% to -6%, Q10-7 changed by -63% to -9%, and Q5-30 changed by -56% to -8%.
365
Levison et al. (2016) also investigated long-term trends in groundwater recharge and
366
discharge for the Covey Hill Natural Laboratory using the MODFLOW model. The
367
authors compared the simulated responses of the groundwater system using observed and
368
simulated data from 1900 to 2010 and also used projected climate data for 2041-2070.
369
They used the Levison et al. (2014a) calibrated model, but applied the 10 RCM climate
370
change scenarios from Levison et al. (2014b). It was assumed that recharge variations
371
should be similar to the net precipitation variations (-4% to +15%). For the future
372
scenarios, average baseflows for the three rivers increased (from +10% to +14%), and
373
average spring flow also increased (+18%). These results, in comparison to Levison et al.
374
(2014a; 2014b) illustrate the complexity and uncertainty for making predictions for
375
groundwater and climate change.
376
377
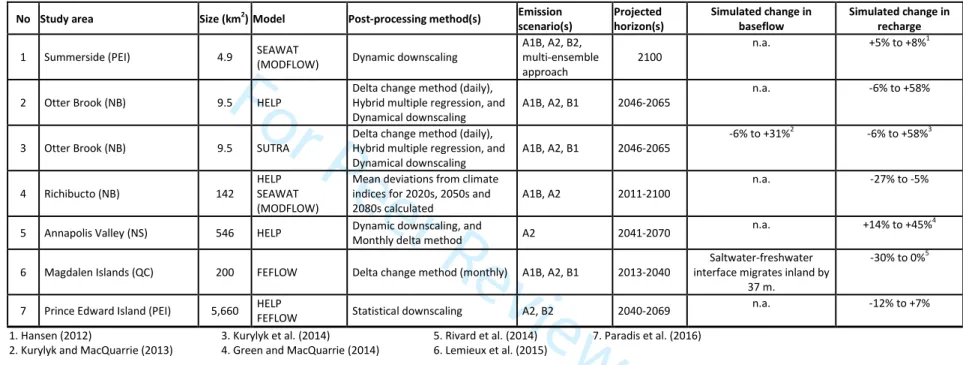
Atlantic Canada studies
378
Thus far in the literature, six climate change related groundwater modelling studies
379
have been reported for New Brunswick, Nova Scotia, and Prince Edward Island.
380
Although it is located in the Province of Québec, the Lemieux et al. (2015) study in the
381
Magdalen Islands is reported here because of its geographical proximity. The models
382
simulate recharge (HELP), groundwater flow and water temperature (SUTRA),
383
unsaturated-saturated groundwater flow (FEFLOW), and salt water intrusion
For Peer Review Only
(SEAWAT). The emission scenarios are A1B, A2, B1, and B2. The future model runs
385
span 27 years (Lemieux et al. 2015) to 90 years (Green and MacQuarrie 2014). The
386
future horizons start as early as 2011 and end as late as 2100 (both from Green and
387
MacQuarrie 2014) (see Table 3 and Figure 1d).
388
Hansen (2012) used the SEAWAT model to estimate submarine groundwater
389
discharge under climate change conditions on the coastal aquifer of Summerside (PEI).
390
The authors simulated a combination of changes in recharge (assumed to be the same as
391
changes in precipitation), changes in sea water levels and changes in aquifer pumping
392
rates. Their results show that climate change has limited impact coastal groundwater
393
discharge in the study area. Sea-level rise leads to significant saltwater intrusion (between
394
30 and 60 m) but is mitigated by a +5 to +8% change in recharge. Increasing groundwater
395
pumping appears to be the dominant process for saltwater intrusion.
396
Kurylyk and MacQuarrie (2013) simulated the impacts of climate scenarios on the
397
recharge with the HELP model at the local-scale watershed, on the Otter Brook
398
watershed (NB) (9.5 km2). The annual recharge changes varied between -6% and +58%.
399
The authors show that the post-processing method had a large impact on the results,
400
sometimes a larger impact than the emission scenario.
401
Kurylyk et al. (2014) applied the seven recharge scenarios developed by Kurylyk and
402
MacQuarrie (2013) to simulate groundwater discharge to streams in the unconfined
403
granular aquifer of Otter Brook (NB) under climate change. Groundwater flow, freezing,
404
and thawing were simulated with the SUTRA model, for two aquifer configurations
405
(aquifer discharge to the brook or to lateral seeps). The summer groundwater discharge
406
rates varied between -6% and +39%, with an increase of discharging water temperature
For Peer Review Only
up to 3.6°C. The authors conclude that small and shallow aquifers are susceptible to air
408
temperature increases and that thermal refugia could be impacted through warmer
409
groundwater inflows.
410
In the Richibucto region of New Brunswick, Green and MacQuarrie (2014) used the
411
SEAWAT and HELP models to examine relative impacts of climate change-induced
412
variations in recharge, sea level rise and increased groundwater extraction on saltwater
413
intrusion (2011-2100). Two recharge scenarios were based on a previous study (using the
414
HELP model; Jacobs 2011): one scenario reflected the projected changes developed by
415
Jacobs (2011), and the second doubled the percent change of those projections relative to
416
historic conditions. Recharge changed between -27% and -5%. The impact of decreasing
417
recharge was the most important at depths less than 60 m below sea level. Interestingly,
418
sea-level rise had the least important effect on seawater intrusion in shallow to
419
intermediate aquifers for the future scenarios. Because of the importance of both recharge
420
and pumping on seawater intrusion, the authors suggested that actions to control land use
421
influencing recharge, as well as pumping rates, may help to protect coastal
fresh-422
groundwater supplies.
423
Rivard et al. (2014) investigated the impacts of climate change on the HELP-simulated
424
recharge for the Annapolis Valley (NS) (546 km2). The results showed a change in
425
annual recharge from +14 to +45%. Recharge changes during the growing season (May
426
to October) varied between -33% and -4%.
427
Lemieux et al. (2015) simulated the depth and shape of the groundwater transition
428
zone between freshwater and seawater in the Magdalen Islands (Québec; 200 km2). The
429
simulation of density-dependent flow was performed with the FEFLOW model along a
For Peer Review Only
vertical 2D cross section. The authors calculated recharge values using a surface water
431
budget and the climate scenario variables, and in the model imposed the recharge to
432
evolve linearly from current conditions to the worst-case recharge scenario (-30%). In
433
these conditions, the impact of sea level rise was larger than that of both coastal erosion
434
and reduced recharge on the position of saltwater–freshwater interface which could
435
migrate inland over a distance of 37 m.
436
Paradis et al. (2016) investigated how nitrate concentrations in groundwater might
437
evolve under climate change conditions and with changes in agricultural practices in
438
Prince Edward Island (PEI) (5,660 km2). The HELP model was used to simulate recharge
439
with climate scenarios used with a groundwater flow model developed in FEFLOW.
440
Nitrate concentrations resulting from residual soil nitrate for eight scenarios of
441
agricultural changes were simulated with the four recharge scenarios. The results showed
442
changes in annual recharge that ranged between -12% and +7%. The generally increasing
443
nitrate concentrations were primarily attributed to the attainment of steady-state
444
conditions under present-day nitrogen loading, and to an increase in nitrogen loading in
445
some agricultural scenarios. Only 0% to 6% of the increase in nitrate concentrations in
446
groundwater was explained by changes in the recharge scenarios.
447 448 DISCUSSION 449 Changes in recharge 450
Comparing recharge rates between the different studies is not an easy task since recharge
451
is sometimes reported as mean annual values and sometimes as seasonal values. Some
452
studies simulate infiltration towards deeper soil (aquifer) layers, but do not explicitly
For Peer Review Only
quantify recharge (Quilbé et al. 2008; Levison et al. 2014b; CEHQ 2015). The studies
454
based on groundwater flow models (Bourgault et al. 2014; Green and MacQuarrie 2014;
455
Levison et al. 2014; Lemieux et al. 2015) have simulated worst-case recharge scenarios
456
and present the largest recharge decreases (maximum annual recharge decrease of 50%,
457
Bourgault et al. 2014). Although these values are useful to plan for extreme conditions,
458
they do not necessarily reflect the complete array of possible future conditions.
459
Five out of six studies based on the HELP model show recharge increases (Brouwers
460
2007; Jyrkama and Sykes 2007; Kurylyk and MacQuarrie 2013; Rivard et al. 2014;
461
Motiee et al. 2017) while four out of six studies with integrated models show at least one
462
scenario with increased recharge (Colautti 2010; Sulis et al 2011; Sulis et al 2012;
463
Cochand 2014), and four out of six studies with integrated models show at least one
464
scenario with decreased recharge (Colautti 2010; Sultana and Coulibaly 2011; Sulis et al.
465
2012; Cochand 2014). Even though it is generally calibrated on total flow and baseflow
466
separation, HELP simulates water that percolates below the root zone. It is often not clear
467
whether or not this water reaches the aquifer and travel a significant distance with the
468
saturated zone. This could explain why, when these processes are considered in
469
integrated models where lateral and vertical aquifer heterogeneity is included, the
470
changes in recharge are less conclusive.
471
The reviewed studies do not show any clear trend from West to East. Apart from the
472
type of model used in the simulations, the discrepancies between studies could be due to
473
the climate models, to the post-processing methods, or to the projected horizons.
474
However, no clear causes could be identified with the available studies. The variability
475
introduced by these components of a study have been identified by Quilbé et al. (2008)
For Peer Review Only
and Kurylyk and MacQuarrie (2013). For example, GCMs poorly simulate precipitation
477
but statistical downscaling can improve the projected values and might be superior to the
478
delta change method since it can include changes in rainfall occurrence (Quilbé et al.
479
2008) which could impact recharge fluxes.
480
The studies generally agree that a global warming would reduce snow accumulation
481
during the winter. More frequent episodes of warmer temperatures, less snow
482
accumulation, and rain during winter are expected to increase winter recharge and lower
483
spring recharge. In the future projections, recharge is often higher in the winter and lower
484
in the spring season (Brouwers 2007; Colautti 2010; Sulis et al. 2011; Sultana and
485
Coulibaly 2011; Cochand 2014; CEHQ 2015). Sulis et al. (2012) also determined that
486
changes in the duration of the wet season had a large impact on recharge. However, the
487
dynamics of winter recharge still need to be investigated to fully understand how it will
488
be impacted by climate change.
489
The three studies that focused on coastal groundwater resources in similar geological
490
formations have shown contrasting results. Those of Hansen (2012) and Green and
491
MacQuarrie (2014) indicate that sea level rise would have a limited impact on salt water
492
intrusion, while that of Lemieux et al. (2015) showed that sea level rise would have the
493
largest impact (compared to erosion and change in recharge). Lemieux et al (2015) report
494
that when using a time frame similar to that of Green and MacQuarrie (2014), the impact
495
of sea level rise becomes more important in the Magdelen Island study. It should be
496
acknowledged that sea level rise can be locally variable, so its impacts on seawater
497
intrusion are expected to exhibit more spatial patterns than recharge changes. This
498
underlines an important component of climate change impact studies, i.e. that aquifers
For Peer Review Only
can react slowly to changes in recharge and other boundary conditions. Long-term and
500
continuous transient-state simulations are expected to better reflect the slow response of
501
aquifer reservoirs.
502
The studies also show that more inter-annual variability in recharge should be
503
expected during the summer, due to warmer air temperature and to more intense
504
precipitation generating runoff instead of recharge (not easily captured by models that are
505
based on a daily time step; Allen et al. 2014). This could induce longer drought periods
506
affecting the summer baseflows (Brouwers, 2007; Quilbé et al. 2008; Sulis et al. 2011;
507
Sultana and Coulibaly 2011; Cochand 2014; Levison et al. 2014a; CEHQ 2015). Also, if
508
recharge occurs earlier in the spring, small aquifers and those located in headwater basins
509
may be fully drained by summer months which would induce early low baseflow
510
conditions. Since municipal and agricultural users generally need more groundwater
511
during the summer period than during the winter, these changes could greatly affect
512
economic activities. This underlines the importance of representing soil and hillslope
513
storage variations through time and the importance of changing sequences of rainy days
514
on the simulation of recharge (Sulis et al. 2012). Again, this stresses the importance of
515
using long-term transient-state simulations.
516
517
Changes in groundwater discharge to surface water
518
Only one Ontario-based study (out of the three that reported baseflow values) showed
519
dominating conditions of decreased baseflows (McLaren and Sudicky 1993) while that of
520
Colautti (2010) showed mixed conditions. In Québec, generally decreasing baseflows
521
were reported (Quilbé et al. 2008; Sulis et al. 2011; Sulis et al 2012; Bourgault et al.
For Peer Review Only
2014; Cochand 2014; CEHQ 2015), but mixed conditions were also reported (Levison et
523
al. 2014a; 2014b). The only study in Atlantic Canada that reported baseflows (Kurylyk et
524
al. 2014) shows mainly increasing baseflows for a small granular aquifer.
525
Sulis et al. (2011) and Levison et al. (2014a) clearly identified that changes in local
526
aquifers near surface water bodies could lead to more frequent reversals of the hydraulic
527
gradient between aquifers and surface water bodies. These reversals lead to reductions in
528
baseflow and adds pressure on ecological habitats and water users in streams and ponds
529
during droughts and low water periods in summer (e.g., Levison et al. 2014b). The
530
absence of significant decreases in baseflows under climate change conditions in New
531
Brunswick can appear counterintuitive since Rivard et al. (2009) have identified
532
decreasing trends in baseflows in past time series for Atlantic Canada. However, the only
533
climate change impact study reported here (Kurylyk et al. 2014) concerns a very small
534
watershed which might not be representative of larger scale conditions.
535
Although early studies of the impact of climate change on water resources did not
536
include consideration of groundwater flow (e.g., Southam et al. 1999), the most recent
537
studies using surface flow models incorporate at least a simplified representation of
538
aquifer reservoirs (e.g., Quilbé et al. 2008; CEHQ 2015). In these cases, the surface flow
539
model simulates baseflows which can be attributed to a groundwater contribution to the
540
river and changes in these flows under climate change conditions can be studied.
541
Interestingly, four out of five applications of integrated models show at least one scenario
542
with baseflow decrease while two out of five applications show at least one scenario of
543
baseflow increase. It is self-evident that integrated surface water-groundwater models
544
simulate more completely and probably more reliably baseflow conditions. However, in
For Peer Review Only
this review, the baseflow results appeared to be independent of the type of model
546
(groundwater flow or integrated surface-groundwater flow model). They also appeared to
547
be independent of the climate model, and of the post-processing method.
548
549
Climate change impacts in conjunction with other pressures
550
Agricultural, urban and potable water pressures on groundwater availability are
551
already of concern in most of the inhabited regions in Eastern Canada. Climate change is
552
expected to influence indirectly groundwater use which can evolve through
climate-553
driven or socio-economically-driven land use change (Taylor et al. 2012). Water quantity
554
stress assignments have been performed on the Grand River watershed and elsewhere to
555
investigate the effect of possible future increases of water use on water availability (e.g.,
556
AquaResources 2009a; 2009b) and water use conflicts (e.g., Lavigne et al. 2010a;
557
2010b). Kurylyk and MacQuarrie (2013) proposed that when studying recharge on a
558
projected horizon longer than a few decades, land use changes and socio-economic
559
factors should be taken in consideration. Nikolic and Simonovic (2015) (not reported in
560
detail herein because the paper did not provide quantified changes in recharge or
561
baseflows) have shown that at the sub-watershed scale, increasing permits to take water
562
for agriculture could have an adverse impact on the groundwater resources. Bourgault et
563
al. (2014) provide similar results and showed that increased groundwater pumping could
564
have a larger impact on groundwater resources than decreased recharge in a St. Lawrence
565
Lowlands granular superficial aquifer. Hansen (2012) and Green and MacQuarrie (2014)
566
have shown that groundwater use through pumping in coastal aquifers can exacerbate
567
saltwater intrusion. Analytical solutions have been developed to better apprehend these
For Peer Review Only
Changing land use through deforestation, expansion or changes in agricultural
570
activities or urban areas, and drainage of wetlands can have impacts on surface and
571
subsurface hydrology (Mishra et al. 2010). For example, Fossey et al. (2016) have used
572
surface flow modeling to show that isolated wetlands located in the upper part of a
573
watershed have a larger effect on maintaining low flows and damping high flow than
574
wetlands located downstream. If wetland drainage is combined with a dryer or flashier
575
future climate, the impacts of groundwater and surface water resources could be
576
exacerbated. Paradis et al. (2016) have also shown that changes in nitrogen loading that
577
could be a consequence of increased temperatures leading to different crop choices, or
578
that could result from the intensification of agricultural activities, would have a larger
579
impact on groundwater nitrate concentrations than changes in recharge.
580
581
Modelling at different scales
582
The reviewed studies cover a large range of scales. Local scale studies (< 100 km2)
583
(Brouwer 2007; Hansen 2012; Kurylyk and MacQuarrie 2013), usually need strong
584
collaborative support from specialists familiar with the regional geology and the local
585
characteristics (Frey et al. 2016). Data is often most available at the watershed scale (100
586
to 1,000 km2) where watershed organizations contribute to knowledge acquisition and
587
data availability. At that scale, most of the studies of the last decade have been
588
implemented with integrated models (Colautti 2010; Sultana and Coulibaly 2011; Sulis et
589
al. 2011; 2012; Cochand 2014; Levison et al. 2014b). Groundwater flow models are still
590
used (Levison et al. 2014a; Kurylyk et al. 2014; Lemieux et al. 2015; Levison et al.
591
2016), but they necessitate simplifications in the recharge processes or the coupling of a
For Peer Review Only
2016). This has unquantified impacts on the simulated conditions and the
surface-594
unsaturated zone-saturated aquifer feedback processes.
595
At the regional scale (2,000 to 10,000 km2) hydrogeological data and detailed
596
descriptions of aquifer properties do not always exist. Major funding has been invested in
597
aquifer characterization in the Province of Québec in the last decade (see MDDELCC
598
2017a for a full list of reports since 2009). In Ontario, there have been many regional
599
scale hydrogeological studies since the 1980s and 1990s (e.g., Howard and Beck 1986;
600
Novakowski and Lapcevic 1988; Sharpe et al. 1996; Rudolph et al. 1998). These detailed
601
groundwater data over a large region, such as in the Grand River watershed in Ontario,
602
allowed researchers to develop complete groundwater description and integrated models
603
(Jyrkama and Sykes 2007; Colautti 2010). In Atlantic Canada, the Canadian Geological
604
Survey has performed regional hydrological characterization studies in the last decade as
605
part of the Canadian Groundwater Inventory (Paradis et al. 2007; Rivard et al. 2008;
606
Rivard et al. 2012). All these initiatives have led to the development of databases that can
607
support model development for climate change studies.
608
Climate change impacts on the groundwater dynamics in Eastern Canada have not yet
609
been investigated on a provincial scale. Natural Resources Canada has recently initiated
610
the development of a fully-integrated groundwater-surface water, climate impact model
611
for the southern Ontario Phanerozoic Basin Region (Frey et al. 2016; NRCan 2017). The
612
Québec Ministry of Environment (MDDELCC) has recently initiated the development of
613
an integrated groundwater-surface water model for southern Québec that will be used to
614
better understand the impact of climate change on water resources. These models will
615
facilitate anticipating long-term changes over large areas, including those resulting from
For Peer Review Only
climate change. This is clearly a positive development towards integrated water
617
management and adaptation for future conditions. These models could include other
618
cumulative stresses occurring on groundwater resources, such as changes in land use and
619
increasing pumping for drinking water, industrial or irrigation purposes. The combination
620
of studies and models existing at different scales, developed with various purposes in
621
mind, will truly aid decision making for groundwater management.
622
623
Uncertainty in future conditions
624
The large range of possible future recharge conditions in Eastern Canada is not
625
uncommon in climate change studies. It has been reported elsewhere and appears to be
626
intrinsic to the study of climate change effects (e.g., Green et al. 2011). This variability
627
can be due to the use of various climate models, emissions scenarios, data treatment
628
methods (e.g., downscaling), and future time horizons. Although some studies have
629
aimed specifically at better understanding this component and argue that using different
630
downscaling methods and different sources of data is a necessity (Quilbé et al. 2008), the
631
studies reviewed here did not allow to identify which of these methods should be
632
prioritized over others.
633
Variability in the results also comes from the flow models themselves, notably from
634
over-simplification of the geological conditions stemming from insufficient
635
hydrogeological data used to build the model. The type of modeling approach to be used
636
is also crucial to the array of possible future conditions. The review presented here
637
indicates that coherent results appear between the three regions when similar modeling
638
approaches are used. Among these, and rather intuitively, the integrated
For Peer Review Only
groundwater flow models may be more robust to simulate climate change impacts. They
640
allow a more holistic understanding of the entire water cycle and of the feedbacks
641
between reservoirs, within a single mathematical framework, thus alleviating time and
642
spatial scale errors. Going one step further, Sulis et al. (2017) report an application of
643
coupling water flow, vegetation and atmospheric processes in western Germany. This
644
type of integrated approach is expected to become increasingly used as computer
645
capacities continue to increase in the next decade.
646
Using short time series of heads and flow rate data for model calibration data can also
647
be responsible for model uncertainty because they do not include a wide array of possible
648
meteorological and hydrological conditions (Moeck et al. 2016). A model that has been
649
calibrated based on years of wet conditions is not necessarily robust to simulate dry
650
conditions, or a succession of wet and dry periods. This is certainly a challenge, and
651
although most Canadian provinces have a reasonably well maintained surface water
652
monitoring network, groundwater monitoring has only recently received serious
653
attention. Recent efforts have been invested in Québec since 2000 to install a
province-654
wide groundwater monitoring network (MDDELCC 2017b). Ontario has had the
655
Provincial Groundwater Monitoring Network since 2001, which has 492 monitoring
656
points across the province (MOECC 2017). In Nova Scotia, the Groundwater
657
Observation Well Network was established in 1965 and currently hosts 40 observation
658
wells (Government of Nova Scotia, 2017). In New Brunswick, the groundwater
659
observation well network was established in the early 1970s, was disbanded in 2000 and
660
is currently being re-instrumented with a limited number of stations. In Prince Edward
661
Island, groundwater elevations are available for 14 monitoring wells, with data from as
For Peer Review Only
early as the 1967 for some wells available online (Government of Prince Edward Island,
663 2017). 664 665 Recommendations 666
The first recommendation from this review is that multiple scenarios from an array of
667
climate models and different climate change scenarios should be used. This follows
668
recommendations by Holman et al. (2011), and was observed in most of the reviewed
669
studies. The most recent studies use RCP scenarios and span future horizons that reach
670
2100. It is now relatively easy for researchers, consultants and water managers who wish
671
to perform climate change impact studies to have access to databases that provide
672
downscaled climate data across Canada. For example, the Pacific Climate Impacts
673
Consortium provides temperature and precipitation data from statistically downscaled
674
climate scenarios (on a grid of approximately 10 km resolution) for the entire country for
675
1950-2100 (
https://www.pacificclimate.org/data/statistically-downscaled-climate-676
scenarios). The Climate Change Data Portal (http://ccdp.network/) also provides
677
dynamically downscaled climate change scenarios (temperature and precipitation) for
678
Canada and other regions of the world. The Ouranos Consortium provides on demand
679
climate scenarios based on regional or global climate models and is currently developing
680
a web-access platform to make climate scenarios publicly available (PAVICS – Power
681
Analytics and Visualization for Climate Science).
682
The decision of which model to use is often not an easy one since it depends on
683
available data, available time to perform the study and local expertise. Nevertheless,
684
some insights arise from this review. It is clear that surface flow models provide only
For Peer Review Only
limited insight to the impact of climate change on groundwater resources because they
686
use highly simplified representations of aquifers and generally not calibrated to fully
687
represent baseflow conditions. They are thus not the preferred tool when studying climate
688
change impacts on groundwater resources. Groundwater flow models are useful to
689
understand conditions in specific areas, but they are tributary to the separate simulation of
690
recharge processes and this adds some level of uncertainty in the simulation of climate
691
change impacts. Integrated surface water-groundwater flow models are a logical
692
approach to understand the impacts of climate change on water resources, and the
693
feedbacks between different water reservoirs. The second recommendation is that these
694
models should be favored when possible in future studies.
695
This review also highlighted the important spatial variability in simulated changes for
696
recharge and baseflows. This variability can only be taken into account by using models
697
at different scales, depending on the issues under consideration. Local models, watershed
698
models, regional or supra-regional models all contribute to better understanding this
699
variability and to provide managers with decision-making tools. Topographic location,
700
geological conditions have been identified as having a possible influence on how aquifers
701
will respond to climate change. This review also has underlined the importance of
702
performing long term transient-state simulations to assess the impact of temporal
703
variability, as well as the long-term storage potential of aquifers. The third
704
recommendation is that model efforts should represent long-term climate change impacts
705
at different scales.
706
Other anthropogenic pressures such as land use changes and increased pumping rates
707
are also of crucial importance to assess combined effects and cumulated impacts. The