HAL Id: hal-02401458
https://hal-univ-evry.archives-ouvertes.fr/hal-02401458
Submitted on 20 Dec 2019
HAL is a multi-disciplinary open access
archive for the deposit and dissemination of
sci-entific research documents, whether they are
pub-lished or not. The documents may come from
teaching and research institutions in France or
abroad, or from public or private research centers.
L’archive ouverte pluridisciplinaire HAL, est
destinée au dépôt et à la diffusion de documents
scientifiques de niveau recherche, publiés ou non,
émanant des établissements d’enseignement et de
recherche français ou étrangers, des laboratoires
publics ou privés.
mass spectrometry: a new tool to probe protein-GAG
interactions
Cédric Przybylski, Florence Gonnet, Els Saesen, Hugues Lortat-Jacob, Régis
Daniel
To cite this version:
Cédric Przybylski, Florence Gonnet, Els Saesen, Hugues Lortat-Jacob, Régis Daniel. Surface plasmon
resonance imaging coupled to on-chip mass spectrometry: a new tool to probe protein-GAG
interac-tions. Analytical and Bioanalytical Chemistry, Springer Verlag, 2020, �10.1007/s00216-019-02267-2�.
�hal-02401458�
AUTHOR'S PROOF!
Metadata of the article that will be visualized in OnlineFirst
1 Article Title Surface plasmon resonance imaging coupled to on-chip mass spectrometry: a new tool to probe protein-GAG interactions 2 Article Sub- Title
3 Article Copyright -Year
Springer-Verlag GmbH Germany, part of Springer Nature 2019 (This will be the copyright line in the final PDF)
4 Journal Name Analytical and Bioanalytical Chemistry
5
Corresponding Author
Family Name Przybylski
6 Particle
7 Given Name Cédric
8 Suffix
9 Organization Université Paris-Saclay, CNRS, Université Evry
10 Division Laboratoire Analyse et Modélisation pour la Biologie et
l’Environnement
11 Address Evry 91025, France
12 Organization Sorbonne Université, CNRS
13 Division Institut Parisien de Chimie Moléculaire, IPCM
14 Address 4 Place Jussieu, Paris Cedex 05 75252, France
15 Organization Sorbonne Université, CNRS
16 Division Institut Parisien de Chimie Moléculaire, IPCM
17 Address 4 Place Jussieu, Paris Cedex 05 75252, France
18 e-mail [email protected]
19
Corresponding Author
Family Name Daniel
20 Particle
21 Given Name Régis
22 Suffix
23 Organization Université Paris-Saclay, CNRS, Université Evry
24 Division Laboratoire Analyse et Modélisation pour la Biologie et
l’Environnement
25 Address Evry 91025, France
26 e-mail [email protected]
27
Author
Family Name Gonnet
28 Particle
AUTHOR'S PROOF!
30 Suffix
31 Organization Université Paris-Saclay, CNRS, Université Evry
32 Division Laboratoire Analyse et Modélisation pour la Biologie et
l’Environnement
33 Address Evry 91025, France
34 e-mail
35
Author
Family Name Saesen
36 Particle
37 Given Name Els
38 Suffix
39 Organization Université Grenoble Alpes, CNRS, CEA
40 Division Institut de Biologie Structurale
41 Address Grenoble 38000, France
42 e-mail
43
Author
Family Name Lortat-Jacob
44 Particle
45 Given Name Hugues
46 Suffix
47 Organization Université Grenoble Alpes, CNRS, CEA
48 Division Institut de Biologie Structurale
49 Address Grenoble 38000, France
50 e-mail 51 Schedule Received 9 September 2019 52 Revised 11 October 2019 53 Accepted 8 November 2019
54 Abstract Biosensor device for the detection and characterization of
protein-glycosaminoglycan interactions is being actively sought and constitutes the key to identifying specific carbohydrate ligands, an important issue in glycoscience. Mass spectrometry (MS) hyphenated methods are promising approaches for carbohydrates enrichment and subsequent structural
characterization. In the study herein, we report the analysis of interactions between the glycosaminoglycans (GAGs) heparin (HP) and heparan sulfate (HS) and various cytokines by coupling surface plasmon resonance imaging (SPRi) for thermodynamic analysis method and MALDI-TOF MS for structural determination. To do so, we developed an SPR biochip in a microarray format and functionalized it with a self-assembled monolayer of short poly(ethylene oxide) chains for grafting the human cytokines stromal cell-derived factor-1 (SDF-1α), monocyte chemotactic protein-1 (MCP-1), and interferon-γ. The thermodynamic parameters of the interactions between these cytokines and unfractionated HP/HS and derived oligosaccharides were successively determined using SPRi monitoring, and the identification of the captured carbohydrates was carried out directly on the biochip surface using MALDI-TOF MS, revealing cytokine preferential affinity for GAGs. The MS
AUTHOR'S PROOF!
identification was enhanced by on-chip digestion of the cytokine-bound GAGs with heparinase, leading to the detection of oligosaccharides likely involved in the binding sequence of GAG ligands. Although several carbohydrate
array-based assays have been reported, this study is the first report of the successful analysis of protein-GAG interactions using SPRi-MS coupling.
55 Keywords separated
by ' - ' SPR-MS - Glycosaminoglycans - Surface plasmon resonance - Massspectrometry - Cytokines - Heparin
56 Foot note information
The online version of this article (https://doi.org/10.1007
/s00216-019-02267-2) contains supplementary material, which is available to authorized users.
Springer Nature remains neutral with regard to jurisdictional claims in published maps and institutional affiliations.
Electronic supplementary material
ESM 1UN
CORRECT
ED
PRO
OF
1 2 3 RESEARCH PAPER 45
Surface plasmon resonance imaging coupled to on-chip mass
6spectrometry: a new tool to probe protein-GAG interactions
7 Cédric Przybylski1,2&Florence Gonnet1&Els Saesen3&Hugues Lortat-Jacob3&Régis Daniel18
9 Received: 9 September 2019 / Revised: 11 October 2019 / Accepted: 8 November 2019
10 # Springer-Verlag GmbH Germany, part of Springer Nature 2019
11 Abstract
12 Biosensor device for the detection and characterization of protein-glycosaminoglycan interactions is being actively sought and
con-13 stitutes the key to identifying specific carbohydrate ligands, an important issue in glycoscience. Mass spectrometry (MS) hyphenated
14 methods are promising approaches for carbohydrates enrichment and subsequent structural characterization. In the study herein, we
15 report the analysis of interactions between the glycosaminoglycans (GAGs) heparin (HP) and heparan sulfate (HS) and various
16 cytokines by coupling surface plasmon resonance imaging (SPRi) for thermodynamic analysis method and MALDI-TOF MS for
17 structural determination. To do so, we developed an SPR biochip in a microarray format and functionalized it with a self-assembled
18 monolayer of short poly(ethylene oxide) chains for grafting the human cytokines stromal cell-derived factor-1 (SDF-1α), monocyte
19 chemotactic protein-1 (MCP-1), and interferon-γ. The thermodynamic parameters of the interactions between these cytokines and
20 unfractionated HP/HS and derived oligosaccharides were successively determined using SPRi monitoring, and the identification of the
21 captured carbohydrates was carried out directly on the biochip surface using MALDI-TOF MS, revealing cytokine preferential affinity
22 for GAGs. The MS identification was enhanced by on-chip digestion of the cytokine-bound GAGs with heparinase, leading to the
23 detection of oligosaccharides likely involved in the binding sequence of GAG ligands. Although several carbohydrate array-based
24 assays have been reported, this study is the first report of the successful analysis of protein-GAG interactions using SPRi-MS coupling.
25 Keywords SPR-MS . Glycosaminoglycans . Surface plasmon resonance . Mass spectrometry . Cytokines . Heparin
26
27
Introduction
28 Glycosaminoglycans (GAGs) are sulfated polysaccharides
29 found in the extracellular matrix and at the cell surface where
30
they are anchored to a protein core and constitute the
proteo-31
glycans assemblies [1]. They mediate cell-cell and cell-matrix
32
interactions involved in a variety of physiological and
patho-33
logical functions such as in embryonic development, cell
34
growth and differentiation, homeostasis, inflammatory
re-35
sponse, tumor growth, and microbial infection [1–3]. Most
36
of these GAG functions are mediated by the binding to protein
37
effectors such as growth factors and cytokines whose
biolog-38
ical activities are in turn regulated by modulating their
avail-39
ability, stability, structure, and reactivity [3–7]. These
protein-40
GAG interactions are driven at an electrostatic level by the
41
overall sulfation of the GAG chains [4,8], and also by the
42
specific recognition of structural determinants, especially the
43
arrangement of the N- and O-sulfo groups in a given
oligo-44
saccharide sequence, as observed in heparan sulfate (HS) [4,
45
9–12]. These structural elements give rise to the so-called
46
sulfate code that remains to be cracked [13–15]. Other
fea-47
tures, such as epimerization and distribution of sulfated
do-48
mains along the GAG chains, are also involved [10,16–22].
49
Therefore, the study of non-covalent protein-GAG
com-50
plexes has raised increasing interest with the aim of
Electronic supplementary material The online version of this article (https://doi.org/10.1007/s00216-019-02267-2) contains supplementary material, which is available to authorized users.
* Cédric Przybylski
[email protected] * Régis Daniel
Laboratoire Analyse et Modélisation pour la Biologie et l’Environnement
Q1 , Université Paris-Saclay, CNRS, Université Evry, 91025 Evry, France
2
Present address: Institut Parisien de Chimie Moléculaire, IPCM, Sorbonne Université, CNRS, 4 Place Jussieu, 75252 Paris Cedex 05, France
3 Institut de Biologie Structurale, Université Grenoble Alpes, CNRS, CEA, 38000 Grenoble, France
Analytical and Bioanalytical Chemistry https://doi.org/10.1007/s00216-019-02267-2
AUTHOR'S PROOF!
UN
CORRECT
ED
PRO
OF
51 determining the structure of the carbohydrate ligand and
de-52 signing GAG-like drugs targeting these complexes for
poten-53 tial therapeutic applications [23,24]. However, the large
struc-54 tural diversity of GAGs owing to their incomparable variety of
55 combinations and regioselective modifications of their
consti-56 tutive monosaccharides represents a major stumbling block in
57 the study of structure-activity relationships [25]. Furthermore,
58 the biologically active GAG sequences involved in molecular
59 recognition are most often available in low amounts and in
60 heterogeneous mixtures. Because GAG biosynthesis is not
61 template-driven, no procedure is available for the
amplifica-62 tion and the over-expression of a specific oligosaccharide
se-63 quence [3]. Therefore, deciphering the mechanism of the
64 protein-GAG interactions and structural identification of the
65 carbohydrate ligands is both a major scientific goal and a
66 tremendous analytical challenge. In response to the
aforemen-67 tioned bottlenecks, significant progress has been made during
68 the last decade by using mass spectrometry (MS) and MS
69 hyphenated methods, which offer highly sensitive detection
70 and powerful structural resolution [26,27]. We have
previous-71 ly reported the coupling between affinity capillary
electropho-72 resis to mass spectrometry (ACE-MS) as an efficient method
73 for probing protein-GAG interaction [28,29]. ACE-MS
cou-74 pling offers the advantage of requiring a minimal amount of
75 sample for analysis, a definite benefit owing to the low
bio-76 availability of GAG samples. Nevertheless, ACE does not
77 allow multiplexed parallel measurement of interactions, a
ma-78 jor goal in the current “omics” era. In 2002, glycan array
79 approaches were introduced to develop the high-throughput
80 detection of carbohydrate ligands [30–32]. Unlike glycan
ar-81 rays, surface plasmon resonance (SPR) can probe
biomolecu-82 lar interactions at the thermodynamic level and offers the
ad-83 vantages of real-time and label-free measurement of reaction
84 rate constants (kon, koff) from which equilibrium constants
85 (KA, KD) can be deduced [33]. Furthermore, following the
86 pioneering works of Nelson et al. [34,35], the recent
intro-87 duction of SPR in array format provides access to a
88 multiplexed analysis that is of great interest for“omics”
ap-89 proaches, but unfortunately does not give structural
informa-90 tion on the captured ligand(s). In this context, we and others
91 have recently reported the hyphenation of SPR imaging
92 (SPRi) on a biochip in an array format compatible with MS
93 detection [36–38]. The hyphenation of SPRi with MS relies
94 on two well-established stand-alone methods for the analysis
95 of biomolecular interactions and biostructural
characteriza-96 tion, respectively. We have introduced an SPR sensor biochip
97 in a microarray format that is easily interfaced with a MALDI
98 mass spectrometer to carry out a direct on-chip structural
anal-99 ysis by MS. The coupling relies on the functionalization of the
100 biochip surface by a self-assembled monolayer of short
poly(-101 ethylene oxide) chains, which—unlike the commonly used
102 alkane thiol chains—greatly minimize non-specific binding
103 and improve selective isolation and MS detection on the
104
SPR biochip, even for complex biological matrices such as
105
biological fluids [39]. Using this experimental set-up, we
pre-106
viously carried out SPRi-MS coupling for probing
protein-107
protein interactions [36,37]. Affinity-based enrichment and
108
isolation of specific ligands on the SPR biosensor combined
109
with their structural identification by MS also appears a
par-110
ticularly welcome and innovative coupling in glycomics field.
111
Therefore, in the study herein, we have investigated the
po-112
tential of SPRi-MS coupling for the detection and analysis of
113
protein-GAG interactions. To do so, we designed an SPR
114
sensor biochip arrayed with multiple cytokines, providing
ac-115
cess to the thermodynamics parameters of their interactions
116
with HS, heparin (HP) and HP oligosaccharides. This
cyto-117
kine biochip was conveniently interfaced with a MALDI-TOF
118
mass spectrometer so as to achieve a first step towards the
119
structural identification of the captured sulfated GAG ligands.
120
Experimental
121
Materials and reagents
122
O-(2-Carboxyethyl)-O′-(2-mercaptoethyl) heptaethylene
gly-123
col (PEO), N,N′-dicyclohexylcarbodiimide (DCC),
4-124
pyrrolidinopyridine, N-hydroxysuccinimide (NHS),
ammoni-125
um acetate, sodium chloride, L-lysine, dimethyl sulfoxide
126
(DMSO), ammonium acetate, 2-(4-hydroxy-phenylazo)
127
benzoic acid (HABA), and 1,1,3,3, tetramethylguanidine
128
(TMG) were purchased from Sigma-Aldrich (Saint-Quentin
129
Fallavier, France). Heparin (HP,≈ 16,000 g mol−1) and
hepa-130
ran sulfate (HS, ≈ 13,634 g mol−1) were purchased from
131
Celsus Laboratories Inc. (Cincinnati, OH, USA). A mixture
132
of heparin decasaccharides (HPdp10) was purchased from
133
Dextra Laboratories (Reading, UK). Synthetic heparin
penta-134
saccharide Fondaparinux was a gift from Sanofi (France).
135
Aprotinin (average Mw 6517.5375 g mol−1) was purchased
136
from Sigma-Aldrich. Lyophilized recombinant human stromal
137
cell-derived factor-1 (SDF-1α, residue 1-68, average Mw
138
7959.3999 g mol−1, purity ≥ 98%) and recombinant human
139
monocyte chemotactic protein-1 (MCP-1, residue 1-76,
aver-140
age Mw 8680.9987 g mol−1, purity≥ 98%) were obtained
141
from PeproTech (Neuilly-sur-Seine, France). Recombinant
142
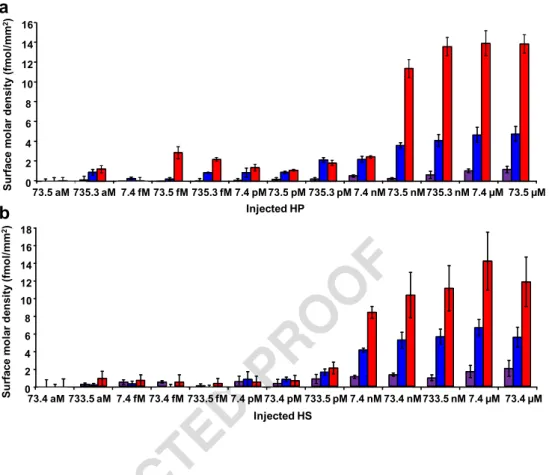
interferon-γ (IFN-γ, residue 1-144, average Mw
143
16,907.3451 g mol−1) in 10 mM Tris buffer pH 6.8 containing
144
10 mg mL−1mannitol was produced as described elsewhere
145
[40]. Other chemicals and reagents were obtained from
com-146
mercial sources at the highest purity available. All buffers
147
were prepared using ultrapure water (Milli-Q, Millipore,
148
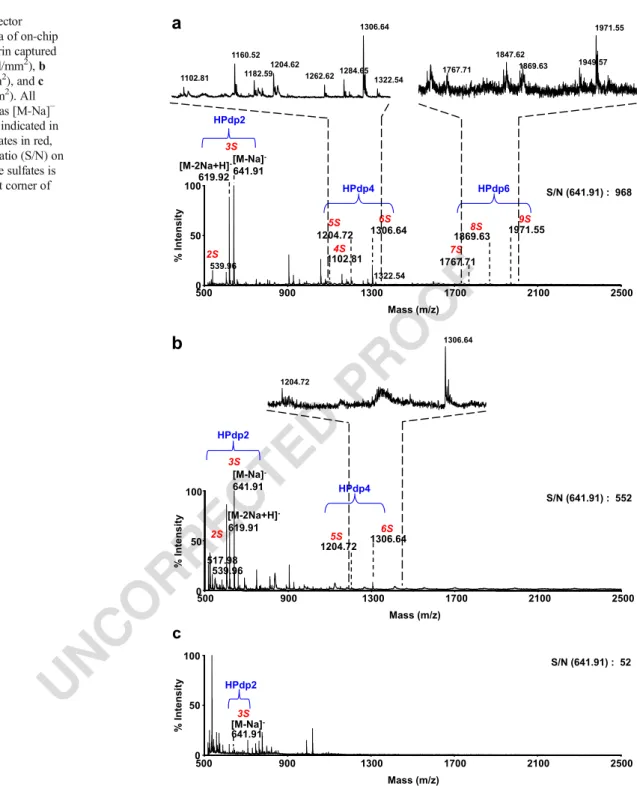
Milford, MA, USA). All heparin lyases (heparinases I, II,
149
and III, 200, 16.39, and 76.92 mU μL−1, respectively, and
150
conditioned in 0.2% bovine serum albumin) were purchased
151
form Grampian Enzymes (Aberdeen, Scotland, UK).
Przybylski C. et al.
UN
CORRECT
ED
PRO
OF
152
Working protein solutions
153 Commercial solutions of heparinases I, II, and III were diluted
154 at 5 mUμL−1, 4.09 mUμL−1, and 3.125 mUμL−1,
respec-155 tively, in 20 mM Tris-HCl, pH 7.2, and stored at− 80 °C until
156 use. Just prior to digestion, heparinase I was diluted to
157 100 mU mL−1), and heparinases II and III to 50 mU mL−1in
158 2 mM PBS, 0.6 mM CaCl2, pH 7.3. Aprotinin, SDF-1α,
159 MCP-1, and IFN-γ were diluted to 75 μM in 75 mM
ammo-160 nium acetate, pH 6.5, 3μL (aprotinin, SDF-1α, MCP-1) or
161 5μL (IFN-γ) aliquots were stored at − 80 °C until use.
162
SPRi instrument
163 SPR imaging (SPRi) experiments were performed using
164 the SPRi-Plex imager (instrument control and reporting
165 by SPRi-View and SPRi-Analysis software suite, Horiba
166 Scientific, Palaiseau, France) equipped with a 660-nm
167 light-emitting diode (LED), a hexagonal flow cell
168 thermostated at 25 °C, an online degasser, and a
charge-169 coupled-device (CCD) camera. SPRi measurements were
170 performed using gold-covered glass slides (28 mm ×
171 12 mm, 0.5-mm thickness, chromium bonding layer 1–
172 2 nm, gold layer 50 nm) purchased from SCHOTT-AG
173 (Mainz, Germany) assembled onto a glass prism (thickness
174 8 mm) from Horiba Scientific (Palaiseau, France). The
op-175 tical continuity at their interface was ensured by an oil
176 layer of suitable refractive index, as described elsewhere
177 [36].
178
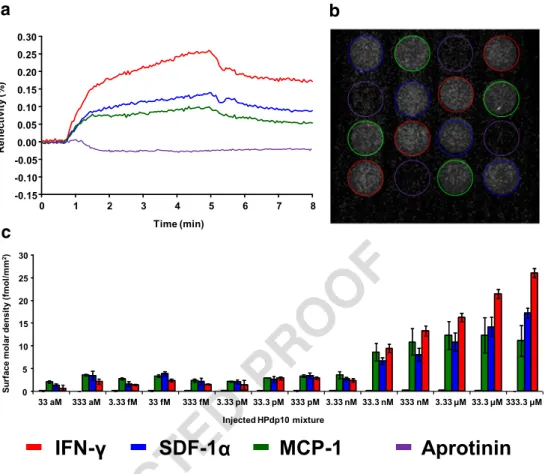
SPRi and SPRi-MS coupling experiments
179 SPRi experiments were performed in the running buffer
180 10 mmol L−1ammonium acetate, pH 7.5, at 50μL min−1flow
181 rate. A typical SPR experiment comprised an injection step
182 (4 min) and a dissociation step (4 min) run sequentially for a
183 total run-time of 8 min. A regeneration step was carried out by
184 injection of 1 mol L−1 NaCl for 8 min between each SPRi
185 experiment. This procedure enabled repeated (at least 20
186 times) SPR experiments on the same biochip with signal loss
187 of < 3%. For SPRi-MS coupling experiments, the biochip was
188 removed from the glass prism after SPRi measurements to
189 enable direct on-chip MS analysis (see below). The
polysac-190 charides HP, HS, and oligosaccharides HPdp10 and
191 Fondaparinux were injected using a 200-μL sample loop
in-192 jection. They were diluted in the running buffer from 1 to
193 1000 or 1176μg mL−1for HP and HS, respectively and from
194 1 fg mL−1to 1 mg mL−1and 1 pg mL−1to 1 mg mL−1for
195 HPdp10 and Fondaparinux, respectively. Affinity constants
196 and kinetics rate were determined by using ScrubberGen
soft-197 ware (V1.0, Horiba Scientific, Palaiseau, France).
198
Surface functionalization of biochips
199
The biochip surface was cleaned using a UV–ozone treatment
200
(UVO-Cleaner, Jelight, CA, USA) before functionalization. A
201
self-assembled monolayer (SAM) formed of a short
poly(eth-202
ylene oxide) chains was grafted on the gold surface of the
203
biochips by immersion in ethanol solution of 2.5 mmol L−1
204
O-(2-carboxyethyl)-O′-(2-mercaptoethyl) heptaethylene
gly-205
col for 6 h. The grafted biochips were then washed with
eth-206
anol and could be either stored at 4 °C or activated for the
207
immobilization of protein probes. The SAM was activated
208
through 1 h incubation with 0.2 mol L−1 DCC and
209
0.2 mol L−1 NHS in DMSO containing 0.02 mol L−1
4-210
pyrrolidinopyridine. After washing with DMSO and ultrapure
211
water, the activated biochips were air-dried and stored at 4 °C,
212
ready for the covalent attachment of chemokines.
213
Cytokine attachment on biochips
214
Before immobilization on the biochip, the 75μM chemokine
215
solution in 75 mM ammonium acetate, pH 6.5 was evaporated
216
and re-suspended in the same volume of 10 mM ammonium
217
acetate pH 7.5, 1% (v/v) glycerol. The activated biochip was
218
then arrayed with this 75μM chemokine solution by dropping
219
0.1–0.15 μL per spot. The spot-array pattern (4 × 4) was
220
500-μm diameter spots with a 3.5-mm inter-spot distance.
221
Inactivation of the remaining free ester active groups on the
222
biochip surface was performed by injecting 100μM lysine in
223
10 mM ammonium acetate, pH 7.5, for 2 × 10 min
224
(50μL min−1 flow). Each injection of lysine was followed
225
by an injection of 100μM glycine, pH 2 at a 50 μL min−1
226
flow rate for 10 min. Reflectivity variation (RV) was
mea-227
sured on each spot and converted into bound ligand quantities
228
per surface unit (0.02% of RV = 5 pg/mm2[41]. Nevertheless,
229
obtained values were for protein/DNA according to equation
230
S1(Electronic Supplementary Material (ESM)), whereas the
231
heparin-based saccharides studied here required a lower
re-232
fractive index (0.13 instead of 0.19). The values of bound
233
amounts were corrected accordingly (% of RV × 1.46) [42].
234
The density values were averaged over all spots of the same
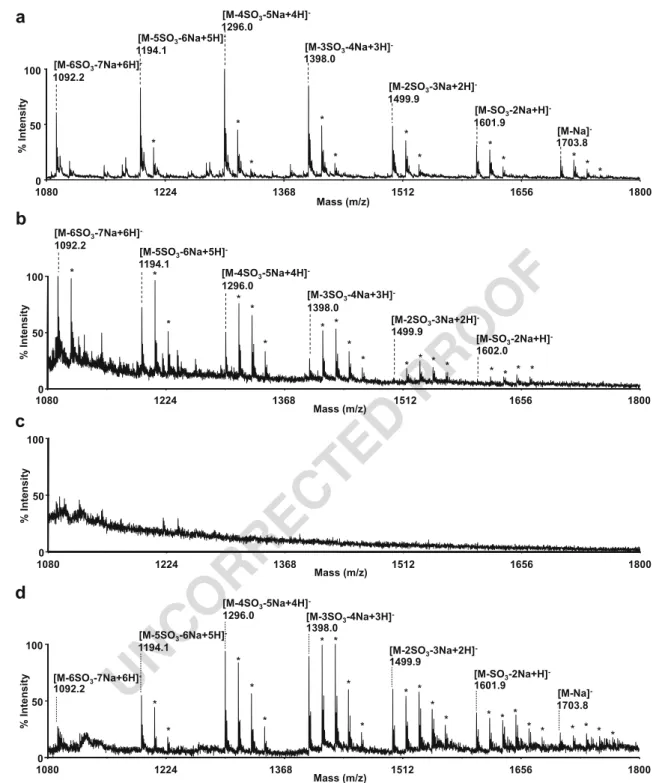
235
species, after subtraction of a negative control. Sensorgrams
236
were acquired on each cytokine spot by subtraction of the SPR
237
signal recorded on the lysine passivated biochip surface. A
238
constant spot diameter of 300 μm was used for captured
239
amount calculation.
240
On-chip digestion
241
After SPRi detection and GAG capture, the SPRi biochip was
242
removed from the SPRi-Plex imager and the gold surface was
243
air-dried. Then, on-chip depolymerization of affinity-captured
244
GAG polysaccharides was performed by dropping heparinase
245
solutions on each spot. HP depolymerization was carried out
AUTHOR'S PROOF!
UN
CORRECT
ED
PRO
OF
246 with 0.5μL of heparinase I working solution (50 μU spotted).
247 HS depolymerization was carried out with 0.2μL of
hepari-248 nase I working solution (20μU spotted) and 0.4 μL of
hepa-249 rinase II and III working solutions (each 20μU spotted).
250 Then, the on-chip depolymerization reaction was conducted
251 at 25 °C overnight by arranging the biochip in a Petri dish with
252 a plastic cup to maintain a moist environment, and placed in a
253 forced air oven.
254
On-chip mass spectrometry analysis
255 MALDI-time-of-flight (TOF) MS experiments were
per-256 formed using a PerSeptive Biosystems Voyager-DE STR
257 mass spectrometer (Applied Biosystems/MDS SCIEX,
258 Foster City, CA, USA) equipped with a nitrogen laser
259 (337 nm wavelength and 20 Hz repetition rate, laser fluence
260 set just above the desorption/ionization threshold). The
261 HABA/TMG2ionic liquid, used as the matrix, was prepared
262 as described elsewhere [43–45]. Briefly, HABA was mixed
263 with TMG at a 1:2 molar ratio in methanol, and the obtained
264 solution was sonicated for 15 min at 40 °C. After removing
265 methanol by centrifugal evaporation in a SpeedVac for 3 h at
266 room temperature, the ionic liquid matrix was left under
vac-267 uum overnight. Final solutions were then prepared at a
con-268 centration of 90 mg mL−1in methanol, and used as a matrix
269 without further purification. Once prepared, these ionic liquid
270 matrix solutions (ILMs) can be stored at 4 °C for up to 1 week.
271 Then, 0.4μL of the ILM was spotted on the biochip and left to
272 dry at room temperature and atmospheric pressure for 5 min.
273 MALDI-TOF MS analysis was performed in the linear and
274 reflector negative ion modes. In linear mode, the acceleration
275 voltage was + 25 kV, grid voltage was 95%, and extraction
276 delay was 300 ns. In reflector mode, the acceleration voltage
277 was + 20 kV, grid voltage was 70%, and extraction delay was
278 150–300 ns. Each mass spectrum was an average of 200–900
279 laser shots.
280
Results and discussion
281
MS detection of heparin and heparan sulfate
282
on cytokine surface plasmon resonance biochips
283 We previously implemented functionalized SPR biochips to
284 hyphenate SPRi analysis with mass spectrometry [36,37].
285 This innovative SPRi-MS coupling can be combined with
286 on-chip enzyme digestion of the captured biomolecule to
at-287 tain fine structural characterization using MS. Unfractionated
288 HP and HS solutions ranging from sub-nanomolar to
micro-289 molar concentrations were flowed on the SPR biochip
de-290 signed for MS coupling and arrayed with the cytokines
291 IFN-γ, SDF-1α. Because these cytokines are basic proteins
292 (pI> 9) [28,46], aprotinin (pI 10.5) was also grafted on the
293
biochip as a control basic protein. Typical sensorgrams were
294
obtained, showing strong interactions of IFN-γ and SDF-1α
295
with both sulfated polysaccharides (Fig.1), while the negative
296
control aprotinin showed a weak interaction (KD= 873 ±
297
30μM), consistent with the HP-binding properties of these
298
cytokines. KDvalues (KD= koff/kon) were determined in the
299
nanomolar range for both cytokines (Table1), corroborating
300
data in the literature for IFN-γ (1.4–5 nM) [8, 47] and for
301
SDF-1α (1–30 nM) [48–50]. The affinity of IFN-γ and
302
SDF-1α was slightly higher for HS than for HP (Table 1),
303
despite the higher sulfate content of HP, indicating that
inter-304
action is not solely charge driven. The interaction likely
in-305
volves specific sequences within HS, keeping in mind that HS
306
is a physiological ligand of cytokines at the cell surface and in
307
the extracellular matrix. In order to determine the GAG
mol-308
ecules captured on the biochip surface, the arrayed surface of
309
the cytokine biochip was probed using MALDI-TOF MS after
310
the SPR experiment.
311
However, due to their high and disperse molecular weights
312
and negative charge density, the whole HP and HS molecules
313
(13.6–16 kg mol−1) cannot be analyzed as such by MS. To
314
overcome such limitations, we performed on-chip
depolymer-315
ization of captured GAGs using heparinase I or a mixture of
316
heparinase I, II, and III (see“Methods”). Afterwards, the chip
317
was directly analyzed using MALDI-TOF MS to carry out
on-318
chip detection of the oligosaccharides produced by enzyme
319
digestion. The capture of GAG molecules by the grafted
cy-320
tokines IFN-γ and SDF-1α increased with the increasing
con-321
centrations of HP and HS loaded on the chip during the SPR
322
experiment, reaching a maximal surface density of several
323
fmol/mm2for both HP and HS (Fig.2).
324
Considering that 1 mol of HP polysaccharide can theoretically
325
yield on average 25 mol of trisulfated HPdp2 based on the
mo-326
lecular weight of the full-size heparin, it is expected that the
327
amount of captured HS is enough to produce several dozen of
328
fmol/mm2of sulfated disaccharides. MALDI-TOF-MS analysis
329
revealed the presence of heparin hexa-, tetra-, and disaccharides
330
captured on IFN-γ spots. No oligosaccharide was detected on the
331
surface biochip without grafted cytokines (background area,
332
ESM Fig. S1). The HP disaccharide was detected in its fully
333
trisulfated form (sodiated ions [M-Na]− at m/z 641.91 and
334
[M-2Na + H]−atm/z 619.91) (Fig.3a, b). The disulfated
disac-335
charide was also detected as [M-Na]−atm/z 539.96 and at trace
336
amounts as [M-2Na + H]−atm/z 517.98. The fully sulfated HP
337
tetrasaccharide was identified atm/z 1306.64 [M-Na]−, as well as
338
the penta- and tetrasulfated forms atm/z 1204.72 and 1102.81,
339
respectively. Hexasaccharides were the highest detected dp under
340
the fully sulfated form (9 sulfate groups) as [M-Na]− atm/z
341
1971.55, as well as with 8 and 7 sulfate groups atm/z 1869.63
342
and 1767.71, respectively. Regarding the aprotinin spot, a unique
343
peak of trisulfated HPdp2 was present (Fig.3c). Some minor ions
344
showing Na+/K+exchanges were also detected. The control
ex-345
periment in which digested heparin was manually spotted on a
Przybylski C. et al.
UN
CORRECT
ED
PRO
OF
346 SPRi biochip without grafted cytokines, yielded mainly
347 trisulfated disaccharides (ESM Fig.S2). This result suggests that
348 the tetra- and hexasaccharides detected on the cytokine plots are
349 protected from heparinase through tight protein-GAG
interac-350 tions. These oligosaccharides may thus be part of the heparin
351 sequences that are specifically involved in the cytokine binding
352 (Fig.3). In contrast, we were unable to detect highly sulfated
di-353 and tetra-oligosaccharides from HS molecules captured on
354 IFN-γ and SDF-1α spots. Although somewhat lower than the
355 captured HP level, the amount of captured HS was still sufficient
356 to allow MS detection of derived oligosaccharides.
357 Heparinase I exhibits a strong specificity for the
-GlcNS6S-358 IdoA2S- linkage [51]. This saccharide sequence being less
359 encountered in HS, the on-chip depolymerization of HS
360
molecules catalyzed by heparinase I likely produced a lower
361
proportion of highly sulfated di- and tetra-saccharides, and a
362
higher proportion of longer oligosaccharides that are more
363
difficult to detect by MS.
364
Direct on-chip MS detection of heparin
365
oligosaccharide ligands
366
The SPR-MS experiment was further pursued by loading HP
367
decasaccharides (HPdp10) on a cytokine biochip. Given that
368
this commercial HPdp10 preparation was specified to contain
369
a high level of the disaccharide unit IdoUA,2S-GlcNS,6S, it
370
may be a valuable mimic of the sulfated NS domains of HS
371
(the so-called NS domains), which are well known to be
-0.05 0.05 0.15 0.25 0.35 0.45 0.55 0 1 2 3 4 5 6 7 8 yti vit c elf e R( % ) Time (min) -0.05 0.05 0.15 0.25 0.35 0.45 0.55 0.65 0 1 2 3 4 5 6 7 8 Time (min) yti vit c elf e R( % )
c
a
d
b
IFN- SDF-1 Aprotinin Fig. 1 Surface-subtracted sensorgrams for the interaction between cytokines and a heparin injected at 1 mg mL−1(≈ 73.5μM) or c heparan sulfate injected at 1 mg mL−1(≈ 73.4μM). Each sensorgram is an average of SPR measurements taken on four spots.Corresponding real-time array imaging of the interaction between grafted chemokines and injected b heparin and d heparan sulfate at 7 min in the
aforementioned conditions
t1:1 Table 1 Kinetic and thermodynamic parameters of the interactions between cytokines and heparin (HP)/heparan sulfate (HS) glycosaminoglycans (GAGs)
t1:2 GAGs Cytokine Surface density (fmol mm−2)
kon(M−1s−1) koff(s−1) KD= koff/kon(M) ΔG* (kJ mol−1)
t1:3 HP SDF-1α 5 ± 1 6.6 ± 0.2 × 10⁵ 5.9 ± 0.3 × 10⁻⁴ 9.0 ± 0.5 × 10⁻⁹ − 45.90 ± 0.06 t1:4 IFN-γ 14 ± 1 6.7 ± 0.3 × 10⁵ 7.4 ± 0.2 × 10⁻⁴ 11.1 ± 0.4 × 10⁻⁹ − 45.38 ± 0.04 t1:5 HS SDF-1α 5 ± 1 3.3 ± 0.2 × 10⁵ 13.2 ± 0.3 × 10⁻⁴ 4.0 ± 0.2 × 10⁻⁹ − 47.91 ± 0.05 t1:6 IFN-γ 12 ± 3 4.8 ± 0.2 × 10⁵ 29.3 ± 0.5 × 10⁻⁴ 6.1 ± 0.2 × 10⁻⁹ − 46.87 ± 0.03 *ΔG = RT ln KDwhere R is the gas constant = 8.3144621 J mol−1K−1 and T is 298 K (25 °C). Binding kinetics fitted using a 1:1 Langmuir model. Values were the average of 4 determinations
AUTHOR'S PROOF!
UN
CORRECT
ED
PRO
OF
372 involved in the interactions of HS with various cytokines [21].
373 Accordingly, sensorgrams depicted a significant capture of
374 GAGs molecules, which increased with rising concentrations
375 of injected HPdp10, from 33.3 nM to 333.3μM (Fig.4c). The
376 three cytokines showed similar off-rates, close to the koff
377 values obtained for HP/HS (21.2–30.6 × 10⁻⁴s−1versus 5.9–
378 7.4 × 10⁻⁴/13.2–29.3 × 10−4 s−1), while their binding rates
379 were slightly lower than that to HP/HS polysaccharides
380 (Table2). As a result, the increased KD values indicated a
381 somewhat lowered affinity for HPdp10 in comparison with
382 HP/HS polysaccharides, but these values still remained in
383 the sub-micromolar range (Table2). Although the koff, kon,
384 and KD values obtained for HPdp10 account for various
385 dp10 chains in the decasaccharide preparation, they provide
386 a meaningful averaged portray of the mixture.
387 An additional injection following the highest HPdp10
con-388 centration (333.3μM) did not induce a further increase of
re-389 flectivity, indicating that all interaction sites were occupied and
390 maximal interaction had been reached. It corresponded to a
391 maximal surface density of several fmol/mm2of captured
392 HPdp10 (Fig. 4c). The arrayed biochip surface was probed
393 using MALDI-TOF MS to detect captured HPdp10. To allow
394 detection of these high-polymerization-degree oligosaccharides
395 at the highest sensitivity, MS analysis was carried out in linear
396 mode.
397 Under these conditions, direct deposits of HPdp10 on the
398 chip indicated that around 25 fmoles were required to yield a
399
spectrum exhibiting ions ascribed to HPdp10 oligosaccharides
400
(Fig.5a).
401
It may explain that we were unable to detect any
oli-402
gosaccharides on the MCP-1 and SDF-1α spots, given the
403
lower amount of captured oligosaccharides. On the other
404
hand, a wide range of ions ascribed to the HPdp10
oligo-405
saccharides mixture was detected on IFN-γ plots in
agree-406
ment with about 25 fmol of captured oligosaccharides
407
(Fig. 5b). When HPdp10 was directly deposited on the
408
biochip, ions were detected along a Gaussian distribution
409
from m/z 1765.4 to m/z 2173.7 and centered on m/z
410
1867.5 (Fig. 5a). This ion distribution matches that of a
411
decasaccharide population carrying from 1 to 5 sulfate
412
groups and centered around m/z 1800–1900
correspond-413
ing to disulfated species. By comparison, the spectrum
414
obtained from IFN-γ spots showed the selective
enrich-415
ment of more sulfated oligosaccharides centered around
416
m/z 2100–2200. The absence of a single captured
417
decasaccharide species shows that interaction between
418
IFN-γ and HPdp10 does not occur with only one given
419
structure. IFN-γ, and possibly MCP-1 and SDF-1α, can
420
thus bind several HPdp10 exhibiting various sulfation
pat-421
terns. Even if the precise structural determinants involved
422
in specific interactions could not be determined, our
re-423
sults indicate a preferential affinity for the more sulfated
424
heparin chains. Nonetheless, the present results confirm
425
the validity of the SPRi-MS coupling for on-chip analysis
73.5 aM 735.3 aM 7.4 fM 73.5 fM 735.3 fM 7.4 pM 73.5 pM 735.3 pM 7.4 nM 73.5 nM735.3 nM 7.4 µM 73.5 µM e c af r u Sm o la r yti s n e d( fm o l/m m 2) Injected HP 0 2 4 6 8 10 12 14 16 Injected HS 733.5 aM 7.4 fM 733.5 pM 7.4 nM 73.4 nM733.5 nM 7.4 µM 73.4 µM 73.4 aM 73.4 fM 733.5 fM 7.4 pM 73.4 pM 0 2 4 6 8 10 12 14 16 18 e c af r u S mo la r yti s n e d( fm o l/ m m 2)
b
a
Fig. 2 Surface molar density of GAG polysaccharides captured by immobilized proteins IFN-γ (red), SDF-1α (blue), and aprotinin (violet) according to the injected concentrations of a heparin (HP) and b heparan sulfate (HS). Error bars correspond to four different spots on the same biochip
Przybylski C. et al.
UN
CORRECT
ED
PRO
OF
426 of GAG ligands after their capture by immobilized
cyto-427 kines, and indicate that captured sulfated oligosaccharides
428 of polymerization degrees higher than dp2 can be directly
429 detected.
430
Interaction of the synthetic pentasaccharide
431
Fondaparinux on the cytokine SPR biochips
432 To further exemplify the SPRi-MS coupling on cytokine
bio-433 chip, an oligosaccharide with a well-defined sequence was
434
used. For that purpose, we studied the interaction of the
syn-435
thetic pentasaccharide Fondaparinux with the immobilized
436
cytokines. This compound is the sole marketed synthetic
437
GAG mimetic (Arixtra®) used as an antithrombotic agent
438
targeting antithrombin and thereby inhibiting proteases such
439
as the activated factor X (FXa). This pentasaccharide has eight
440
sulfate groups, including a rare 3-O sulfo group on the central
441
glucosamine residue. Fondaparinux was designed to bind
an-442
tithrombin with high affinity [52]. It can also bind MCP-1 [53,
443
54], but no data are available for SDF-1α or IFN-γ. SPRi
2S HPdp4 5S 4S 6S HPdp6 9S 8S 7S HPdp2 3S 3S 2S HPdp4 5S 6S HPdp2 3S HPdp2 500 900 1300 1700 2100 2500 Mass (m/z) 0 50 100 % y ti s n et nI 1306.64 539.96 1204.72 1102.81 1971.55 1767.71 1869.63 641.91 619.92 [M-Na] -[M-2Na+H] -S/N (641.91) : 968 500 900 1300 1700 2100 2500 Mass (m/z) 0 50 100 % y ti s n et nI 641.91 619.91 517.98 539.96 1306.64 1204.72 [M-Na] -[M-2Na+H] -S/N (641.91) : 552 1322.54
b
a
500 900 1300 1700 2100 2500 Mass (m/z) 0 50 100 % y ti s n et nI 641.91 [M-Na] -S/N (641.91) : 52c
1306.64 1160.52 1204.62 1284.65 1182.59 1262.62 1102.81 1322.54 1971.55 1949.57 1767.71 1847.62 1869.63 1306.64 1204.72 1263.10Fig. 3 Negative reflector MALDI-TOF spectra of on-chip depolymerized heparin captured by a IFN-γ (14 fmol/mm2), b SDF-1α (5 fmol/mm2), and c aprotinin (1 fmol/mm2). All species are detected as [M-Na]− and size of the dp is indicated in blue, number of sulfates in red, and signal-to-noise ratio (S/N) on the HPdp2 with three sulfates is noted in the top right corner of each spectrum
AUTHOR'S PROOF!
UN
CORRECT
ED
PRO
OF
444 analysis confirmed the high affinity of MCP-1 for the
synthet-445 ic pentasaccharide and also revealed a strong interaction with
446 IFN-γ and SDF-1α (Fig.6).
447 The obtained sensorgrams yielded nanomolar KD(Table2)
448 in the range of previously reported values for other
high-449 affinity HP-binding proteins [4, 8,47–49, 55–64]. The KD
450 value for SDF-1α was much lower than those determined
451 for HPdp10, and almost in the same range as the KDvalues
452 for HP/HS polysaccharides, underlining that a specific
ar-453 rangement in a well-defined sequence, even in a short chain,
454 can govern and induce the formation of a tight complex with
455 SDF-1α. These productive sequences are likely sparse in
456 HPdp10, which may explain the decreased affinity for this
457 oligosaccharides mixture. In contrast, IFN-γ showed a quite
458
similar affinity for both HPdp10 and the synthetic
pentasac-459
charide Fondaparinux, although somewhat higher for the
pen-460
tasaccharide. This result suggests that IFN-γ can form an
af-461
finity complex either with a short sequence comprising unique
462
structural determinants, or with heterogeneous, but longer
ol-463
igosaccharide sequences. Several fmol mm−2of synthetic
pen-464
tasaccharide were captured upon injection of increasing
con-465
centrations of Fondaparinux, leveling out at values ranging
466
from 13 for SDF-1α to 28 fmol mm−2for IFN-γ (Table2).
467
When 20 fmoles of pentasaccharide were directly spotted in
468
the running buffer on the biochip, the pentasaccharide could
469
be detected as an intact, fully sulfated species [M-Na]−atm/z
470
1703.8, in addition to ions corresponding to a pentasaccharide
471
species with sulfate loss (− 102 mass units) (Fig.7a). The
33 aM 333 aM 3.33 fM 33 fM 333 fM 3.33 pM 33.3 pM 333 pM 3.33 nM 33.3 nM 333 nM 3.33 µM 33.3 µM 333.3 µM Injected HPdp10 mixture e c af r u S r al o my ti s n e d ( l o mf/ m m 2) 0 5 10 15 20 25 30 -0.15 -0.10 -0.05 0.00 0.05 0.10 0.15 0.20 0.25 0.30 0 1 2 3 4 5 6 7 8 yti vit c elf e R (% ) Time (min)
IFN-
SDF-1
MCP-1
Aprotinin
a
b
c
Fig. 4 a Surface-subtracted sensorgrams for the interaction between chemokines and a heparin decasaccharides mixture (HPdp10) injected at 1 mg mL−1 (≈ 333.3 μM). Each sensorgram is the average of SPR measurements taken on four spots. bCorresponding real-time array imaging of the interaction between grafted chemokines and injected HPdp10 at 7 min in the aforementioned conditions. c Surface molar density progression of captured HPdp10. Error bars correspond to four different spots on the same biochip
t2:1 Table 2 Kinetic and thermodynamic parameters of the interactions between cytokines and heparin-derived sulfated oligosaccharides
t2:2 GAGs Cytokine Surface density (fmol/mm2) kon(M−1s−1) koff(s−1) KD= koff/kon(M) ΔG* (kJ mol−1) t2:3 HPdp10 SDF-1α 17 ± 1 2.3 ± 0.4 × 10⁴ 30.6 ± 0.5 × 10⁻⁴ 133 ± 5 × 10⁻⁹ − 39.23 ± 0.04 t2:4 MCP-1 11 ± 3 2.2 ± 0.2 × 10⁴ 21.2 ± 0.3 × 10⁻⁴ 96 ± 4 × 10⁻⁹ − 40.04 ± 0.04 t2:5 IFN-γ 25 ± 1 1.9 ± 0.4 × 10⁵ 26.7 ± 0.6 × 10⁻⁴ 14 ± 1 × 10⁻⁹ − 44.81 ± 0.07 t2:6 Fondaparinux SDF-1α 13 ± 1 5.2 ± 0.3 × 10⁵ 15.6 ± 0.5 × 10⁻⁴ 3.0 ± 0.2 × 10⁻⁹ − 48.62 ± 0.07 t2:7 MCP-1 17 ± 5 13.3 ± 0.1 × 10⁵ 31.9 ± 0.3 × 10⁻⁴ 2.4 ± 0.1 × 10⁻⁹ − 49.20 ± 0.04 t2:8 IFN-γ 28 ± 5 7.3 ± 0.5 × 10⁶ 87.6 ± 0.6 × 10⁻⁴ 1.2 ± 0.1 × 10⁻⁹ − 50.89 ± 0.08 *ΔG = RT lnKDwhere R is the gas constant = 8.3144621 J mol−1K−1 and T is 298 K (25 °C). Binding kinetics fitted using a 1:1 Langmuir model. Values were the average of 4 determinations
Przybylski C. et al.
UN
CORRECT
ED
PRO
OF
0 5 10 15 20 25 30 35 579 fM 5.79 pM 57.9 pM 579 pM 5.9 nM 57.9 nM 579 nM 5.79 µM 57.9 µM 579 µM Injected Fondaparinux e c af r u Sr al o m yti s n e d( l o mf/ m m 2)IFN-
SDF-1
MCP-1
Aprotinin
-0.05 0.00 0.05 0.10 0.15 0.20 0.25 0.30 0.35 0 1 2 3 4 5 6 7 8 yti vit c elf e R (% ) Time (min)a
b
c
Fig. 6 a Surface-subtracted sensorgrams for the interaction between chemokines and Fondaparinux injected at 1 mg mL−1(≈ 579 μM). Each sensorgram results from the averaged SPR measurements on four spots. b Corresponding real-time array imaging of the interaction between grafted cytokines and injected Fondaparinux at 7 min in the aforementioned conditions. c Surface molar density progression of captured Fondaparinux. Error bars correspond to four different spots on the same biochip1500 1860 2220 2580 2940 3300 Masse (m/z) 0 50 100 % yti s n et nI 2173.7 2275.6 2377.8 2479.8 2582.0 2071.6 [M-2Na+H]-(9S, 14Na) [M-2Na+H]-(8S, 13Na) [M-2Na+H]-(7S, 12Na) [M-2Na+H]-(6S, 11Na) [M-2Na+H]-(5S, 10Na) [M-2Na+H]-(4S, 9Na) 1500 1860 2220 2580 2940 3300 Masse (m/z) 0 50 100 %y ti s n et nI 1969.6 2173.7 2071.6 1867.5 1763.4 [M-2Na+H]-(5S, 10Na) [M-2Na+H]-(4S, 9Na) [M-2Na+H]-(1S, 6Na) [M-2Na+H]-(3S, 8Na) [M-2Na+H]-(2S, 7Na)
b
a
Fig. 5 Negative linear MALDI-TOF spectrum of HPdp10 mixture a directly deposited at 25 fmol on the chip and b after capture of 25 fmol mm−2by IFN-γ
AUTHOR'S PROOF!
UN
CORRECT
ED
PRO
OF
472 signal-to-noise ratio of mass spectra gradually declined from
473 the IFN-γ to the ΜCP-1 and SDF-1α spots, in parallel to a
474 concomitant decrease in the surface density (28, 17, and 13
475 fmol/mm2, respectively). Intact or partially desulfated
penta-476 saccharide species were not detected on the SDF-1α spots
477 (Fig.7c), likely due to the lower captured amount (13 fmol
478 mm−2). On the other hand, the intact pentasaccharide [M-Na]−
479 was observed on the IFN-γ spots (Fig. 7d), while only
480
partially sulfated species with 1 to 6 sulfate losses were
de-481
tected on the MCP-1 spots (Fig.7b). The non-detection of
482
intact pentasaccharide on MCP-1 spots can be due to an
in-483
sufficient amount captured and less efficient energy
dissipa-484
tion during laser shots while soft ionic liquid matrix was used.
485
The on-chip MS detection was easier for Fondaparinux than
486
for HPdp10, although both were captured at similar surface
487
densities. This difference highlights that, in addition to the low
1080 1224 1368 1512 1656 1800 Mass (m/z) 0 50 100 % y ti s n et nI 1296.0 1398.0 1499.9 1194.1 1601.9 1092.2 1703.8 * * * * * * * * * * * * [M-Na] -[M-SO3-2Na+H] -[M-2SO3-3Na+2H] -[M-3SO3-4Na+3H] -[M-6SO3-7Na+6H] -[M-5SO3-6Na+5H] -[M-4SO3-5Na+4H] -1080 1224 1368 1512 1656 1800 Mass (m/z) 0 50 100 % y ti s n et nI 1296.0 1398.0 1499.9 1194.1 1602.0 1092.2 [M-SO3-2Na+H] -[M-2SO3-3Na+2H] -[M-3SO3-4Na+3H] -[M-6SO3-7Na+6H] -[M-5SO3-6Na+5H] -[M-4SO3-5Na+4H] -* -* -* -* * * * * * * * * * * * * * * 1080 1224 1368 1512 1656 1800 Mass (m/z) 0 50 100 % y ti s n et nI 1080 1224 1368 1512 1656 1800 Mass (m/z) 0 50 100 % y ti s n et nI 1296.0 1398.0 1499.9 1194.1 1601.9 1092.2 1703.8 * * * * * * * * * * * * * * * * * * * * * * [M-Na] -[M-SO3-2Na+H] -[M-2SO3-3Na+2H] -[M-3SO3-4Na+3H] -[M-6SO3-7Na+6H] -[M-5SO3-6Na+5H] -[M-4SO3-5Na+4H]
-b
a
d
c
Fig. 7 Negative reflector MALDI-TOF spectra of Fondaparinux a directly deposited at 20 fmoles on the chip and after captures by b MCP-1, c SDF-1α, and d IFN-γ after injection of 579 μM Fondaparinux. Asterisks correspond to Na+/K+exchanges
Przybylski C. et al.
UN
CORRECT
ED
PRO
OF
488 amount and the size of oligosaccharides, the heterogeneity of
489 the oligosaccharide mixture can be also an important limiting
490 factor for the MALDI-TOF analysis.
491
Conclusion
492 The hyphenation of SPR with MS relies on two
well-493 established stand-alone methods that enable the analysis of
494 biomolecular interactions and biostructural characterization,
495 r e s p e c t i v e l y. We h a v e p r e v i o u s l y d e v e l o p e d t h e
496 functionalization of SPRi biochips with a self-assembled
497 monolayer of short poly(ethyleneoxide) chains carrying a
ter-498 minal NHS group that is well-suited for SPRi-MS coupling,
499 and useful for efficient on-chip MALDI MS detection.
SPRi-500 MS coupling having been initially applied to the study of
501 protein-protein interactions, this study significantly extends
502 proof of concept to the analysis of protein-carbohydrate
inter-503 actions. This study reports for the first time the
implementa-504 tion of SPRi-MS coupling analysis of interactions between
505 GAGs and relevant cytokines, showing a new road for
prob-506 ing biomolecular interactions involving GAGs. This approach
507 made it possible to detect and quantify the formation of
com-508 plexes between HP and HS oligo/polysaccharides and
509 immobilized chemokines, and shows its potential to achieve
510 the direct on-chip MS detection of GAG ligands through their
511 selective capture. As in proteomics, we demonstrated the
fea-512 sibility of performing an efficient on-chip enzymatic digestion
513 of captured polysaccharides for easier and more detailed MS
514 identification. In this study, SPRi-MS analysis was conducted
515 on manually deposited 12 or 16 spots per biochip, and work is
516 in progress to use similar chips with an automatic arrayer
517 allowing a more reproducible and higher density spotting.
518 Still, the limitations of the SPRi-MS coupling identified in this
519 study require further efforts. The amounts of captured GAG
520 molecules are enough for SPRi detection but are too low in
521 some case for an easy MS detection. Modifications of the
522 surface self-assembled monolayer and a controlled orientation
523 of the immobilized protein are currently under investigation to
524 get a higher density of grafted chemokine. The partial loss of
525 sulfate that sometime occurs upon laser irradiation may
pre-526 vent the determination of the optimal sulfation level preferred
527 by each chemokine. Probing the biochip surface with a softer
528 ionization method like DESI coupled to LTQ-Orbitrap will be
529 an attractive alternative [65, 66]. The GAGomics field still
530 requires new analytical tools for further study of
protein-531 GAG interactions and for the discovery of potential
com-532 pounds targeting these complexes. All the analytical features
533 of the SPRi-MS coupling reported here, including multiplexed
534 detection of interaction partners, specific capture of GAG
li-535 gands, and on-chip MS characterization thus appear very
536 promising for GAGomics and more largely in glycobiology.
537
Compliance with ethical standards
538
Conflict of interest The authors declare that there are no conflicts of
539
interest.
540
References
541
1. Bishop JR, Schuksz M, Esko JD. Heparan sulphate proteoglycans
542
fine-tune mammalian physiology. Nature. 2007;446:1030–7.
543
2. Linhardt RJ, Toida T. Role of glycosaminoglycans in cellular
com-544
munication. Acc Chem Res. 2004;37:431–8.
545
3. Sasisekharan R, Raman R, Prabhakar V. Glycomics approach to
546
structure-function relationships of glycosaminoglycans. Annu Rev
547
Biomed Eng. 2006;8:181–31.
548
4. Capila I, Linhardt RJ. Heparin–protein interactions. Angew Chem
549
Int Ed. 2002;41:390–12.
550
5. Spillmann D, Lindahl U. Glycosaminoglycan-protein interactions:
551
a question of specificity. Curr Opin Struct Biol. 1994;4:677–82.
552
6. Ricard-Blum S. Protein–glycosaminoglycan interaction networks:
553
focus on heparan sulfate. Perspect Sci. 2017;11:62–9.
554
7. Rogers CJ, Clark PM, Tully SE, Abrol R, Garcia KC, Goddard WA
555
3rd, et al. Elucidating glycosaminoglycan-protein-protein
interac-556
tions using carbohydrate microarray and computational approaches.
557
Proc Natl Acad Sci U S A. 2011;108:9747–52.
558
8. Saesen E, Sarrazin S, Laguri C, Sadir R, Maurin D, Thomas A, et al.
559
Insights into the mechanism by which interferon-γ basic amino acid
560
clusters mediate protein binding to heparan sulfate. J Am Chem
561
Soc. 2013;135:9384–90.
562
9. Soares da Costa D, Reis RL, Pashkuleva I. Sulfation of
glycosami-563
noglycans and its implications in human health and disorders. Annu
564
Rev Biomed Eng. 2017;19:1–26.
565
10. Gandhi NS, Mancera RL. The structure of glycosaminoglycans and
566
their interactions with proteins. Chem Biol Drug Des. 2008;72:
567
455–82.
568
11. Kuschert GSV, Coulin F, Power CA, Proudfoot AEI, Hubbard RE,
569
Hoogewerf AJ, et al. Glycosaminoglycans interact selectively with
570
chemokines and modulate receptor binding and cellular responses.
571
Biochemistry. 1999;38:12959–68.
572
12. Rusnati M, Coltrini D, Oreste P, Zoppetti G, Albini A, Noonan D,
573
et al. Interaction of HIV-1 tat protein with heparin: role of the
back-574
bone structure, sulfation, and size. J Biol Chem. 1997;272:11313–
575
20.
576
13. de Paz JL, Seeberger PH. Deciphering the glycosaminoglycan code
577
with the help of microarrays. Mol BioSyst. 2008;4:707–11.
578
14. Gama CI, Hsieh-Wilson LC. Chemical approaches to deciphering
579
the glycosaminoglycan code. Curr Opin Chem Biol. 2005;9:609–
580
19.
581
15. Gama CI, Tully SE, Sotogaku N, Clark PM, Rawat M, Vaidehi N,
582
et al. Sulfation patterns of glycosaminoglycans encode molecular
583
recognition and activity. Nat Chem Biol. 2006;2:467–73.
584
16. Faham S, Hileman RE, Fromm JR, Linhardt RJ, Rees DC. Heparin
585
structure and interactions with basic fibroblast growth factor.
586
Science. 1996;271:1116–20.
587
17. Gallagher JT. Heparan sulfate: growth control with a restricted
se-588
quence menu. J Clin Invest. 2001;108:357–61.
589
18. Khan S, Gor J, Mulloy B, Perkins SJ. Semi-rigid solution structures
590
of heparin by constrained X-ray scattering modelling: new insight
591
into heparin-protein complexes. J Mol Biol. 2010;395:504–21.
592
19. Khan S, Rodriguez E, Patel R, Gor J, Mulloy B, Perkins SJ. The
593
solution structure of heparan sulphate differs from that of heparin:
594
implications for function. J Biol Chem. 2013;288:27737–51.
595
20. Li W, Johnson DJD, Esmon CT, Huntington JA. Structure of the
596
antithrombin-thrombin-heparin ternary complex reveals the Surface plasmon resonance imaging coupled to on-chip mass spectrometry: a new tool to probe protein-GAG...
AUTHOR'S PROOF!
UN
CORRECT
ED
PRO
OF
597 antithrombotic mechanism of heparin. Nat Struct Mol Biol.
598 2004;11:857–62.
599 21. Lubineau A, Lortat-Jacob H, Gavard O, Sarrazin S, Bonnaffe D.
600 Synthesis of tailor-made glycoconjugate mimetics of heparan
sul-601 fate that bind IFN-gamma in the nanomolar range. Chem.-Eur. J.
602 2004;10:4265–82.
603 22. Venkataraman G, Raman R, Sasisekharan V, Sasisekharan R.
604 Molecular characteristics of fibroblast growth factor-fibroblast
605 growth factor receptor-heparin-like glycosaminoglycan complex.
606 Proc Natl Acad Sci U S A. 1999;96:3658–63.
607 23. Karamanos NK, Tzanakakis GN. Glycosaminoglycans: from
“cel-608 lular glue” to novel therapeutical agents. Curr Opin Pharmacol.
609 2012;12:220–2.
610 24. Volpi N. Therapeutic applications of glycosaminoglycans. Curr
611 Med Chem. 2006;13:1799–810.
612 25. Esko JD, Selleck SB. Order out of chaos: assembly of ligand
bind-613 ing sites in heparan sulfate. Annu Rev Biochem. 2002;71:435–71.
614 26. Zaia J. On-line separations combined with MS for analysis of
gly-615 cosaminoglycans. Mass Spectrom Rev. 2009;28:254–72.
616 27. Zaia J. Glycosaminoglycan glycomics using mass spectrometry.
617 Mol Cell Proteomics. 2013;12:885–92.
618 28. Fermas S, Gonnet F, Sutton A, Charnaux N, Mulloy B, Du Y, et al.
619 Sulfated oligosaccharides (heparin and fucoidan) binding and
di-620 merization of stromal cell-derived factor-1 (SDF-1/CXCL 12) are
621 coupled as evidenced by affinity CE-MS analysis. Glycobiology.
622 2008;18:1054–64.
623 29. Fermas S, Gonnet F, Varenne A, Gareil P, Daniel R. Frontal analysis
624 capillary electrophoresis hyphenated to electrospray ionization
625 mass spectrometry for the characterization of the antithrombin/
626 heparin pentasaccharide complex. Anal Chem. 2007;79:4987–93.
627 30. Fukui S, Feizi T, Fau-Galustian C, Galustian C, Fau-Lawson AM,
628 Lawson AM, et al. Oligosaccharide microarrays for
high-629 throughput detection and specificity assignments of
carbohydrate-630 protein interactions. Nat Biotechnol. 2002;20:1011–7.
631 31. Gray CJ, Sánchez-Ruíz A,Šardzíková I, Ahmed YA, Miller RL,
632 Reyes Martinez JE, et al. Label-free discovery array platform for the
633 characterization of glycan binding proteins and glycoproteins. Anal
634 Chem. 2017;89:4444–51.
635 32. Wang D, Liu S, Fau-Trummer BJ, Trummer BJ, Fau-Deng C, Deng
636 C, et al. Carbohydrate microarrays for the recognition of
cross-637 reactive molecular markers of microbes and host cells. Nat
638 Biotechnol. 2002;20:275–81.
639 33. Homola J. Surface plasmon resonance sensors for detection of
640 chemical and biological species. Chem Rev. 2008;108:462–93.
641 34. Nelson RW, Krone JR, Jansson O. Surface plasmon resonance
bio-642 molecular interaction analysis mass spectrometry. 1. Chip-Based
643 Analysis. Anal Chem. 1997;69:4363–8.
644 35. Nelson RW, Nedelkov D, Tubbs KA. Biomolecular interaction
645 analysis mass spectometry. BIA/MS can detect and characterize
646 protiens in complex biological fluids at the low- to subfemtomole
647 level. Anal Chem. 2000;72:404A–11A.
648 36. Bellon S, Buchmann W, Gonnet F, Jarroux N, Anger-Leroy M,
649 Guillonneau F, et al. Hyphenation of surface plasmon resonance
650 imaging to matrix-assisted laser desorption ionization mass
spec-651 trometry by on-chip mass spectrometry and tandem mass
spectrom-652 etry analysis. Anal Chem. 2009;81:7695–02.
653 37. Musso J, Buchmann W, Gonnet F, Jarroux N, Bellon S, Frydman C,
654 et al. Biomarkers probed in saliva by surface plasmon resonance
655 imaging coupled to matrix-assisted laser desorption/ionization mass
656 spectrometry in array format. Anal Bioanal Chem. 2014;407:1285–
657 94.
658 38. Remy-Martin F, El Osta M, Lucchi G, Zeggari R, Leblois T, Bellon
659 S, et al. Surface plasmon resonance imaging in arrays coupled with
660 mass spectrometry (SUPRA–MS): proof of concept of on-chip
661 characterization of a potential breast cancer marker in human
plas-662 ma. Anal Bioanal Chem. 2012;404:423–32.
663
39. Anders U, Schaefer JV, Hibti F-E, Frydman C, Suckau D,
664
Plückthun A, et al. SPRi-MALDI MS: characterization and
identi-665
fication of a kinase from cell lysate by specific interaction with
666
different designed ankyrin repeat proteins. Anal Bioanal Chem.
667
2017;409:1827–36.
668
40. Sarrazin S, Bonnaffe D, Lubineau A, Lortat-Jacob H. Heparan
sul-669
fate mimicry: a synthetic glycoconjugate that recognizes the heparin
670
binding domain of interferon-gamma inhibits the cytokine activity.
671
J Biol Chem. 2005;280:37558–64.
672
41. Zhao H, Brown Patrick H, Schuck P. On the distribution of protein
673
refractive index increments. Biophys J. 2011;100:2309–17.
674
42. Tumolo T, Angnes L, Baptista MS. Determination of the refractive
675
index increment (dn/dc) of molecule and macromolecule solutions
676
by surface plasmon resonance. Anal Biochem. 2004;333:273–9.
677
43. Przybylski C, Gonnet F, Bonnaffe D, Hersant Y, Lortat-Jacob H,
678
Daniel R. HABA-based ionic liquid matrices for UV-MALDI-MS
679
analysis of heparin and heparan sulfate oligosaccharides.
680
Glycobiology. 2010;20:224–34.
681
44. Ropartz D, E BP, Przybylski C, Gonnet F, Daniel R, Fer M, et al.
682
Performance evaluation on a wide set of matrix-assisted laser
de-683
sorption ionization matrices for the detection of oligosaccharides in
684
a high-throughput mass spectrometric screening of carbohydrate
685
depolymerizing enzymes. Rapid Commun Mass Spectrom.
686
2011;25:2059–70.
687
45. Seffouh A, Milz F, Przybylski C, Laguri C, Oosterhof A, Bourcier
688
S, et al. HSulf sulfatases catalyze processive and oriented
6-O-689
desulfation of heparan sulfate that differentially regulates fibroblast
690
growth factor activity. FASEB J. 2013;27:2431–9.
691
46. Przybylski C, Mokaddem M, Prull-Janssen M, Saesen E,
Lortat-692
Jacob H, Gonnet F, et al. On-line capillary isoelectric focusing
693
hyphenated to native electrospray ionization mass spectrometry
694
for the characterization of interferon-[gamma] and variants.
695
Analyst. 2015;140:543–50.
696
47. Lortat-Jacob H, Kleinman HK, Grimaud JA. High-affinity binding
697
of interferon-gamma to a basement membrane complex (matrigel).
698
J Clin Invest. 1991;87:878–83.
699
48. Friand V, Haddad O, Papy-Garcia D, Hlawaty H, Vassy R,
Hamma-700
Kourbali Y, et al. Glycosaminoglycan mimetics inhibit SDF-1/
701
CXCL12-mediated migration and invasion of human hepatoma
702
cells. Glycobiology. 2009;19:1511–24.
703
49. Ziarek JJ, Veldkamp CT, Zhang F, Murray NJ, Kartz GA, Liang X,
704
et al. Heparin oligosaccharides inhibit chemokine (CXC motif)
li-705
gand 12 (CXCL12) cardioprotection by binding orthogonal to the
706
dimerization interface, promoting oligomerization, and competing
707
with the chemokine (CXC motif) receptor 4 (CXCR4) N terminus. J
708
Biol Chem. 2013;288:737–46.
709
50. Sadir R, Baleux F, Grosdidier A, Imberty A, Lortat-Jacob H.
710
Characterization of the stromal cell-derived factor-1-heparin
com-711
plex. J Biol Chem. 2001;276:8288–96.
712
51. Xiao Z, Zhao W, Yang B, Zhang Z, Guan H, Linhardt RJ.
713
Heparinase 1 selectivity for the
3,6-di-O-sulfo-2-deoxy-2-714
s u l f a m i d o -α-D-glucopyranose (1,4)
2-O-sulfo-α-L-715
idopyranosyluronic acid (GlcNS3S6S-IdoA2S) linkages.
716
Glycobiology. 2011;21:13–22.
717
52. Guerrini M, Guglieri S, Casu B, Torri G, Mourier P, Boudier C,
718
et al. Antithrombin-binding octasaccharides and role of extensions
719
of the active pentasaccharide sequence in the specificity and
720
strength of interaction. Evidence for very high affinity induced by
721
an unusual glucuronic acid residue. J Biol Chem. 2008;283:26662–
722
75.
723
53. Schenauer MR, Leary JA. An ion mobility-mass spectrometry
in-724
vestigation of monocyte chemoattractant protein-1. Int J Mass
725
Spectrom. 2009;287:70–6.
726
54. Crown SE, Yu Y, Sweeney MD, Leary JA, Handel TM.
727
Heterodimerization of CCR2 chemokines and regulation by
gly-728
cosaminoglycan binding. J Biol Chem. 2006;281:25438–46. Przybylski C. et al.