En vue de l'obtention du
DOCTORAT DE L'UNIVERSITÉ DE TOULOUSE
Délivré par :Institut National Polytechnique de Toulouse (INP Toulouse)
Discipline ou spécialité :
Sciences des Agroressources
Présentée et soutenue par :
Mme THI THU HIEN NGUYENle mercredi 12 juillet 2017
Titre :
Unité de recherche : Ecole doctorale :
Study of some sorbents for boron removal from water containing high
concentration of boron
Sciences de la Matière (SDM)
Laboratoire de Chimie Agro-Industrielle (L.C.A.)
Directeur(s) de Thèse :
M. PHILIPPE BEHRA M. PIERRE YVES PONTALIER
Rapporteurs :
M. HERVE GALLARD, UNIVERSITE DE POITIERS M. MICHEL SARDIN, UNIVERSITÉ LORRAINE
Membre(s) du jury :
M. SYLVAIN OUILLON, UNIVERSITE TOULOUSE 3, Président
Mme ISABELLE LE HECHO, UNIVERSITE DE PAU ET DES PAYS DE L ADOUR, Membre M. PHILIPPE BEHRA, INP TOULOUSE, Membre
RESUME EN FRANÇAIS
Le bore est nécessaire pour le développement des plantes supérieures (structuration de la paroi végétale). Il pose cependant des problèmes (défoliation, pourriture et chute des fruits mûrs). Pour l’homme, sa toxicité se traduit par des nausées, des diarrhées, des troubles du développement intellectuel, neurologique et physique.
La pénurie en eau douce conduit à dessaler l’eau de mer pour augmenter la quantité en eau destinée à la consommation humaine, l’industrie et l’agriculture. Lors de ce procédé, il faut éliminer les ions majeurs mais aussi le bore présent à des concentrations élevées (> 4,5 mg L–1, environ 0,45 mM). Son usage dans l’industrie et son rejet dans l’environnement conduisent à la pollution des eaux souterraines et de surface. Son élimination est donc indispensable, sachant que l’Organisation Mondiale de la Santé recommande une valeur guide de 0,5 mg L–1 dans l’eau potable et une valeur maximale de 0,3 mg L–1 dans l’eau utilisée pour l’irrigation.
Cette thèse porte sur l’étude cinétique et thermodynamique des échanges du bore à la surface de différents matériaux en fonction de paramètres physico-chimiques (pH, concentration initiale …) à l’aide d’essais en réacteurs fermés et en colonnes.
Deux types de résines commerciales ont été choisies : (i) les résines échangeuses d’anions Ambersep 900-OH et Amberlite IRA 402 Cl avec des fonctions ammonium, (ii) les résines spécifiques Amberlite IRA 743 et Diaion CRB 03 ayant des fonctions méthylglucamine.
Les premières essais en réacteurs fermés montrent que les échanges liquide-solide sont rapides avec une élimination du bore > 96% pour t < 30 min pour Amberlite IRA 743, Diaion CRB 03 et Ambersep 900-OH. Pour t > 2 h, un équilibre est observé pour toutes les résines. Le modèle du pseudo-second ordre permet de décrire la cinétique de sorption pour les 4 résines. A l’équilibre, l’adsorption est maximum d’une part dans une gamme de pH compris entre 6 et 12 pour les 2 résines sélectives Amberlite IRA 743 et Diaion CRB 03, et d’autre part pour un pH de 8 pour la résine Ambersep 900-OH et un pH 10 pour la résine Amberlite IRA 402 Cl. Au pH initiale 8, l'affinité de bore pour les résines a diminué comme suit: Ambersep 900-OH (1,6 mmol g–1), Amberlite IRA 743 (1,3 mmol g–1), Diaion CRB 03 (0,9 mmol g–1) and Amberlite IRA 402 Cl (0,2 mmol g–1). Dans la gamme des concentrations de bore étudiées, (i) la relation de type Langmuir a été appliquée aux résines Ambersep 900-OH et Diaion CRB 03 pour l'ajustement de la capacité de sorption maximale et du coefficient de type Langmuir qui sont de 2,2 et 0,87 mmol g-1 respectivement. (ii) la relation de type BET a été utilisée pour décrire le comportement du bore en présence de la résine Amberlite IRA 743 et pour estimer le coefficient de type BET et la capacité de sorption du bore (0,43 mmol g-1); et (iii) le modèle de type Henry a été utilisé pour adapter le comportement à la sorption du bore dans le cas de l'Amberlite IRA 402 Cl.
Les résines Ambersep 900-OH, échangeuse d’anions, et Amberlite IRA 743, sélective, ont été utilisées pour les essais en colonnes en fonction de la concentration en bore et du temps de séjour. Pour la résine spécifique, le temps de séjour dans la colonne affecte fortement le comportement du bore : lorsqu’il diminue, son élution est rapide suivie d’une longue traînée ; lorsqu’il augmente, la courbe de percée correspond à un système à l’équilibre. Pour un temps de séjour
élevé, les résultats confirment la non-linéarité observée lors des essais en réacteurs fermés. Pour la résine échangeuse d’anions, la non-linéarité est aussi confirmée. Ces essais permettent de différencier le comportement du bore lors de sa désorption. La régénération est obtenue après des traitements acides et basiques pour la résine spécifique alors qu’un traitement alcalin est suffisant pour la résine anionique. Des modèles optimisés et des modèles non linéaires sont étudiés pour construire un modèle d'échange pour prédire le devenir de bore.
La fixation du bore sur des pectines et sa rétention par des membranes d’ultrafiltration (membranes de seuil de coupure différent) a aussi été étudiée. Les pectines ont été caractérisées (composition en sucre et en bore présent initialement) et la viscosité des solutions pectiques mesurée. Des essais de filtration ont permis de déterminer l’efficacité de production et de rétention du bore sur ces matériaux.
RESUME EN ANGLAIS
Boron is an element, which is necessary as essential nutrient for living organisms, especially for plants where it is involved in cell wall composition. But boron excess can cause some problems on the development of plants (defoliation, decay and fall unripe fruits), of humans and animals such as nausea, diarrhoea, dermatitis, lethargy. Boron toxicity also changes blood composition, caused disorder in neurological, physical, intellectual development.
Nowadays, due to the shortage of fresh water sources, seawater desalination has been becoming an alternative fresh water supply. However, the presence of boron in seawater is quite high (4.5 mg L–1, around 4.5 mM). Moreover, the increasing use of boron in industries and its discharge to the environment has led to the contamination of surface and ground waters. As the result, boron removal, in production of drinking water becomes very important. Therefore, the World health organization has recommended a guideline of 0.5 mg L–1 B in drinking water and a maximum limit of 0.3 mg L–1 B in fresh water used for irrigation.
The objective of this thesis is to study the mechanisms of boron surface exchange on different materials versus time and at equilibrium depending on some physicochemical parameters such as pH, initial boron concentration, reaction time in order to find a new exchanger for boron removal. Boron removal was carried out by ion exchange process using 2 types of resins: Amberlite IRA 743, Diaion CRB 03 as boron selective resins with methylglucamine functions, and Ambersep 900-OH and Amberlite IRA 402 Cl as anionic exchange resins with ammonium functions. From batch studies, fast exchange between resin surface and liquid phase was observed with boron removal up to at least 96% within 30 min for Amberlite IRA 743, Diaion CRB 03 and Ambersep 900-OH. The reaction between resin surface and boron solution reached equilibrium after 2 h for all the resins. The pseudo-second order kinetic model was used to well describe the sorption kinetic process of the resins. At equilibrium, the experimental results showed that the maximum adsorption was observed to be achieved at pH 8 for Ambersep 900-OH, pH 10 for Amberlite IRA 402 Cl and independent on pH range from 6 to 12 for the 2 boron selective resins Amberlite IRA 743 and Diaion CRB 03. At initial pH 8, the boron affinity for resins decreased as follow: Ambersep 900-OH (1.6 mmol g–1), Amberlite IRA 743 (1.3 mmol g–1), Diaion CRB 03 (0.9 mmol g–1) and Amberlite IRA 402 Cl (0.2 mmol g–1). In the range of boron concentrations studied, (i) the Langmuir-type relationship was applied to the Ambersep 900-OH and Diaion CRB 03 resins for fitting the maximum sorption capacity and the Langmuir-type coefficient which are 2.2 and 0.87 mmol g–1 respectively; (ii) the BET-type relationship was used for describing the boron behaviour in the presence of the Amberlite IRA 743 resin and for estimating the BET-type coefficient and the boron sorption capacity (0.43 mmol g–1); and (iii) the Henry-type model was used for fitting boron sorption behaviour in the case of the Amberlite IRA 402 Cl.
Column experiments were performed with the anionic resin Ambersep 900-OH and the selective one Amberlite IRA 743 by studying both the influence of boron concentration and the residence time. For the selective resin, if the residence time decreases, the boron breakthrough is fast followed by a long tail. For larger residence time, local equilibrium seems to be assumed. Results
are thus consistent with batch experimental data. For the anionic resin, the non-linear behaviour is also confirmed. Moreover, column experiments showed a strong difference during desorption. To regenerate resins, acid and basic treatments are necessary for the selective resin although a basic solution is enough for the anionic resin. Optimized models and non - linear models are studied to build an exchange model for predicting boron fate.
Finally, characterization of pectins was also performed. Its composition (sugar and boron content) and the viscosity of pectin solutions were quantified. Filtration experiments allowed testing the efficiency of such material to remove boron too.
Acknowledgements
First of all, I would like to express my deepest gratitude to my thesis supervisors: professor Philippe Behra and doctor PierreYves Pontalier. It is my honor to have chance to work with them more than 4 years in Laboratoire de Chimie Agro-Industrielle (LCA), ENSIACET, INPT. From them, I learned a lot from their way of analyzing, solving problems as well as a meticulous, careful characteristic, which is one of the most extremely important factors in research field. I am very much thankful to other colleagues in LCA, Romain and Remy, who has supported me a lot whenever I need more chemicals or equipment to do my experiments.
I am grateful to the participant of the following interns who has helped me very much in doing manipulation, especially for my column experiments which take lots of time and labor: Mohamed Badis Ayadi, Maria Nassarruiz, Elie Beros, Bou Rania, Paul Chaboureau, Falba Pierre, Carole Mailhan, BE Ngoc Diep. Without them, I couldn’t imagine how can I finish a huge amount of experiment during my thesis.
It is also my pleasure to thank other PhD students in LCA who has shared with me not only their work experience but also the stress I met during my thesis: Mogni Assad, Benjamin Moras, BORIES Cecile, Alan Castillo Villa, Marian Anaya Castro, Pablo Lopez Hurtado, ORIEZ Vincent, Beaufils Nicolas. My thesis could be well done because of your great distribution and correction also.
Thank to Vietnamese friends in LCA: Quang Hưng, Mai Anh, Nhật Mai, Thuỳ Dung, Thanh Tâm, Ngọc Diệp, Ngọc Hà, Minh Huy and two others in LGC: Văn Nhất, Trung Dũng for sharing with me other activities: travelling, having lunch, relaxing…
Nothing could be greater than the support from my beloved family: my husband who always listened to me and encouraged me to get over every hardest moment, my parents, my parents in law, my brother and sisters who live thousands miles far away from me but always believe in me and give me a hand whenever I need.
Toulouse, 24/09/2017 NGUYEN Thi Thu Hien
Table of contents
List of abbreviations ... XIII
INTRODUCTION ... 1
Chapter 1 STATE OF THE ART ... 7
1.1. Boron presentation ... 9
1.1.1. Introduction of boron ... 9
1.1.2. Sources of boron ... 9
1.1.2.1. Natural sources ... 9
1.1.2.2. Boron sources from human activities ... 10
1.1.3. Boron and its effect on life development ... 10
1.2. Boron in water production ... 11
1.2.1. Water resources ... 11
1.2.2. Boron chemistry in aqueous solution ... 12
1.2.3. Desalination plant for water production ... 13
1.2.3.1. Types of desalination plants ... 13
1.2.3.2. Membrane plant design ... 13
1.3. Study of boron removal technologies ... 15
1.3.1. Reverse osmosis method ... 15
1.3.1.1. Reverse osmosis principles ... 15
1.3.1.2. Membrane separation mechanisms ... 16
1.3.1.3. Effects of each parameter on boron rejection ... 17
1.3.2. Ion exchange methods ... 19
1.3.2.1. Boron selective resins ... 19
1.3.2.1.1. Fixation mechanisms ... 19
1.3.2.1.2. Resin structure development ... 20
1.3.2.1.3. Effects of each parameter on boron rejection ... 23
1.3.2.2. Non boron selective resins ... 24
1.3.2.2.2. Effect of each parameter on boron rejection ... 25
1.3.2.3. Other adsorbents ... 26
1.3.3. Hybrid methods ... 30
1.3.3.1. PEUF – Polymer enhanced ultrafiltration method ... 30
1.3.3.2. AMF – Adsorption membrane filtration ... 31
1.3.4. Other methods ... 33
1.3.4.1. Electrocoagulation method (EC) ... 33
1.3.4.2. Donnan dialysis method (DD) ... 33
1.3.4.3. Capacitive deionization method (CDI) ... 33
1.3.4.4. Direct contact membrane distillation method (DCMD) ... 34
1.3.4.5. Conclusion ... 34
1.4. Theoritical models for batch and column systems ... 36
1.4.1. Kinetic and adsorption models ... 36
1.4.1.1. Kinetic models ... 36
1.4.1.2. Sorption model theory ... 37
1.4.2. Non-linear chromatography theory for column experiment ... 39
1.4.3. Optimized modeling of breakthrough curves ... 42
1.4.3.1. Pseudo first order modeling ... 42
1.4.3.2. Pseudo second order modeling ... 44
1.5. Pectins - New adsorbents ... 44
1.5.1. Pectins ... 44
1.5.1.1. Pectins presentation and functions ... 44
1.5.1.1. Pectins structure and properties ... 45
1.5.1.2. Application of pectins on industry ... 49
1.5.2. Membrane filtration ... 49
1.5.2.1. Principle and limiting factors ... 50
1.5.2.1.1. Principles ... 50
1.5.2.1.3. Membrane configurations and modules ... 53
1.5.3. Conclusion ... 56
Chapter 2 MATERIAL AND METHODS ... 58
2.1. Boron analysis methods ... 60
2.2. Experiments on batch system ... 60
2.2.1. Resins ... 60
2.2.2. Experiment procedures ... 63
2.2.2.1. Kinetic experiments ... 63
2.2.2.1. pH effect experiments ... 63
2.2.2.2. Isotherm experiments ... 63
2.3. Experiments on column system ... 64
2.3.1. Material and experimental set-up ... 64
2.3.2. Experimental procedure ... 65
2.3.2.1. Pore volume (Vp) determination ... 65
2.3.2.2. Boron adsorption experiment ... 66
2.4. Experiments on hybrid system ... 67
2.4.1. Material ... 67
2.4.2. Experimental procedure ... 68
2.4.2.1. Pectin characterization ... 68
2.4.2.1.1. Pectin hydrolysis... 68
2.4.2.1.2. Sugar and galacturonic acid analysis ... 68
2.4.2.1.3. Viscosity measurement ... 69
2.4.2.2. Boron fixation on hybrid method ... 69
2.4.2.2.1. Ultrafiltration evaluation on Amicon cell and hollow-fiber system ... 69
2.4.2.2.2. Boron fixation at different pH ... 70
2.4.2.2.2.1. Pectin with Milli-Q water ... 70
Chapter 3 BORON FIXATION ON SYNTHETIC RESINS WITH BATCH-MODE SYSTEM .. 73
3.1. Introduction ... 75
3.2. Sorption kinetic and isotherm theory ... 78
3.3. Material and methods ... 81
3.3.1. Materials ... 81 3.3.2. Methods ... 81 3.3.2.1. Kinetic experiments ... 81 3.3.2.2. pH effect experiments ... 82 3.3.2.3. Isotherm experiments ... 82 3.3.3. Boron analysis ... 82 3.4. Results ... 83
3.4.1. Kinetic sorption experiments ... 83
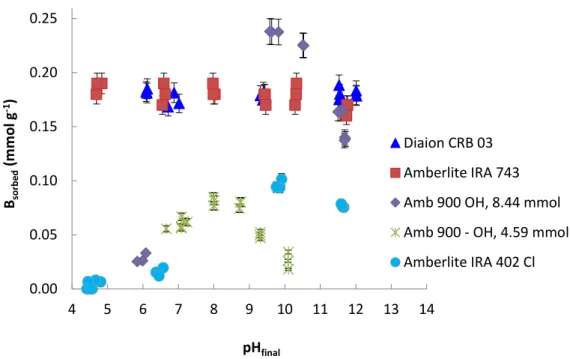
3.4.2. Effect of pH on the boron adsorption ... 87
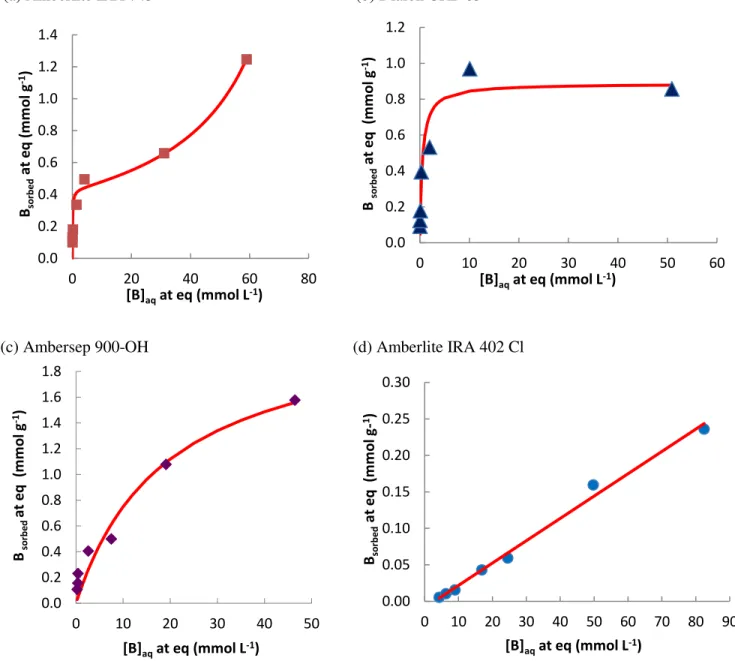
3.4.3. Isotherm experiments ... 88
3.5. Discussion ... 91
3.6. Conclusion ... 96
Chapter 4 BORON FIXATION ON SYNTHETIC RESINS WITH FLOW - THROUGH REACTOR ……….98
4.1. Introduction ... 100
4.2. Materials and methods ... 101
4.2.1. Materials ... 101
4.2.2. Methods ... 101
4.2.2.1. Boron analysis ... 101
4.2.2.2. Column experiments ... 102
4.2.2.2.1. Pore volume (Vp) Determination ... 102
4.2.2.2.2. Boron experiments ... 103
4.3. Results ... 103
4.3.1. Pore volume (Vp) determination ... 103
4.3.1.2. Amberlite IRA 743 resin ... 106
4.3.2. Boron fixation experiments ... 108
4.3.2.1. Ambersep 900-OH ... 108
4.3.2.1.1. Influence of boron concentration ... 108
4.3.2.1.2. Influence of flow rate ... 109
4.3.2.1.3. Influence of resin bed volume ... 110
4.3.2.2. Amberlite IRA 743 ... 111
4.3.2.2.1. Influence of flow rate ... 111
4.3.2.3. Comparison between two resins ... 112
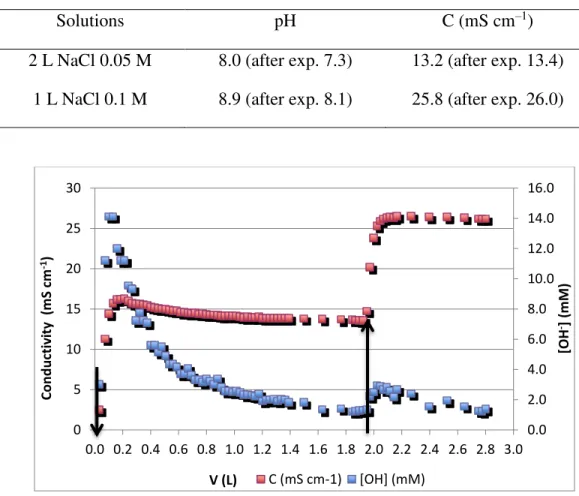
4.3.2.4. pH and conductivity evolution ... 115
4.3.2.4.1. Ambersep 900-OH ... 115
4.3.2.4.2. Amberlite IRA 743 ... 117
4.3.3. Optimized models ... 120
4.3.3.1. Pseudo first order breakthrough curve modeling ... 120
4.3.3.2. Pseudo-second order breakthrough curve modeling ... 122
4.3.4. Non-linear chromatography modeling ... 124
4.3.4.1. Non-linear model ... 124
4.3.4.2. Non-linear modeling ... 127
4.3.5. Conclusion ... 131
Chapter 5 PECTIN EXTRACTS FOR BORON REMOVAL IN WATER ... 133
5.1. Introduction ... 135
5.2. Materials and methods ... 138
5.2.1. Materials ... 138
5.2.2. Methods ... 139
5.2.2.1. Pectins characterization ... 139
5.2.2.1.1. Pectin hydrolysis... 139
5.2.2.1.2. Sugar and galactorunic acid analysis ... 140
5.2.2.1. Boron fixation on hybrid method ... 141
5.2.2.1.1. Ultrafiltration evaluation on Amicon cell and hollow-fiber system ... 141
5.2.2.1.2. Boron fixation at different pH ... 142
5.2.2.1.2.1. Pectin with Milli-Q water ... 142
5.2.2.1.2.2. Pectin with boron solution ... 142
5.3. Results and discussion ... 142
5.3.1. Pectin characterization ... 142
5.3.2. Ultrafiltration ... 143
5.3.2.1. Membranes screening ... 143
5.3.2.1.1. Membrane permeability ... 143
5.3.2.1.2. Influence of the pressure ... 146
5.3.2.2. Membrane performance evaluation ... 146
5.3.2.2.1. Batch extracted pectin ... 147
5.3.2.2.2. Twin-screw extracted pectin ... 147
5.3.2.3. Discussion ... 148
5.3.3. Boron fixation ... 149
5.3.3.1. Fixation experiment ... 149
5.3.3.1.1. Twin-screw extracted pectin ... 149
5.3.3.1.2. Batch extracted pectin ... 151
5.3.3.2. Discussion ... 152
5.3.4. Conclusion ... 152
CONCLUSIONS AND PERPECTIVES ... 155
5.4. Conclusions and perspectives ... 157
List of figures
Fig. 1.1. Boric acid speciation as a function of pH ... 12
Fig. 1.2. Presentation of the complete flowsheet of a desalination plant ... 14
Fig. 1.3. Boron removal processes of seawater desalination ... 15
Fig. 1.4. Osmosis and reverse osmosis model ... 16
Fig. 1.5. Mechanism of water transport through reverse osmosis membrane by performing bridges of hydrogen ... 17
Fig. 1.6. The distribution of boric acid and borate in seawater by the changes of each parameter. .. 18
Fig. 1.7. Structure of borate complex ... 19
Fig. 1.8. Reactions during boron complex formation. ... 19
Fig. 1.9. Reactions during boron complex formation ... 20
Fig. 1.10. Structure of boron selective resinss containing N-methyl-D-glucamine ... 22
Fig. 1.11. Ion exchanger types ... 25
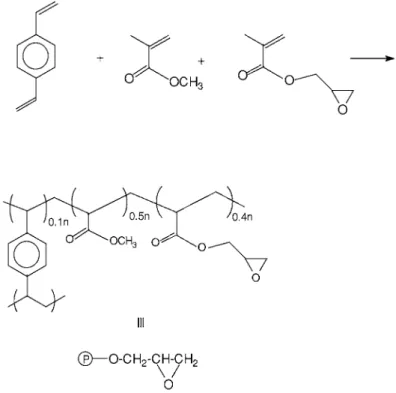
Fig. 1.12. Synthesis of N-methylglucamine-type cellulose derivatives. ... 27
Fig. 1.13. Group configurations in cotton cellulose ... 27
Fig. 1.14. Boron fixation reaction on cotton cellulose ... 27
Fig. 1.15. Synthesis of cross – linked chitosan and N-methylglucamine. ... 28
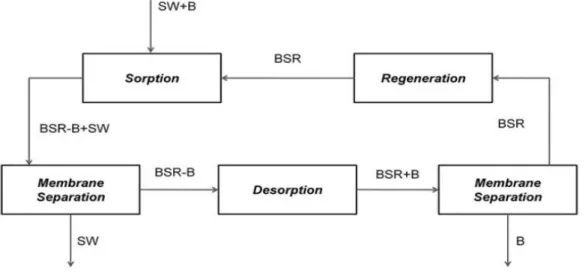
Fig. 1.16. Flow sheet of the adsorption membrane filtration system ... 31
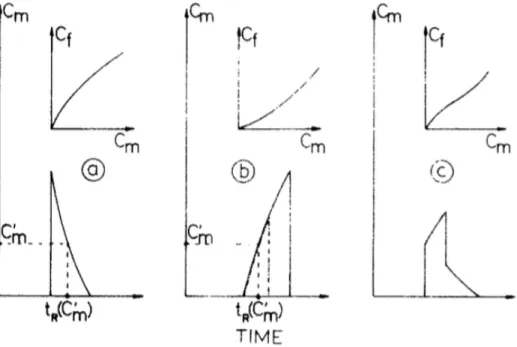
Fig. 1.17. Schematic representation of the response of the chromatographic column for linear adsorption isotherms. ... 40
Fig. 1.18. Examples of Golden’s rule. ... 41
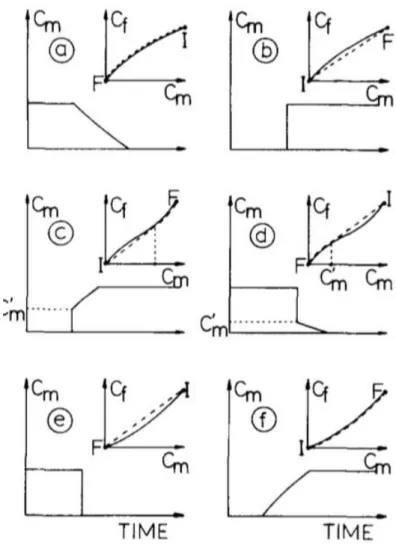
Fig. 1.19. Relation between the shape of an adsorption isotherm and the shape of the breakthrough curve ... 42
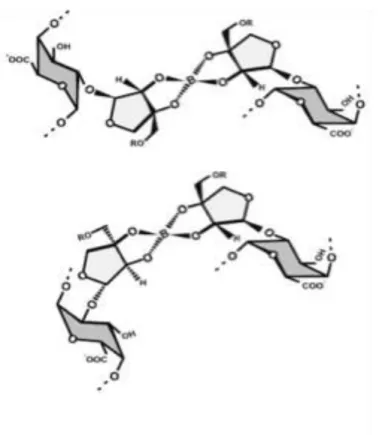
Fig. 1.20. The structures of two possible isomers of the reversible RG-II-Boron diester found in the walls of plant ... 48
Fig. 1.21. The concentration polarization in filtration process. ... 52
Fig. 1.22. different resistances including concentration polarization and clogging. ... 53
Fig. 1.23. The dead-end and cross-flow geometries ... 54
Fig. 1.24. Spiral wound membrane module ... 55
Fig. 2.1. Batch experiment design ... 64 Fig. 3.1. Proposed mechanisms for the binding of boron by chelating resins ... 76 Fig. 3.2. N-methylglucamine group ... 77 Fig. 3.3. Kinetic experiments of boron fixation on the four resins: IRA 743, CRB 03, IRA 402 Cl
and Ambersep 900-OH at initial pH 8 ... 84 Fig. 3.4. Fitting of sorption boron kinetic experiments with the pseudo-first order kinetic model from 0 to 15 min the anionic Ambersep 900-OH resin and for the boron selective resin Amberlite IRA 743 ... 85 Fig. 3.5. Fitting of sorption boron kinetic experiments with the pseudo-second order kinetic model for B sorption on the 4 resins. ... 86 Fig. 3.6. pH Adsorption-edge experiments of boron adsorbed on the 4 resins, Amb 900-OH, CRB 03, IRA 743, IRA 402 Cl at pH 8 ... 88 Fig. 3.7. Adsorption isotherms of boron with the selective and anionic resins for initial pH 8 ... 89 Fig. 3.8. Comparison between Langmuir-type fitting (line: —) and experimental data (dots) for boron sorption on the resins: (a) Amberlite IRA 743, (b) Diaion CRB 03, (c) Ambersep 900-OH; and (d) linear-type fitting for the anionic resin Amberlite IRA 402 Cl. ... 91 Fig. 3.9. Two first-step mechanisms for explaining BET-type behavior of boron sorption on the specific resin Amberlite IRA 743 taking into account diborate ion complexation supported by bond analyses of borates ... 95 Fig. 4.1. Adsorption of NaCl 0.05 M, pH 8.8 and NaCl 0.1 M, pH 9.0 on 100 mL Ambersep
900-OH resin, the first time, flow rate of 10 BV h–1 (1 L h–1). ... 104 Fig. 4.2. Determination of Vp of 100 mL Ambersep 900-OH dry resin ... 105 Fig. 4.3. Adsorption of NaCl 0.05 M, pH 8.8 and NaCl 0.1 M, pH 8.9 on 100 mL Ambersep
900-OH resin, the second and the third time, flow rate of 10 BV h–1 (1 L h–1). ... 106 Fig. 4.4. Adsorption of 0.05 M NaCl, pH 8.0 and 0.1 M NaCl, pH 8.9 on 100 mL Amberlite IRA 743 resin, flow rate of 30 BV h–1 (3 L h–1). ... 107 Fig. 4.5. Effect of boron concentration on boron breakthrough in the presence of Ambersep
900-OH. Experimental conditions: 9.0 mM and 1.8 mM boron solutions, 10 BV h–1(1 L h–1), pH 8……...………..108 Fig. 4.6. Effect of flow rate on boron breakthrough in the presence of Ambersep 900-OH…...………..109 Fig. 4.7. Adsorption of 0.05 M NaCl, pH 8.0 and 0.1 M NaCl, pH 8.9 on 100 mL Amberlite IRA
743 resin, flow rate of 30 BV h–1 (3 L h–1). ... 110 Fig. 4.8. Breakthrough curve for desorption of 9.54 mM B solution, at flow rate of 16 BV h-1 (6.4 L h–1), pH 13. ... 111
Fig. 4.9. Effect of flow rate on boron breakthrough in the presence of Amberlite IRA 743 ... 112 Fig. 4.10. Comparison of boron breakthrough for the two types of resin, the specific IRA 743 and
the anionic Ambersep 900-OH ones. ………....113
Fig. 4.11. Breakthrough curves of [B] versus [OH-] for adsorption and desorption process of 1.8 mM boron solution, 10 BV h–1(1.0 L h–1), pH 8.. ... 116 Fig. 4.12. Breakthrough curves of [B] versus C for adsorption and desorption process of 1.8 mM boron solution, 10 BV h–1(1.0 L h–1), pH 8.. ... 116 Fig. 4.13. Breakthrough curves of [B] versus [OH–] for desorption process of 1.8 mM boron solution, 10 BV h–1(1.0 L h–1), pH 12.6. ... 117 Fig. 4.14. Breakthrough curves of boron and hydroxide versus elution volume for adsorption process of 8.62 ….………...118 Fig. 4.15. Breakthrough curves of boron and conductivity versus elution volume for adsorption process of 8.62 mM boron solution, 10 BV h–1 (1.0 L h–1), pH 8. ... 119 Fig. 4.16. Breakthrough curves of boron and pH versus elution volume for desorption process 8.62 mM boron solution, 10 BV h–1, using 0.5 M H2SO4 and 0.25 M NaOH. ... 120 Fig. 4.17. Linear plot of time vs. ln(C/(C0-C)) at 9.54 mM, 400 mL resin, 16 BV h-1, Amb 900-OH resin ... 121 Fig. 4.18. Comparison between experimental and predicted breakthrough curves according to Yoon and Nelson model ([B]: 9.54 mm, 400 ml resin, 16 BV h-1, Amb 900-OH resin) ... 121 Fig. 4.19. Linear plot of time vs ln(C/(C0-C)) at 8.62 mM, 100 mL resin, 10 BV h–1, Amb IRA 743
... 121 Fig. 4.20. Comparison between experimental and predicted breakthrough curves according to Yoon and Nelson model ([B]: 8.62 mM, 100 ml resin, 10 BV h–1, Amb IRA 743) ... 121 Fig. 4.21. Linear plot of volume vs ln((C0-C)/C) at 9.54 mM, 400 mL resin, 16 BV h–1, Amb
900-OH ... 123 Fig. 4.22. Comparison between experimental and predicted breakthrough curves according to Thomas model ([B]: 9.54 mM, 400 ml resin, 16 BV h–1, Amb 900-OH) ... 123 Fig. 4.23. Linear plot of volume vs ln((C0-C)/C) at 8.62 mM, 100 mL resin, 10 BV h–1, Amb IRA 743 ... 123 Fig. 4.24. Comparison between experimental and predicted breakthrough curves according to Thomas model ([B]: 8.62 mM, 100 ml resin, 10 BV h–1, Amb IRA 743) ... 123 Fig. 4.25. Comparison of boron fixation fronts of model, optimized model and experiment with
Ambersep 900-OH ……… 127
Fig. 4.26: Comparison of boron elution of of model, optimized model and experiment with Ambersep 900-OH ... 128
Fig. 4.27. Comparison of model and experiment for boron fixation front with Ambersep IRA 743. ... 129 Fig. 5.1. Description of the interaction between pectin and boron. ... 137 Fig. 5.2. The illustration of boron complexation with RG-II ... 138 Fig. 5.3. Influence of the stirring velocity on the membrane permeability during the filtration of water with three membranes. ... 144 Fig. 5.4. Permeate flux evolution versus the stirring velocity during the filtration of a 5 g L–1 pectin solution with three membranes ... 144 Fig. 5.5. Influence of the pressure during the filtration of pectin solution………..146 Fig. 5.6. Influence of the pressure on the permeate flux at steady state during the filtration of a 5 g
L–1 pectin solution at 25 ºC. Pectin has been extracted in batch condition. ... 147 Fig. 5.7. Influence of the pressure on the permeate flux at steady state during the filtration of a 5 g L–1 pectic solution at 25 ºc. Pectin have been extracted by twin-screw extrusion. ... 148
List of table
Table 1.1. Some designed N-Methyl- D -glucamine resins.. ... 21
Table 1.2. Functional groups for anion exchangers ... 25
Table 1.3. The list of boron removal technologies ... 35
Table 1.4. Pectin content of some fruits ... 46
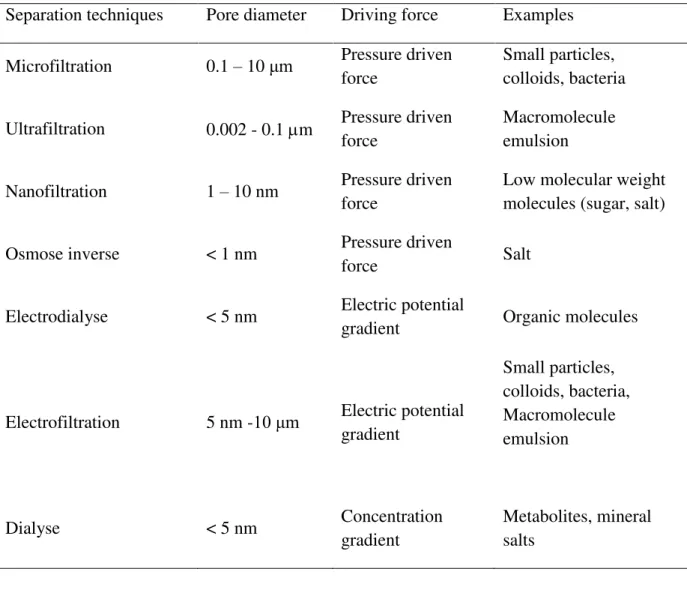
Table 1.5. The classification of membrane separation techniques ... 51
Table 2.1. Typical chemical and physical characteristics of four resins ... 61
Table 2.2. Mass and length in column of 100 ml each resin ... 65
Table 2.3. Properties of the sodium chloride solutions before elution ... 65
Table 2.4. Boron adsorption column experiment planning ... 66
Table 2.5. Suggested concentration ranges for calibration standards………...69
Table 2.6. List of chemicals ... 71
Table 3.1. Rate constant k1, amount of boron adsorbed at equilibrium qe and half-time of boron sorption reaction ... 85
Table 3.2. Rate constant k2, amount of boron adsorbed at equilibrium qe and half-time of boron sorption reaction ... 87
Table 3.3. Maximum adsorption capacity, Langmuir-type coefficient, distribution coefficient and correlation coefficients estimated from the Langmuir-type relationship for the two selective resins and the anionic resin Ambersep 900-OH. For the Amberlite IRA 402-Cl, linear-type relationship was applied ... 90
Table 4.1. Properties of the sodium chloride solutions before elution ... 103
Table 4.2. Properties of the NaCl solutions for the second and third elutions ... 105
Table 4.3. Properties of the NaCl solutions for Vp determination of IRA 743 ... 107
Table 4.4. Column utilization performance for each resin ... 114
Table 4.5. Boron adsorption capacities on each resin ... 115
Table 4.6. Properties of the boron feed solutions used for adsorption on Ambersep 900-OH ... 115
Table 4.7. Properties of the boron feed solution used for adsorption on Amberlite IRA 743 ... 118
Table 4.8. Properties of the desorption solutions……….……120 Table 4.9. Yoon and nelson model parameters compared to pseudo-first order model parameters 122
Table 4.10. Yoon and nelson model parameters compared to pseudo-first order model parameters
... 124
Table 4.11. Mass and length in column of 100 mL each resin………...126
Table 4.12: Calculation of the influence of the concentration on the boron retardation factor on the resin Ambersep IRA 900-OH. ... 128
Table 4.13: Comparison of the influence of the concentration on the boron retardation factor for model and experiment results of Simonnot and co-workers. ... 130
Table 5.1. Suggested concentration ranges for calibration standards ... 140
Table 5.2. Composition of the pectin extracts used for the boron fixation…..……….143
Table 5.3. The hydraulic permeablities of the membrane with water and pectic solutions ... 145
Table 5.4. Boron in pectin, boron adsorbed by pectin, initial & final pH of adsorption experiment between boron solution and dry twin-screw pectin . ... 150
Table 5.5. Influence of the pressure during the filtration of pectin solution ... 150
Table 5.6. Influence of the pressure on the permeate flux at steady state during the filtration of pectin solution. Pectin has been extracted in batch condition………...…………..…..151
Table 5.7. Boron in pectin, boron adsorbed by pectin, initial & final pH of adsorption experiment between boron solution and dry batch extracted pectin. ... 152
List of abbreviations
Abbreviation Fullname
AAS Atomic absorption spectrometry Amberlite IRA 400 Cl IRA 400 Cl
Amberlite IRA 743 Amb IRA 743 Ambersep 900-OH Amb 900-OH
AMF Adsorption membrane filtration
BET Brunauer-Emmett-Teller
BSRs Boron selective resins
CDI Capacitive deionization method CRC Caulerpa racemosa var. cylindracea
DCMD Direct contact membrane distillation method
DD Donnan dialysis method
DE Degree of esterification
Diaion CRB 03 CRB 03
DVB divinyl benzene
EC Electrocoagulation method
ED Electrodialysis
EDTA Ethylenediaminetetraacetic acid
EU European Union
GalA Galacturonan acid
GMA Glycidyl methacrylate
H/D Height/Diameter
H/D Height/Diameter
HG Homogalacturonan
HM High-methoxy
ICP-AES Inductively coupled plasma - Atomic emission spectroscopy IUPAC International Union of Pure and Applied Chemistry
LM Low-methoxy
LOD Limit of detection
LOQ Limit of quantification
LTV Long-tube vertical distillation
MD Membrane distillation
MED Multiple-effect evaporation/distillation MENA The Middle East and North African
MMA Methyl methacrylate
MSF Multi-stage flash evaporation/distillation MWCO Molecular weight cut-off
NMDG N-methyl-D-glucamine
NRA Nuclear reaction analytical
NREL National Renewable Energy Laboratory PEUF Polymer enhanced ultrafiltration method pKa Acid dissociation constant
PTFE Polytétrafluoroéthylène
RG Rhamnogalactorunan
RO Reverse osmosis
SRS Sugar recovery standards
TIMS Thermal ionization mass spectrometry
UK United Kingdom
VCD Vapor compression distillation
Vp Pore volume
WHO World Health Organization
Fresh water is one of the most essential compounds necessary for the development of life on Earth. Fresh water plays an important role for the vital needs of human, animals and plants. Water content ranges from 60% to 95% in living organisms, in which humans are about 60 % water. To maintain health, humans need to drink 1.5 L to 2.5 L water per person per day. Moreover, people use fresh water for many purposes: Daily activities, raising livestock, or industrial production such as food, textile, etc. The presence of water is mandatory in most of development processes of plants such as photosynthesis, growth and reproduction. Different crops consume different level of water (from 300 to 2000 L) to produce one kilogram of dry matter (Pimentel et al. 2004). However, available fresh water source is very limited. Water all over the world has distributed mainly as seawater on the ocean with 97.5%, 1.7% as fresh water in icecap and only 0.8% as available fresh water which can be found as ground water or surface water in streams, lakes, or rivers (Shiklomanov and Rodda, 2003). Nowadays, water shortage is becoming a serious problem all over the world because of climate change and human impacts. The high water demand because of population rapid increasing, coupled with the heavy water pollution, due to the leakage of industrial sewage into the environment, are the crucial reasons. Besides, low annual rainfall level plus hardly water-stored geological characteristic like in Middle East North Africa are also the main factors for the lack of fresh water. In addition, with the global warming, drought exits longer in many areas while people, animal and plant as well need more fresh water to sustain their lives. Therefore, it is necessary to find alternative fresh water sources to respond the high demand of water of society. Desalted water produced from seawater desalination is one of the feasible solutions.
Water desalting is usually performed from seawater by water evaporation and by membrane plants where reverse osmosis is the desalting step. This latter technology is widely used because water production is cheaper. Unfortunately, desalted water contains a high concentration of boron. Normally, boron concentration in seawater is about 4.6 mg L–1, higher in Mediterranean Sea (9.6 mg L–1) (Xu and Jiang, 2008). After desalination, boron concentration decreased but still higher than 1.0 mg L-1. Even with surface water or ground water, boron concentration can be high because of the contamination of boron appearing from discharge of wastewater due to using boron containing products in daily life such as soaps, glass production, fertilizer, etc. Hence, there is a problem with water containing low salt concentration but boron that must be removed.
Boron is one of the essential elements for the development of animals and plants but excess boron also cause some health and ecological damages. For the animals, boron toxicity limits cell formation, weakens the bones, retards growth and creates disorders of the reproductive system. For the plant, it is poisonous, shows adversely physical effects, for example, the reduction of root cell division, the inhibition of photosynthesis, the decrease of the chlorophyll. Consequently, it is very important to control boron concentration in water to get a guaranty water source for human living and irrigation. As the results, boron limitation was set up in drinking water is 0.5 mg L–1 by WHO and 1.0 mg L–1 by EU. For some sensitive crops such as citrus trees, the boron limitation is lowered to 0.3 mg L-1 in irrigation water (WHO, 1998; WHO,
2011).
However, boron removal is a not easy solving problem. Many researches were carried out to find the best ways to remove boron but each of them still have its own disadvantages. The
methods such as sedimentation, coagulation, adsorption on clays are not effective because they can remove only small amount of boron or cannot remove at all. Membrane methods can reduce the boron content to permissible level with 98 - 99% efficiency. However, this technology needs to add alkali into the solution to increase the pH to 10 – 11, from that boric acid will be transformed to borate ions, which are favorable for the separation process. Additionally, the increase of alkalinity of solution is a good environment to produce precipitation of magnesium, calcium hydroxides on the membrane surface which cause scaling phenomena.
The last method is the boron fixation on resins, by adsorption or ion exchange. Conventional ion exchange presents low selectivity in the presence of other ions and need an additional chemical to increase pH of solution due to the poor ionization of boric acid in natural condition. Boron selective resins are widely used for boron removal because of high selectivity, by the formation of stable complex between boric acid or borate ions and cis-diol groups on the surface of resin. However, this method encounters with resin regeneration problem, because solution containing concentrated acidic and alkali with high boron concentration is generated after one or several regeneration cycles. Utilization of boron compounds from these solutions is inexpedient, thus they becomes the secondary contamination source to the environment.
The use of hybrid system opens a new approach of boron removal which can take the advantages of both adsorption and membrane methods. These methods are based on the following principle; boron is fixed on particulates that are removed by membrane filtration. With this technology, the boron removal could be effective without the scaling problem of membrane. To develop some ecofriendly boron removal methods, some natural sorbents such as cellulose, sawdust, chitosan, seaweed, tannin etc., with structure modifications were investigated to remove boron from aqueous solution. These materials contain polysaccharides, which have chelating properties, and amino groups, that are necessary for the process of boric acid complexing. However, research reported various results from inefficiency (sawdust) to fast and high efficiency (tannin gel, chitosan resin).
Beet pulp, the solid residue produced after sugar extraction, I usually dried before to be milled in pellets for animal feed. This residue contains a large amount of polysaccharide cellulose but also pectins. In the context of plant biorefinery, and valorization of biomass into biofuel, cellulose from beet pulp is very attractive but required pectin removal before fermentation. Hence the valorization of this latter fraction becomes crucial for the whole valorization of the beet pulp. Pectin has been identified as the polymer involved in the boron fixation in the plants and could be therefore applied for boron removal from water.
The Laboratoire de Chimie Agro-industrielle has been working on the plant fractionation, and particularly has demonstrated how to produce refined cellulose from beet pulp and optimized the pectin extraction. The valorization of this fraction could be possible as soil fertilizer, bringing the required dose of boron for the plants.
The first step of this work was to better understand the possible fixation mechanisms between boron and sorbent materials. Thus, properties and adsorption behavior of ion exchange resins and boron selective resins were investigated. Four synthetic resins were chosen including two anionic resins (Ambersep 900-OH and Amberlite IRA 402 Cl), and two boron selective resins
(Amberlite IRA 743 and Diaion CRB 03). During the second step, pectin extracts were characterized and then the efficiency of a hybrid system using these pectin extracts were studied.
This thesis is organized in 5 chapters as follow:
Chapter 1 is a state of the art which summaries knowledge related to boron. It describes in detail boron in environment, its impact on life development, its existence and properties in aqueous solution. A list of different boron removal technologies is presented and compared, based on their advantages and drawbacks. A specific part discusses mainly about the natural boron sorbents, which were already studied. A detail description of fixation mechanism of ion exchange and boron selective resin was found in this chapter with the kinetic and isotherm adsorption theory. The relationship between the isotherm shape in batch experiments and the breakthrough curves in column experiment was explained. Pectin extract as new adsorbents are presented with its occurrence in nature, composition, structure and its role in the development of plant.
Chapter 2 introduces the material and methods used in all experiments. It focuses on the batch and column experimental set-ups and then on the ultrafiltration systems. It describes the analytical and experimental procedures.
Chapter 3 presents results and discussion of boron fixation from kinetic and isotherm experiments on synthetic resins using batch reactors as a publication. The influence of pH on sorption isotherm is investigated in order to better understand the sorption mechanisms at different pH and at which pH, the maximum adsorption is achieved for each resin. Different kinetic and isotherm models are evaluated. The best fitting ones are chosen, and their parameters are calculated.
Chapter 4 shows the results of boron fixation on synthetic resins using column reactors with only two resins, the anionic resin Ambersep 900-OH and the boron selective resin, Amberlite IRA 743. This chapter presents the determination of pore volume of each resin, and then the influence of boron concentration and flow rate on the resin fixation efficiency. A comparison of reaction rate, retardation factor, boron adsorption capacities is done between the two resins. Final conclusion is given with respect to the main difference between two resins applying on continuous system. Different models are used to interpret data.
Chapter 5 summaries the boron removal from water using new adsorbents such as pectin extracts. Two types of pectin extract powders are characterized and compared. Solutions produced from these powders are filtrated, with different molecular weight cut-off membranes, in an agitated filtration cell. Influence of stirring and pressure allows selecting the best membrane that is characterized at larger scale with a hollow fiber membrane. Boron fixation using the two pectin extracts is operated in different pH conditions.
Chapter 1
1.1.
Boron presentation
1.1.1.
Introduction of boron
Boron is a rare chemical element on the Earth, which is originally formed due to the Big Bang and the Stars. Its presence on the Earth’s crust only accounts for 0.001% (10 mg L–1), never in the elemental form (Rudnick and Gao, 2005). In the high oxygen environment on Earth, boron is fully oxidized to borate, which is highly soluble in water. In aquatic environment, it can be mainly found in combined compounds such as borate and boric acid.
Boron was first discovered independently in 1808 by a British chemist Humphry Davy and a French chemist Joseph Louis Gay-Lussac, and then clearly identifiedas a chemical element in 1824 by Jöns Jacob Berzelius, a Swedish scientist (Lussac and Thenard, 1808; David et al., 1809). In Mendeleev periodic table, the letter B with atomic number 5 symbolizes for boron. Boron is metalloid element, which is light but very hard. The molar mass of boron is 10.81. Its electron configuration is 1s22s22p1. Because of having an empty orbital, boron has trend to make bonding with other rich electron elements to form different boron compounds. There are two popular allotropes of boron: amorphous form exists in brown powder form while crystalline boron is black and extremely hard(Cividini et al., 2009).
1.1.2.
Sources of boron
Boron is released into the environment by both natural processes and anthropic sources.
1.1.2.1.
Natural sources
Most common naturally occurring boron compounds are borate minerals, which are deposited from volcanic gases or hot springs near volcanic activities. There are more than 200 minerals in the world with two predominant deposits (borax and sassolite), which consist of different compounds of boron with sodium, calcium and magnesium, for example, kernite (Na2O.2B2O3.4H2O), colemanite (Ca2B6O11.5H2O), ulexite (NaCaB5O9.8H2O), sassolite (H3BO3) and boracite (Mg3B7O13Cl) (Indian Bureau of Mines, 2014). Boron can be found in rock, at a concentration of 5 mg L–1 in basalt to 100 mg L-1 in sedimentary shale or in soil (10 – 20 mg L–1). Moreover, boron also can be found in ambient air (average 20 ng m–3) (Smallwood
et al., 1998).
Boron is also found naturally in seawater with average value of 4.6 mg L–1. This value varied substantially depending on geography and location of ocean bodies such as in the Mediterranean Sea, the boron concentration is as high as 9.6 mg L–1. The concentration of boron in fresh water is usually from less than 0.01 mg L–1 to 1.5 mg L–1 depending on the influence of geochemical nature of the drainage area, proximity to marine coastal regions. Concentrations in surface and groundwater are generally in the order of a few tenths of 1 mg L–1, in rainwater typically below 10 µg L–1 but depend on input from industrial and municipal effluents (Wolska and Bryjak, 2013).
Besides, boron is found in plant, animal and human bodies as essential element, which is required for structural development. Different crop types are suitable with different doses of boron, from less than 1.0 mg L–1 for sensitive crops to above 2.0 mg L–1 for tolerant crops. For mammalian organism like animal and human, the safe and adequate dose for health ranges from 1 to 13 mg L–1 which is define by World Health Organization (Wolska and Bryjak, 2013).
1.1.2.2.
Boron sources from human activities
During industrial process, a big amount of boron has been introduced into environment as a waste. Hundreds years ago, boron has been utilized for making glass by Roman or borax clay product by Chinese. Nowadays, boron has wider application on variety industrial fields, for instance, glass fiber and porcelain as two major uses with durability improvement role, medicine, leather processing, adhesive, flame retardant, food grain preservation, soap, detergents, cleaners, fertilizer, herbicides, insecticides, gems manufacture due to its hardness property, textile industry as decolorizing agent, toothpaste and mouth wash solution due to germicidal nature, neutron absorber in nuclear reactor, boron neutron capture as an important treatment method for curing some cancers and arthritis (Smallwood et al, 1998)
Boron appears in surface water as the consequence of the discharge of treated sewage effluent. Its concentration varies in different regions, for example, the average value in Europe is smaller than 0.6 mg L–1, below 0.3 mg L–1 in Japan, South Africa and South America and below 0.1 mg L–1 in North American waters (Indian Minerals Yearbook, 2015).
1.1.3.
Boron and its effect on life development
Boron has been known for many years as an essential micronutrient element for the growing process of fruits and vegetables. It is vital to plant health due to its role in forming and strengthening cell walls, transporting sugar, developing hormone and nutrition balancing with others such as nitrogen, phosphorous, calcium and potassium. Therefore, adequate B nutrition is critical for high yields and quality of crops. However, it is not easy to control the proper amount of boron for each type of plant because the gap between deficiency and excess for this element is very narrow. Boron deficiency inhibits plant from the growth of meristematic tissue, cell formation and delays enzymatic reactions while boron toxicity shows the signs of yellow tips of leaves, defoliation, spots on fruits, decay and fall of unripe fruit. Consequently, these influences result in death of plants (Melnyk et al., 2005). So, in agricultural production, boron in irrigation water should not exceed 0.3 – 4.0 mg L–1 depending on the crop type and soil characteristic to avoid boron excess problem. To deal with the lack of boron in plant, proper type of fertilizer is considered making up the compensation. Different plants have different demands of boron for their development. There are three kinds of boron tolerances which are corresponding to three level of boron sensitivity of plants: sensitive plants: < 1.0 mg L–1, semi-sensitive plants: 1.0 – 2.0 mg L–1, tolerant plants: > 2.0 mg L–1 (Tu et al., 2010).
Numerous researches have indicated the necessary presence of boron in the physical and intellectual growth of animals and human even the amount should be provided every day is quite small, about 1 to 13 mg according to WHO. Nielsen reported that boron is a dynamic trace element which is required for bone development, brain and immune function, energy substrate
utilization and micro mineral metabolism (Nielsen et al., 1997). It is noted that boron deficiency has negative effects on composition and function of many parts of human and animal body. The lack of boron in animals can cause the reduction of other minerals absorption such as calcium, copper or nitrogen. Mammalian organisms that have excessive boron suffered from problems of cardiovascular, coronary, nervous and reproductive systems. It can change blood composition, caused disorder in neurological, physical, intellectual development. Particularly, excess of boron is very dangerous for pregnant women as it increases the risk of birth pathology. Greater dose of boron (> 500 mg/d) may cause nausea, vomiting, weight loss and diarrhea (Wolska and Bryjak, 2013).
1.2.
Boron in water production
1.2.1.
Water resources
Around 97% of the water in the world is in the oceans and approximately 2%- 2.5% of the water is in ice stored in glaciers and polar ice, although global warming is reducing this reservoir of fresh water. Hence, of all the water in the world, a mere 0.5%-1% is fresh water available for the needs of all plant, animal and human life (Haden et al., 2005; Shiklomanov et al., 1993). The over-exploitation of existing fresh water supplies is becoming a problem in many parts of the world. There are many causes in which the principal ones are known such as population growth, demands for higher living standards, growth of both agriculture and industry, and climate change. Globally, the main water consumption sectors are irrigation, urban, and manufacturing industry, especially irrigation in agriculture. It becomes more and more serious in the countries which are already suffered from increasing water shortages such as Greece, Spain, Southern Europe in general and the Middle East and North African (MENA) countries (Reid et al., 2010; El-Dessouky and Ettouney, 2002).
There is a number of ways in which the problem of increasing water shortage can be tackled such as the more economical use of water by reduction in wastage; the increased recycling of water by both industrial and domestic users; by the transfer of water from areas rich in water resources to areas of need - for example, the proposed use of a pipeline from Turkey to Israel and the use of canals and rivers in the UK to transfer water from one area to another (DEFRA, 2000), for example the use of the Cotswold Canals as a route for water to be pumped from the River Severn to the River Thames (Thames Water, 2014). Another way is the production of fresh water from brackish and seawater by a process called "desalination". Desalination refers to those processes that reduce the quantity of dissolved substances in the water fed to the process. Seawater tastes excessively salty and that in normal circumstances it cannot be drunk or used for normal domestic purposes such as washing and cooking. However, if this salt content could be reduced, it would then be possible to produce water suitable for drinking and other domestic purposes.
Nowadays, fresh water production is usually managed from seawater or polluted surface water. Consequently to the boron harmful effect, the WHO recommended the value of boron concentration in drinking water to be below 0.5 mg L–1 but the value in the guideline however has been revised to 2.4 mg L–1. Although this new change seems more relaxed for the drinking water than before, the requirement of 0.5 mg L–1 is still kept for irrigation water since the boron
demonstrates the herbicidal effect (Wei et al., 2011). As the boron can be high in many water resources, for example, in seawater it is around 4.5 mg L–1 (Xu and Jiang, 2008), water desalination requires high percentage removal for fresh water production.
1.2.2.
Boron chemistry in aqueous solution
In aqueous solution, boron is normally present as boric acid H3BO3 and borate anions (H2BO3- or B(OH)4-). Boric acid appears predominantly in aquatic environment with pH around 7 or 8. It is a water-soluble substance with solubility of 55 g L-1 at 25 ºC. Boric acid acts as a weak Lewis acid due to the electron deficiency of boron, thus it tends to combine with one OH- ion to become B(OH)4- in high pH medium (Wolska and Bryjak, 2013). There is formation of polyborates such as B5O6(OH)4-, B3O3(OH)4, B3O3(OH)52- and B4O5(OH)42- in solution at high concentration (> 1000 mg L–1) and at pH between 6 to 11 (Öztürk and Kavak, 2005).
Equilibrium of boric acid and borate (pKa = 9.2) can be expressed as follow:
H3BO3 + H2O B(OH)4− + H+ EQ 1.1
The pKa values indicates that with pH is smaller than 9.2, boron is mainly as boric acid species in the solution and borate ion becomes predominant fraction in alkaline conditions FIG. 1.1.
Fig. 1.1. Boric acid speciation as a function of pH (Calculation with VminteqA2)
Previous investigations showed that pKa is dependent on ionic strength and temperature of the solution. When the ionic strength increased, pKa is decreased due to change in borate ion activity and pKa changes from 9.08 to 9.38 as the solution changes from 10 ºC to 50 ºC due to the change in the pK of water (pKw) (Hilal et al., 2011; Oo et al., 2012).
0 10 20 30 40 50 60 70 80 90 100 7 7.5 8 8.5 9 9.5 10 10.5 11 % spei ce s pH H3BO3 H2BO -3
1.2.3.
Desalination plant for water production
1.2.3.1.
Types of desalination plants
Water desalination is one of the ways to solve the problem of the water resource limitation for the production of drinking water. There are, approximately, over 23,000 desalination plants in more than 150 countries treating over 85,000 m3/d with over half of them in the Middle East. The number of desalination plant is continuously growing in 2013-2014, about 564 new plants were contracted (Pankratz et al., 2014). Two kinds of desalination plants can be considered depending on the process, thermal plant and membrane plant.
In thermal desalination, the process is the distillation in which the heat is used to generate steam from the seawater that is then condensed to form water with a low salinity that can be used for domestic and industrial purposes or for irrigation (El-Dessouky and Ettouney, 2002). There are three main desalination techniques that use the principle of distillation and a couple of methods that have still to be proved on a commercial scale:
Multi-stage flash evaporation/distillation (MSF)
Multiple-effect evaporation/distillation (MED) also known as long-tube vertical distillation (LTV)
Vapor compression distillation (VCD) Solar distillation
Rapid spray evaporation.
In membrane desalination process, there are two categories. The first one is reverse osmosis (RO) where fresh water permeates under high pressure though the semi-permeable membranes to be separated from the highly concentrated brine solution. The second one is electrodialysis (ED) in which under the electrical current, the electrically charged salt ions are separated through selective ion exchange membrane, leaving the low salinity water flow. Between two processes, reverse osmosis is more common use in industrial applications.
1.2.3.2.
Membrane plant design
A membrane desalination plant is generally composed of reverse osmosis membranes as the core of the desalination process. Nevertheless, the required and completed process is complex and implies many steps as shown in FIG. 1.2.
a) Complete flowsheet
Optimal *
Fig. 1.2. Presentation of the complete flowsheet of a desalination plant (From Toray-Innovation by Chemistry, 2006)
At the first stage water must be disinfected before removal of the suspended matter, after coagulation if necessary. Usually disinfection is achieved through chlorine treatment and thus it is important to remove the free chlorine prior any membrane treatment. This step is usually done by adsorption with actived carbon that has the problem of releasing fine particle. A final filtration step is then required to prevent any blocking problem during reverse osmosis. Antiscalant and biocide are finally added before a preservative filtration.
b) Desalination configuration
Produced water using single stage RO can achieve boron concentration of 0.9 – 1.8 mg L–1. Newly seawater reverse osmosis membrane has been reported to obtain boron removal up to 91 – 93% while conventional RO membrane rejects boron at the level of 40 – 78% (Glueckstern and Priel, 2003; Koseoglu et al., 2008). In order to get low boron concentration in RO permeat, numerous designs has been developed. Typical designs involved the first stage of RO treatment with either a second stage of RO treatment or boron selective resin. The model is shown in the
Fig. 1.3. Boron removal processes of seawater desalination From (Redondo et al. , 2003)
1.3.
Study of boron removal technologies
1.3.1.
Reverse osmosis method
1.3.1.1.
Reverse osmosis principles
Osmosis is a process whereas a spontaneous transport of solvent from a dilute solution to a concentrated solution across an ideal semi-permeable membrane. The membrane impedes the passage of the solute but allow the flow of the solvent permeating it. This flow can be reduced by exerting a pressure on the high concentration solution (Fig. 1.4) (Öztürk et al., 2008). Osmotic pressure is the pressure on solution side of membrane at which the equilibrium is reached. When the exerting pressure is greater than the osmotic pressure, the flow reverses. The pure solvent will pass from the high concentration side to the low concentration side. This phenomenon is the basis of reverse osmosis (RO) of seawater desalination and water treatment. The raw water, product water and concentrated reject are called the feed, permeate and concentrate, respectively. Hence, reverse osmosis technology utilizes a pressure that is higher than osmotic pressure to force water passing through the semi-permeable membrane while rejecting dissolved species.
Fig. 1.4. Osmosis and reverse osmosis model From (Lawrence et al, 2011)
1.3.1.2.
Membrane separation mechanisms
Reverse osmosis membranes are supposed to be dense membrane. Thus, transfer of solvent and solute through the membrane is achieved by diffusion. Separation efficiency of the membranes depends on the difference of diffusivities of each molecule. Usually water diffusion is high while for larger molecule diffusion is low, and hence the rejection of the solutes appears very high at more than 99%. The transfer requires the dissolution of the molecule in the membrane material before diffusion as describe in the following figure for water. Hence, the interactions between the membrane and solute govern the efficiency of reverse osmosis and explain their large selectivity.
Fig. 1.5. Mechanism of water transport through reverse osmosis membrane by performing bridges of hydrogen
From (Rodríguez et al., 2001)
Usually charged molecule diffusion is low, and hence the rejection of the salt appears very high at more than 99%. But for neutral molecules the rejection rate by reverse osmosis is lower and sometimes there is almost no rejection. This mechanism explains the problem for boron removal during desalination process. The passage of non-dissociated boric acid to water through the membrane is high. The better rejection of borate ions can be understood according to the charge repulsion and size exclusion on the membrane. The dissociated borate form is fully hydrated in the solution that results in a larger radius and a charged enhancement of the ions. Therefore, ionized borates are more impeded on the negatively charge membrane. However, for neutrally charged boric acid form, the hydration causes smaller size of the molecule, thus less rejection is obtained. Boric acid in low pH solution, is able to make hydrogen bridge with the active groups of the membrane and diffuse in a similar way to that of water (Ezechi et al., 2012; Kabay et al., 2010).
1.3.1.3.
Effects of each parameter on boron rejection
The influence of affecting parameters such as pH, temperature, pressure, salinity or ionic strength, initial concentration and feed flow rate was considered in order to develop a reliable design to optimize the boron removal process.
Boron rejection has strong dependence on pH while initial concentration and feed flow rate seems to be negligible. Keseoglu and co-workers reported that a much higher boron rejection was reached at pH of 10.5 (> 98%) than those at natural seawater pH of 8.2 (about 85%- 90%) (Koseoglu et al, 2008). Boron rejection performance has been studied using different type of membranes (BW30LE, ESPA 2, ESPA B) and different transmembrane pressures (24, 30, 40 bars) at different pH (ph 7.6 and 9.6). It has also showed that boron removal efficiency
significantly increased from pH 7.6 to pH 9.6 (Teychene et al., 2013). At high pH, there is a transformation from boric acid to borate ion, which is in bigger size and easily impeded on the surface of membrane. Additionally, there is also strong repulsion between negatively charged active group of membrane and dissociated borate, results in higher rejection (Bonnélye et al., 2007). But at higher pH, the precipitation of calcium carbonate and magnesium hydroxide can block and degrade the membrane then after, reduce the filtration efficiency (Cengeloglu et al., 2008). In the solution of pH range 7 to 8, the boron rejection decreases to 50 – 70% due to the diffusion of dominant uncharged boric acid in the membrane (Hilal et al., 2011).
Increased feed salinity and/or temperature shows a decrease in boron removal Fig. 1.6. According to Oo and Song (2009), it might be explained as the effect of charge neutralization or hindering of membrane surface potential at high salt concentration. The decline of removing boron would be due to the electrostatic repulsion between borate ion and membrane surface is less dominant. Similar to salinity, increased temperature shows higher amounts of boron in permeate despite of higher portion of borate ion in the solution. It is possible to explain this phenomenon by the increase of total flux through RO membrane including salt flux at higher temperature (Magara et
al., 1998; Bick and Oron, 2005).
Increasing applied pressure also increases the permeate flux as well as the boron rejection (Bonnélye et al., 2007). Furthermore, complexation reaction can be a choice for enhancing boron rejection by adding mannitol or Fe which can cause the formation of large complexes in the solution (Qin et al., 2005; Geffen et al., 2006).
Fig. 1.6. The distribution of boric acid and borate in seawater by the changes of each parameter. (a) pH = 8, T = 25 ºc, pressure = 1 atm (b) pH = 8, salinity = 35 000 ppm, pressure = 1 atm (c) T = 25 ºc, salinity = 35 000 ppm,
pressure = 1 atm (d) pH = 8, T = 25 ºC, salinity = 34 800 ppm.
At industrial scale the solution that has been applied the addition of an extra reverse osmosis step after desalination, specific for boron removal, after pH increasing to 10.5. This procedure is expensive because it also required adding acid to neutralize the high pH to the water pH.
1.3.2.
Ion exchange methods
Several adsorbents are investigated and developed such as ion exchange resins, polysaccharides, oxides, synthesized clay, fly ash, layer double hydroxides, natural polymers but the most used are boron selective resins.
1.3.2.1.
Boron selective resins
1.3.2.1.1. Fixation mechanisms
Chelating resins or boron selective resins (BSRs) are the most effective and popular sorbents in boron adsorption techniques. Their component consists of two main parts: macroporous polymer supports and functional groups. Functional group consists of vis-diols and N-methyl-D-glucamine (NMDG) groups. Vis-diols groups, adjacent hydroxyl groups located in cis position, have high selectivity with boron by making different borate stable complexes (FIG. 1.7 to FIG. 1.9). Glucamine group controls pH of solution by capturing proton liberating during dissociated
reaction, thus the pH of the solution is kept to be unchanged or insignificantly changed (Li et
al., 2011; Xu and Jiang, 2008).
Fig. 1.7. Structure of borate complex From (Wang et al., 2014)
Fig. 1.8. Reactions during boron complex formation.
Adapted from (Yılmaz et al., 2005)
H3BO3 + H2O = B(OH)-4 + H (Boric acid dissociation) B(OH)-4 + 2-CHOH-CHOH- = 4 H2O + -CH-O B O-CH- O-CH- -CH-O (Boron complexation) -CH2-N(CH3)-CH2- + H+ -CH2-N + H(CH3)-CH2- (Amine protonation)
Borate complexes are formed in different steps
Fig. 1.9. Reactions during boron complex formation Adapted from (Kabay et al., 2010)
Researches that showed efficient adsorption performance of several boron selective resins has been published such as Amberlite IRA 743 (Amberlite XE 243), Amberlite IRN – 78 (Yılmaz et
al., 2005), Diaion CRB 02, Dowex XUS 43594.00, Purolite S108 and S110 (Kabay et al.,
2010).
1.3.2.1.2. Resin structure development
The conventional ion exchange polystyrene resin had been used for boron adsorption but it exposes two main disadvantages such as hydrophobic skeleton structure and small specific area surface. For more detail, hydrophobic structure is not favorable for the mass transfer process, which limits the efficiency of boron removal in aqueous media. Specific surface area is the factor that can increase adsorption quality through raising the crosslink rate of the functional group. Therefore, in order to improve the ability of boron adsorption of boron selective resins, two crucial features of supports, hydrophilic matrix and big specific surface area, are optimized. Numerous studies have been done to produce hydrophilic supports with large specific surface area such as polyacrylic acid resin, macroporous solid material, etc. Some NMDG-resins was modified on different polymers as new adsorbents, which obtained high obtaining boron adsorption capacity (10 mg g–1 to 25 mg g–1). A list of modified NMDG - resins is reported in TABLE 1.1 (Wang et al., 2014).