© Catherine Bourgault, 2019
Characterization and quantification of faecal sludge
from pit latrines
Thèse
Catherine Bourgault
Doctorat en génie des eaux
Philosophiæ doctor (Ph. D.)
Caractérisation et quantification des boues fécales issues
des latrines à fosses
Thèse
Catherine Bourgault
Sous la direction de :
Paul Lessard, directeur de recherche Caetano Chang Dorea, codirecteur de recherche
III
RÉSUMÉ
L’assainissement autonome (non raccordés à un système d’égout) est largement répandu dans les pays à faible revenu. Selon les estimations, 2.7 milliards de personnes seraient desservies principalement par des technologies d'assainissement individuelles, dont près de la moitié seraient situées en zones urbaines des pays en voie de développement (WWAP 2017). Or, l’ampleur de la couverture des installations sanitaires autonomes commence à poser de nombreux problèmes et défis techniques aux municipalités des régions concernées. En effet, l’augmentation croissante des fosses devant être vidangées, couplé aux manques d’organisation et de ressources, et à l’absence de connaissances précises sur les caractéristiques et les quantités de boues fécales générées, ne permettent pas actuellement d’assurer une vidange sécuritaire et de planifier la gestion efficace des boues fécales dans ces endroits. On estime ainsi que 74 % des fosses des installations sanitaires autonomes seront vidangées de façon non sécuritaire par année, c’est-à-dire que les boues fécales retirées seront déversées dans les cours d’eau ou terrains environnants sans traitement. Ainsi, dans la perspective d’organiser la gestion des boues fécales dans le contexte des pays en voie de développement, il conviendrait d’améliorer les connaissances sur les taux de remplissage des latrines à fosse, ainsi que sur les données de caractérisation des boues fécales.
L’objectif général de cette thèse est d’améliorer la gestion des boues fécales dans le contexte des pays en développement. Pour ce faire, une série d’expérimentations a été réalisée, s’attardant à des problématiques précises de caractérisation ou de quantification des boues fécales. De façon plus précise, la première étude (CHAPITRE 4) visait la modélisation du taux d’accumulation des boues fécales en utilisant une régression linéaire multiple. Les résultats obtenus revoient un modèle impliquant les valeurs du volume des fosses et de l’âge des latrines comme principale variables indépendantes. La valeur du coefficient de détermination (r2) qui a été obtenue est de r2 = 0.41. Ceci qui est légèrement supérieure à la valeur obtenue à l’aide du modèle de bilan de masse développé par Brouckaert et al. (2013), pour lequel seulement 50% des latrines étaient à moins de 40% d’erreurs.
Par la suite, des travaux visant la caractérisation de l’effet inhibitif de l’azote ammoniacal sur la digestion anaérobie des boues fécales au sein des fosses ont été réalisés (CHAPITRE 5). L’objectif était de valider l’hypothèse selon laquelle les fortes concentrations en azote au sein des fosses (causées par la présence d’urine) influenceraient les mécanismes de biodégradation, et conséquemment les taux d’accumulation. La méthodologie développée à d’abords été testée et validée avec des boues de digesteur anaérobie (provenant d’un réacteur complètement mélangé). Par ailleurs, le protocole développé n’a pas mené à des résultats concluants en utilisant des boues fécales. Effectivement, bien que plusieurs tests d’activité méthanogène spécifique (specific methanogenic activity - SMA) aient été réalisées (en changeant le ratio inoculum (boues)/substrat (acétate), et la durée), aucun des tests exécutés n’a démontré une production de méthane. À la lumière des résultats précédents (CHAPITRE 5), des travaux supplémentaires ont été réalisés visant à caractériser l’activité microbienne des boues fécales et de la matière fécale fraîche en termes des populations spécifiques à la digestion anaérobie (e.g. bactéries hydrolytiques et fermentatives, et méthanogènes méthylotrophes, acétoclastiques ou hydrogénotrophes) (CHAPITRE 6). Pour ce faire, la méthodologie utilisée consistait à mesurer la production de gaz (comme indicateur de l’activité microbienne) des échantillons de boues mélangés avec différents substrats spécifiques (e.i. acétate, méthanol, formate, glucose). Les résultats issus de cette étude ont démontré que l’utilisation des substrats de formate et de glucose présente l’activité microbienne la plus élevée lorsque mélangés avec une solution de matière fécale fraîche (soit de 112.17 et de 76.41 ml gaz/ g SV, pour le formate et le glucose, respectivement). Alors que l’utilisation des substrats de glucose et de méthanol ont résulté à l’activité la plus élevée avec des solutions de boues fécales plus âgées (soit de 129.15 et de 85.42 ml gaz/ g SV, pour le méthanol et le glucose, respectivement). Par ailleurs, une absence de l’activité méthanogène a été observé
en utilisant de l’acétate comme substrat pour les deux types de boues. Ces résultats concordent avec la littérature, où des tests de séquençages d’ADN n’ont pas mené à l’identification des archaea méthanogènes acétoclasitques au sein d’échantillons de boues fécales issues de latrines à fosses (Byrne 2016, Torondel 2017). Les résultats issus de cette étude remettent donc en perspective la présence d’une digestion anaérobie acétoclastique au sein des fosses, hypothèse qui est largement présumée dans de nombreux guides de conception des latrines à fosses conventionnelles.
Finalement la dernière étude constituait une étude préliminaire sur la caractérisation des propriétés de séchage de la matière fécale fraîche (CHAPITRE 7). Plus particulièrement par la détermination et par la modélisation des isothermes de sorption. Cette étude s’inscrit dans le cadre actuel où les techniques de séchage pour le transport efficient des boues gagnent en popularité, alors qu’un manque de données sur les propriétés des boues persiste. Ainsi, les résultats obtenus démontrent que les isothermes de sorption tendent à suivre une forme sigmoïde, laquelle est caractérisée par deux points d’inflexion de surface et une augmentation rapide de la teneur en eau à des valeurs d'humidité relative supérieures à 75 % HR. D’une première part, ceci signifie que la teneur en eau de la matière fécale semblerait être plus facile à extraire jusqu'à une valeur d’environ 1 à 1.5g H2O/g d’échantillon - base humide. D’autre part, le modèle de
Guggenheim-Anderson-de Boer (GAB) sembleraient être le plus approprié pour décrire les courbes d’isothermes, avec une estimation acceptable (Pr (>|t| > 0.05).
V
TABLE OF CONTENTS
RÉSUMÉ ... III
LIST OF TABLES ... X
LIST OF FIGURES ... XII
LIST OF ACRONYMS ... XIV
REMERCIEMENTS ... XVI
AVANT-PROPOS ... XVIII
1. INTRODUCTION ... 1
2. LITERATURE REVIEW ... 4
2.1 ON-SITE SANITATION: PIT LATRINE COVERAGE ... 4
What is a pit latrine? ... 4
Design criteria of pit latrines ... 5
Pit latrine coverage in the world ... 5
2.2 CONSEQUENCES ASSOCIATED WITH POOR PIT LATRINES MANAGEMENT ... 6
2.3 FAECAL SLUDGE MANAGEMENT ... 7
2.4 FS ACCUMULATION RATE IN PIT LATRINES ... 9
Pit design criteria... 9
Field studies on measurement of FS accumulation ... 10
Emptying frequency ... 13
Modelling of pit filling rate ... 18
2.5 FACTORS AFFECTING ACCUMULATION RATES OF FS IN PITS ... 20
Biodegradation mechanisms related parameters ... 25
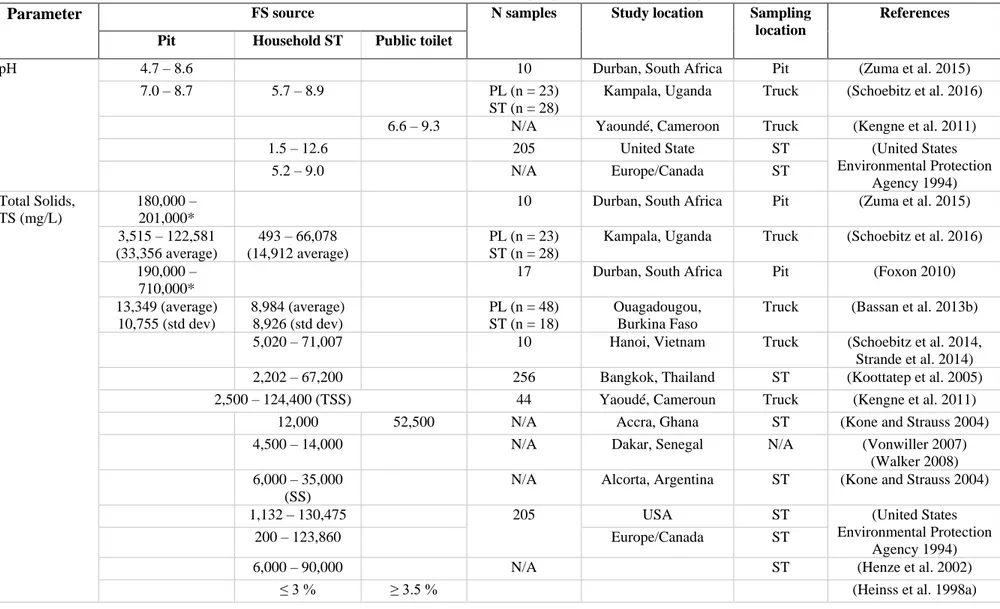
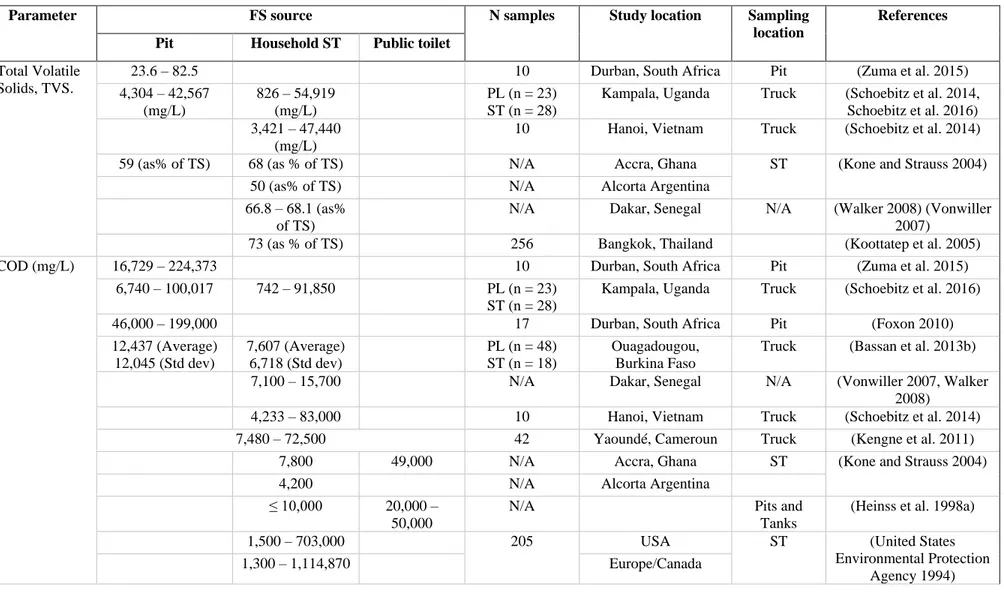
2.6 FAECAL SLUDGE CHARACTERISTICS ... 32
FS from different type of sanitation systems ... 38
Effects of sludge age on faecal sludge properties ... 39
Faecal sludge characterization from sampling point ... 39
From rainy season to dry season ... 40
2.7 CONCLUSION ... 40
3. OBJECTIVES OF THE THESIS ... 43
3.1 OUTLINE OF THE THESIS ... 44
4. MULTIPLE LINEAR REGRESSIONS ANALYSYS FOR FS ACCUMULATION RATES PREDICTIONS ... 46
4.1 INTRODUCTION ... 46
4.2 METHODOLOGY ... 47
Data collection ... 47
Multilinear regression model ... 48
4.3 RESULTS AND DISCUSSION ... 48
Modelling the accumulation rate ... 48
Validation of the coefficients ... 49
Analysis of model residuals ... 51
Model validation ... 52
4.4 CONCLUSION ... 54
5. THE CHARACTERIZATION OF THE AMMONIA INHIBITION OF ANAEROBIC DIGESTION OF FAECAL SLUDGE SAMPLES ... 56
VII
5.2 MATERIAL AND METHODS ... 57
Fresh faeces, faecal sludge and anaerobic sludge sampling ... 58
Preparation of the diluted faecal sludge for the SMA test ... 60
Source of nitrogen ... 60
Nutrient solution ... 60
SMA-based anaerobic toxicity assay ... 61
Validation of the SMA-based anaerobic toxicity assay protocol ... 62
5.3 RESULTS AND DISCUSSION ... 63
Characterization of the FF and FS ... 63
Validation of the SMA-based anaerobic toxicity assay protocol ... 65
Characterization of ammonia inhibition on fresh faeces and faecal sludge ... 67
General Discussion ... 69
5.4 CONCLUSION ... 70
6. SPECIFIC METHANOGENIC ACTIVITY TESTS FOR THE CHARACTERIZATION OF MICROBIAL ACTIVITY INTO PIT LATRINE ... 71
6.1 INTRODUCTION ... 71
Microbial ecology of anaerobic digestion ... 71
Methanogens from the human gut ... 74
Microbial ecology of pit latrines ... 74
Microbial ecology of untreated wastewater – from conventional sewage ... 76
6.2 MATERIAL AND METHODS ... 79
Fresh faeces and faecal sludge sampling ... 79
Choice of substrate for the SMA test ... 80
SMA-based anaerobic assay ... 80
Biomethane potential (BMP) test ... 81
6.3 RESULTS AND DISCUSSION ... 82
BMP test of FS and FF ... 82
Validation: SMA anaerobic sludge from a CSTR ... 83
SMA from faecal sludge solution ... 86
SMA from faeces solution ... 88
General Discussion ... 90
6.4 CONCLUSION ... 92
7. MEASURING MOISTURE SORPTION ISOTHERM OF FRESH FAECES ... 93
7.1 INTRODUCTION ... 93
Moisture distribution characteristics measurement methods ... 94
Moisture sorption isotherm ... 95
Modelling of the moisture sorption isotherm ... 97
7.2 MATERIALS AND METHODS ... 97
Fresh faeces sampling and initial characterization ... 98
Determination of sorption isotherms ... 98
Mathematical models of the sorption isotherm ... 101
7.3 RESULTS ... 101
Fresh faeces characterization ... 101
Moisture sorption isotherm from two different sample masses ... 102
Modelling of isotherms ... 103
7.4 CONCLUSION ... 108
8. DISCUSSION GÉNÉRALE ... 110
8.1 MODELISER LES TAUX D’ACCUMULATION DES BOUES FECALES AU SEIN DES LATRINES A FOSSES ’ ’ ... 110
IX
Limites de l’étude et recommandations... 110
8.2 CARACTERISER L’IMPACT DEL’AZOTE AMMONIACAL SUR LES PERFORMANCES DE DIGESTION ANAEROBIE DES BOUES FECALES ET DE LA MATIERE FECALE ... 111
Limites de l’étude et recommandations... 112
8.3 CARACTERISER L’ACTIVITE MICROBIENNE DES BOUES FECALES ET DE LA MATIERE FECALE EN TERMES DES POPULATIONS SPECIFIQUES A LA DIGESTION ANAEROBIE ... 113
Limites de l’étude et recommandations... 114
8.4 DETERMINER LES CARACTERISTIQUES DE SECHAGE DE LA MATIERE FECALE FRAICHE ... 115
Limites de l’études et recommandations. ... 116
9. CONCLUSION GÉNÉRALE ... 117
10. REFERENCES ... 120
ANNEX 1: DATA ... 130
10.1 TODMAN ET AL.(2014) ... 130
10.2 FOXON AND STILL (2012) ... 131
10.3 SCHOEBITZ ET AL. (2016) ... 131
ANNEX 2: NORMALITY OF THE DATA ... 134
LIST OF TABLES
Table 2-1 Types of pit latrines (Nikiema et al. 2017) ... 4
Table 2-2 Proposed accumulation rate (liters per capita per year, l/cap/yr) for pit latrine design purposes (Wagner and Lanoix 1958) ... 10
Table 2-3 Overview of studies that have focused on the measurement of accumulation rate. ... 12
Table 2-4 Estimate of the emptying frequency of pit latrine ... 13
Table 2-5 The faecal sludge accumulated in on-site sanitation facilities in 30 cities of Africa and Asia (Chowdhry and Kone 2012) ... 17
Table 2-6 Parameters of the Brouckaert et al. (2013) pit filling rate model ... 18
Table 2-7 Summary of studies assessing FS accumulation rates (L/cap/day) or FS biodegradation and characteristics, with factors that influence them (adapted form (Nakagiri et al. 2015) ... 21
Table 2-8 Summary of studies assessing FS accumulation rates (L/cap/day) or FS biodegradation and characteristics, with factors that influence them (adapted form (Nakagiri et al. 2015) (cont’d) ... 21
Table 2-9 Operating conditions of the anaerobic digestion process ... 29
Table 2-10 Claims made for pit latrine additives and the reality (Foxon and Still 2012) ... 32
Table 2-11 Physical and chemical properties of faecal sludge ... 34
Table 2-12 Faecal sludge characterization from different type of containments (Koottatep et al. 2013) ... 37
Table 2-13 Differences between dry and rainy season (Bassan et al. 2013) ... 40
Table 2-14 Gaps in characterization and quantification of FS ... 41
Table 4-1 Summary of regression coefficients for models for subsets of the data. ... 49
Table 4-2 Analysis of variance table ... 49
Table 5-1 Methods used for the physico-chemical characterization of FF and FS samples ... 59
Table 5-2 Nutrient medium recipe (adapted from Angelidaki et al. 2006) ... 61
XI
Table 5-4 Physico-chemical parameters of faecal sludge and fresh faeces samples (n=4) ... 64
Table 5-5 COD of fresh feaces from literature (adapted from (Rose et al. 2015) ... 64
Table 5-6 Average methane production of anaerobic sludge in response to varied (NH4)2CO3 concentrations (n=3) ... 66
Table 5-7 Summary of SMA results for both FS and FF – ISR between 2.08 – 35.28 ... 68
Table 6-1Stoichiometric equation and change of free energy of some acetogenic reactions ( at NTP – assuming neutral pH and (Henze 2008) ... 73
Table 6-2 Proportion of the main phylogenetic groups among different digesters ... 77
Table 6-3 Characteristics of inoculum and substrate ... 83
Table 6-4 Characteristics of the anaerobic sludge from the CSTR ... 84
Table 6-5 SMA results – anaerobic sludge CSTR ... 85
Table 6-6 Characteristics of the faecal sludge solution (n=3) ... 87
Table 6-7 SMA results – faecal sludge solution ... 87
Table 6-8 Gas analyses for each substrate – faecal sludge solution... 88
Table 6-9 Characteristics of the fresh faeces solution (n=3) ... 89
Table 6-10 SMA results – fresh faeces solution ... 89
Table 6-11 Gas analyses for each substrate – fresh faeces solution... 90
Table 6-12 Compilation of SMA results ... 90
Table 7-1 Relative humidity (%) of the saturated salt solution at 35°C (CRC, 1977) ... 100
Table 7-2 Isotherm models used for fitting experimental data ... 101
Table 7-3 Characteristics of fresh faeces (n=6) ... 102
Table 7-4 Linear regression results for linearized BET model ... 105
LIST OF FIGURES
Figure 2-1 Population (%) served by different types of sanitation systems (WWAP 2017) ... 6
Figure 2-2 Gaps in faecal sludge management (Strande et al. 2014) ... 8
Figure 2-3 Comparison between the observed and simulated filling rates . ... 19
Figure 2-4 Four stages theoretical model of FS digestion into pits (Buckley et al. 2008) ... 26
Figure 2-5 Evolution of total COD and organics solids (%) as a function of pit latrine depth (n = 16 at the same time), from fresh faeces (adapted from Nwaneri, 2009) ... 28
Figure 4-1Comparison between the observed and simulated filling rates. Solid diagonal represents the perfect fit. Results of the highest accumulation rates observed are circled. ... 50
Figure 4-2 Comparison between the observed and simulated filling rates. ... 51
Figure 4-3 Analysis of model residuals ... 52
Figure 4-4 Plot of predicted value against the observed values of log transferred accumulation rate (log L/yr) for (red squares), (Still and Foxon 2012b) (green circles) and (Schoebitz et al. 2016)(blue diamonds) ... 53
Figure 5-1 Faecal sludge sampling at Parc de la Jacques-Cartier. Sampling device and sampling interface are shown in the left picture, and FS consistency is shown in the right picture. ... 59
Figure 5-2 SMA tests with anaerobic sludge and different concentrations of total ammonia nitrogen ... 66
Figure 5-3 SMA tests with faecal sludge and different concentrations of total ammonia nitrogen (ISR = 2.18) ... 68
Figure 6-1 Anaerobic digestion pathway and the microorganisms involved (Cavinato et al. 2017) ... 72
Figure 6-2 Cumulative methane production from FS and FF sample as a substrate and CSTR sludge as the inoculum ... 83
Figure 6-3 SMA (ml CH4/g VS) for anaerobic sludge ... 84
XIII
Figure 7-1 General shape of sorption isotherms for a hypothetical biological matrix showing the relationship between water content (Xeq) and water activity (aw) (adapted from (Vaxelaire 2001) ... 96 Figure 7-2 Experimental set-up for the MSI determination ... 99 Figure 7-3 Boxplot of equilibrium moisture content data for each given relative humidity at a temperature of 35˚C and an initial faecal sample with mass a) 1.5 g and b) 5g ... 102 Figure 7-4 Estimation of constants C and Mo for BET equation - linear regression on
𝒂𝒘
(𝟏−𝐚𝐰)𝑴 as a function of aw ... 105
Figure 7-5a -1.5g and 7-5b-5g faeces as initial mass. Experimental data (.)(Average) and predicted values; BET (___), GAB (---), FH (…) model predicted adsorption at 34C. ... 106
LIST OF ACRONYMS
Acronyms Definition
Aw Water Activity
BOD5 [mg/l] Biological oxygen demand
Cap Capita
COD Chemical oxygen demand
CSTR Continuous stirred-tank reactor
DW Dry weight
FS Faecal sludge
FF Fresh faeces
FSM Faecal sludge management
GW Groundwater
HH Household
ISR Inoculum to substrate ratio
NH3 Ammonia
N/A Not available
OSS On-site sanitation system
PL Pit latrine
ST Septic tanks
SMA Specific methanogenic activity
SVI [ml/g TSS] Sludge Volume Index
TN Total nitrogen
TAN Total Ammonia Nitrogen
TSS [mg/l] Total suspended solid
TS Total solids
VSS [% SS] Volatile suspended solid
VIP Ventilated improved pit
VS Volatile solids
XV
¨Y en a qui ont tout’ pis tout’ les autres, y ont rien. Change-moi ça.¨ Richard Desjardins
REMERCIEMENTS
La liste de remerciements sera longue! Si un doctorat peut être considéré comme étant un cheminement individuel, il s’appuie, se construit, et serait impossible sans l’aide et les encouragements de plusieurs personnes et organismes que je tiens sincèrement à remercier.
Mes remerciements vont tout d’abord à mon directeur et mon co-directeur de recherche, le professeur Caetano Dorea et le professeur Paul Lessard, pour m’avoir soutenu dans toute cette aventure. Leurs nombreux conseils et remarques ont énormément contribué à l’avancement de mes travaux. Qu’ils en soient remerciés. Qu’ils soient aussi remerciés pour leur gentillesse, leur disponibilité et pour les nombreux encouragements qu’ils m’ont donnés tout au long de mes travaux de recherche. Et sans doute le plus important, je les remercie pour avoir cru en moi. Ainsi, ils m’ont donné le plus précieux des cadeaux : la confiance.
Je tiens également à remercier très sincèrement le prof. Chris Buckley, qui m’a soutenue lors de mon séjour en Afrique du Sud. Et tellement plus! Sa rencontre a été pour moi un point tournant dans mon cheminement, tant au niveau professionnel que personnel. Sa générosité et son attitude toujours enthousiaste à répondre à mes nombreuses questions ont certainement contribué à amener ma recherche à un autre niveau. Aussi, je lui suis extrêmement reconnaissante pour m’avoir présentée à de nombreux chercheurs du domaine. De chaleureux remerciements vont également à toute l’équipe du Pollution Research Group de l’Université du Kwazulu-Natal, en Afrique du Sud, pour laquelle j’éprouve désormais une grande affection.
Mes remerciements vont également au professeur Peter Vanrolleghem, au Dr. Yann Lebihan et Dr. Josiane Nikiema pour leurs disponibilités, ainsi que pour leurs conseils et avis donnés sur de nombreux sujets. Leurs expertises ont contribué de façon importante à l’orientation du projet et à mon cheminement professionnel. Je tiens également à remercier la professeure Céline Vaneeckaute pour avoir accepté de faire partie de mon jury de thèse.
De plus, ce travail n’aurait pas été possible sans le soutien du Conseil de recherches en sciences naturelles et en génie du Canada (CRSNG) qui m’a permis, grâce à la bourse de recherche Alexander-Graham-Bell, de me consacrer pleinement à l’élaboration de ma thèse. De plus, cette recherche a également été supportée par le programme de bourse à la découverte du CRSNG en lien avec les travaux du professeur Dorea. Merci également à Aerosan Toilets pour leur contribution à la partie séchage des boues de ma thèse.
XVII
Ma profonde reconnaissance va à mes collègues et amis du département de génie civil et de génie des eaux de l’Université Laval. Je me considère tellement chanceuse d’avoir pu cheminer dans mes études étant entourée d’une telle équipe. Un merci particulier à Stephanie Guilherme, Antoine Thiboult, Thomas Maere, Elena Torfs, Cyril Garneau, Sylvie Leduc, Queralt Plana Puig, Sovanna Tik, Julia Ledergerber, Maxine Dandois-Fafard, Jean-David Therrien et Bernard Patry pour m’avoir toujours écoutée, et pour avoir partagé mes problèmes et victoires. Je suis profondément honorée de pouvoir désormais les compter parmi mes amies les plus chers. Go go go, on ne lâche pas !! ☺
Merci également à Michel Bisping pour son soutien dans l’élaboration de mon montage et pour ses nombreux conseils. Merci au secrétariat du département de génie civil et de génie des eaux de l’Université Laval pour son support avec mes nombreuses questions administratives. Je tiens également à remercier particulièrement Claire Remington, étudiante à la maîtrise de l’Université de Victoria, pour m’avoir aidé dans la vérification de l’anglais de mon document de thèse. Je tiens à souligner sa générosité et la remercie pour être une si belle personne.
Et finalement, il m’est impossible d’oublier ma merveilleuse famille, mes parents, ma sœur, mon beau-frère, leurs enfants, Clara et Philippe, ainsi que mon meilleur ami et amoureux, Tom. Pour eux, les mots me manquent. Je leur dois tellement que l’écriture ne me permet pas d’exprimer la hauteur de mes sentiments à leurs égards. J’ose espérer qu’ils le savent…
AVANT-PROPOS
Avant d’entreprendre la lecture de cette thèse certaines informations doivent être mentionnées. Premièrement, sur le choix de la forme; la thèse se divise en 9 chapitres, dont 4 rapportent les travaux expérimentaux. Ces chapitres sont écrits sous forme d’article scientifique et rédigés en anglais afin de faciliter leurs publications. Un article et une courte communication ont d’ailleurs été soumis entre la date de la soutenance et le dépôt final de cette thèse, lesquelles sont présentés en ¨ANNEX 3¨. Plus précisément, voici la description des articles soumis:
Bourgault C, Lessard P, RemingtonC, and Chang Dorea C, (2018). Experimental determination of moisture sorption isotherm of faecal sludge, Manuscript submitted on December 4th for publication in
the Water Journal. Accepted.
Bourgault C, Lessard P, and Chang Dorea C, (2018).Pit latrine design: Is it rocket science after all? Manuscrit submitted on September 12th for publication in the npj Clean Water journal. Under
review.
Deuxièmement, il convient également de mentionner que cette étude fut la première sur le sujet des boues fécales à être réalisée à l’Université Laval. C’est-à-dire qu’aucune autre étude n’a été réalisée sur ce sujet avant celle-ci. Un temps considérable a donc été consacré à l’élaboration et l’adaptation des protocoles d’échantillonnage et de caractérisation des boues.
1
1. INTRODUCTION
Dans les pays à faible revenu, les services d’assainissement sont souvent insuffisants et inefficaces, ceci notamment en raison d’un manque de ressources pour assurer une vidange sécuritaire des installations à fosse (e.g. latrine à fosse, fosse septique), de même qu’une insuffisance de stations de traitement fonctionnelles et adaptées aux boues fécales. Ce manque d’organisation sanitaire entraîne de nombreuses conséquences, dont notamment les rejets d’eaux usées non traitées dans l’environnement. En effet. si l’on estime qu’environ 70% des eaux résiduelles municipales et industrielles seraient traité dans les pays à revenu élevé, dans les pays à faible revenu, seul 8% de ces eaux usées subirait un traitement, quel qu’il soit (WWAP 2017). La mauvaise gestion sanitaire entraîne également la prolifération des maladies fécales-orales tels que le choléra et la typhoïde. Selon l’Organisation Mondiale de la Santé, environ 2 millions de personnes meurent chaque année suite à de fortes diarrhées, les cas les plus répertoriés étant les enfants de moins de cinq ans (UNICEF/WHO 2011). Aussi, on estime que l’Afrique subsaharienne perd environ 5 % de son PIB à cause du manque d’assainissement, soit quelque 28,4 milliards de dollars chaque année (WWAP 2017). En effet, en affectant directement la qualité de vie, la capacité de travail et l’éducation, un manque d’assainissement pèsera lourdement sur le dynamisme de l’économie. Une amélioration de l’offre des services sanitaires s’avère indispensable.
Or, la mise en place d’une gestion sécuritaire et efficace des boues fécales n’est pas une chose simple. Parmi les principaux obstacles, mentionnons la disponibilité des données de caractérisation et de quantification des boues fécales qui demeure un défi persistant. Comparativement à la caractérisation des eaux usées domestiques issues des systèmes de traitement centralisés (principalement retrouvés dans les pays à revenu élevé), la caractérisation des boues fécales est moins bien documentée, voire carrément négligée dans plusieurs endroits. Ce manque de données peut entraîner des conséquences et des coûts importants, comme l’a démontré une étude portant sur la station de traitement des eaux usée de Ouagadougou, où une mauvaise
évaluation des charges organiques à traiter aurait conduit au surdimensionnement de la station; la capacité de la station serait deux fois plus grande que nécessaire selon l’étude (Bassan et al. 2013a). L’exemple de Ouagadougou n’est certainement pas le seul. En effet, d’après une analyse de 2013, sur les 181 pays de l’étude, il a été démontré que seul 55 disposent d’information sur la génération, le traitement et l’utilisation des eaux usées, et les autres ne disposent que d’information partielle ou n’en ont pas du tout (Sato et al. 2013).
Ce projet de recherche vise à répondre à la problématique de caractérisation et de quantification des boues fécales, en se consacrant seulement sur les boues fécales issues des installations sanitaires autonomes de type latrines à fosse. Dans une première partie, une revue approfondie de l’état des connaissances sur l’utilisation des latrines, leurs caractéristiques, ainsi que sur les recherches antérieures portant sur la quantification des taux d’accumulation et sur la caractérisation des boues fécales sera présentée. Par la suite, selon une analyse des besoins ressortant de la littérature, une série d’expérimentations a été réalisée, s’attardant à des problématiques précises de caractérisation ou de quantification des boues fécales. De façon plus précise, la première étude (CHAPITRE 4) s’attarde à la modélisation des taux d’accumulation des boues fécales en utilisant une régression linéaire multiple. Par la suite les chapitres 5 et 6 constituent le cœur de la thèse en présentant les méthodes développées pour caractériser l’activité méthanogène au sein des fosses, le but étant d’étudier les principales conditions opératoires favorables (ou non) au développement des archaea méthanogènes au sein des fosses. Ceci est un sujet important visant à améliorer la compréhension des mécanismes de biodégradation des boues fécales, et par extension à la prédiction des caractéristiques des boues fécales et taux d’accumulation au sein des fosses. Finalement la dernière étude constitue une étude préliminaire sur la caractérisation des propriétés de séchage de la matière fécale fraîche, plus particulièrement sur la détermination et la modélisation des isothermes de sorption. Cette étude s’inscrit dans le cadre actuel où les techniques de séchage pour le transport efficient des boues gagnent en popularité, alors qu’un manque de données sur les propriétés des boues persiste.
3
Finalement, dès lors que l’on s’intéresse aux problématiques environnementales, on constate rapidement les nombreuses répercussions que celles-ci ont sur des milliers d’individus. La précarité de l’assainissement mondial en est un bon exemple. En effet, malgré de nombreux progrès visibles, le manque d’installations sanitaires demeure encore aujourd’hui une menace grave pour l’ensemble de la planète, laquelle pourrait inverser des décennies d’innovation si elle n’est pas traitée. Le message est donc clair; il faut s'attaquer à cette problématique de façon inclusive et coordonnée. Ce projet de recherche agit en ce sens.
2. LITERATURE REVIEW
2.1 On-site sanitation: pit latrine coverage
What is a pit latrine?
Pit latrines (PLs) are the simplest form of dry sanitation systems1, typically consisting of a pit dug in the ground covered with a slab for ease of use and a superstructure for user privacy. Although that is the basic design of a pit, it can vary in construction according to available water/space/construction materials, cultural norms, emptying practices, soil/hydrogeological conditions, climate, construction/operation/maintenance costs, etc. A summary of PL variants is described in Table 2-1
Table 2-1 Types of pit latrines (Nikiema et al. 2017) Type of latrine Description
Traditional PLs - commonly used in developing countries, e.g. Africa, Latin America and Asia - consist of a simple pit, covered with logs
- sometimes have walls - usually have no roofs
- easy to build and require no specialized skills Slit-trench latrines - the simplest type of pit latrine
- consist of a narrow (3 to 6 feet) trench, which is 1 to 2 meters deep
- used by squatting, with the user’s feet positioned on either side of the trench
- can have various structures for sitting on or leaning against (e.g. logs, planks, branches) placed horizontally over the vertical pit
Conventional improved PLs
- similar to the traditional latrine, but built from solid materials, such as bricks - usually have walls and roofs
- can be improved by putting ashes in the latrine to reduce smells and flies Double PLs - consist of two shallow pits that are used alternately
- built with a single concrete slab and superstructure that is mounted over one of the two shallow pits
- considers recycling of materials Ventilated improved
pit (VIP) latrines
- consist of the normal pit, but with a pipe (vent pipe) fitted to the pit and a screen (fly screen) at the top outlet of the pipe.
- an improvement to overcome fly, mosquito nuisance and odours Pour-flush latrines - are most common in southern Asia
- have a water seal fitted to the drop hole, which prevents smells and flies from entering the shelter or superstructure through the pit
- requires water to flush the toilet
- could experience problems if water is scarce and/or with the water seal
1 Dry systems may include water. However, the amount of water used is low. In particular, faecal sludge is considered
5
Table 2-1 Types of pit latrines (Nikiema et al. 2017) (cont’d) Type of latrine Description
Twin pit water seal toilet
- main components of such a toilet are the water seal pan/ trap arrangement, squatting platform, junction chamber, two pits and a superstructure
- junction chamber has one inlet and two outlets (connected to the leach pits) Single offset pit
water seal toilet
- consists of water seal pan, a temporary platform, a junction chamber, a temporary/permanent superstructure and a single pit
- pit is constructed away from the squatting platform and connected to the same by a pipe through a junction chamber
Eco-san toilets - dry toilet, based on recycling principles: urine is collected separately from feces - consist of double vault compost latrines (two water-tight chambers)
Design criteria of pit latrines
According to best practices, pit latrines should be at least 30 meters from all water sources, and the bottom of the pits should be at least 1.5 meters above the hydrostatic level (Sphere Project 2011). As for the dimensioning of the pits, the model proposed by Mara (1984) is still widely used (Eq.2.1). Mara’s model calculates that the volume of the pits is equal to the rate of accumulation multiplied by the number of users and the life of the pits :
Volume of pits = r (accumulation rate) (l/cap/yr) x P (number of users) x n (lifetime) (year) (Eq.2.1)
In practice, such a model may not always be respected; the dense conditions encountered in urbanized areas may allow for the digging of pits at an ideal size and, as will be seen in the following section, it is difficult to accurately estimate the rate of sludge accumulation.
Pit latrine coverage in the world
As we can see on Figure 2-1, approximately 1.3 billion people rely on some form of pit latrine systems as their primary mean of sanitation worldwide, most being used in developing countries (95%). This based on the population with faecal sludge management (FSM) demand and the percentage of the population served by dry or flush/poor flush pit latrines (yellow circles and light blue and blue section of (Figure 2-1)). Sewer
connections are mostly found in high-income countries, in middle-income countries of Latin America and in some urban areas in China (Kjellén et al. 2011). In general, the number of households connected to sewer systems correlates (to a greater or lesser extent) with the connections to a water supply, although always in much lower proportions (WWAP 2017).
Figure 2-1 Population (%) served by different types of sanitation systems (WWAP 2017)
2.2 Consequences associated with poor pit latrines management
In many urban regions of the world, the increasing number of pit latrines is causing numerous problems and technical challenges. Many municipalities have not yet put the necessary strategies, policies and budgets in place to maintain (e.g. desludging and treatment) these on-site sanitation systems, resulting in the contamination of the environment (Strande et al. 2014), and directly affecting the quality of life, the working capacity of the inhabitants, the education and the economy. It is estimated that only 26% of urban
7
and 34% of rural sanitation and wastewater services worldwide effectively prevent human contact with excreta along the entire sanitation chain and can therefore be considered safely managed (Hutton and Varughese 2016). On average, high-income countries treat about 70% of the municipal and industrial wastewater they generate. That ratio drops to 38% and to 28% in upper income and lower middle-income countries respectively, and in low-middle-income countries, only 8% undergoes treatment of any kind (WWAP 2017). As a result, water pollution is worsening in most rivers across Africa, Asia and Latin America. In the seas and ocean, de-oxygenated dead zones caused by the discharge of untreated wastewater are growing rapidly, affecting an estimated 245,000 km2 of marine ecosystems, impacting on fisheries, livelihoods and food chains (WWAP 2017). Furthermore, poor wastewater management leads to the proliferation of faecal-oral diseases such as cholera and typhoid. According to the World Health Organization (WHO), approximately 2 million people die each year due to severe diarrhoea; most of them are residents from poor peri-urban areas in developing countries (UNICEF/WHO 2011). From an economic perspective, scientific evidence has demonstrated that the economic cost associated with poor sanitation is substantial (Van Minh and Nguyen-Viet 2011). It was estimated that sub-Saharan Africa loses about 5% of its GDP due to lack of sanitation, or about $ 28.4 billion each year (WWAP 2017).
2.3 Faecal sludge management
Poor sanitation and its multiple consequences are a complex challenge. Many reasons could explain the difficulties that municipalities are facing in providing adequate sanitation services to their citizens due to numbers of interactions between various sectors (i.e. financial, environmental, political, etc.) Figure 2-2.
Figure 2-2 Gaps in faecal sludge management (Strande et al. 2014)
As can be seen in Figure 2-2, the implementation of safe faecal sludge management strategies implies several fields of interventions. These are (starting from the top): (1) the planning of sludge collection and transport, (2) establishing sanctions to counteract illegal dumping in the environment, (3) the availability of safe and suitable treatment options, (4) the acceptability of safe disposition options (5) adequate tariffs to ensure the sustainability of the sanitation structure, and (6) the implementation of a communication platform to ensure adequate interactions between the various stakeholders. The establishment of good practices for the safe management of faecal sludge (FS) represents major social, technologic and economic challenges for developing countries.
From a technical point of view, in order to respond to the ever-increasing quantities of FS generated in cities, the implementation of functional treatment plants is required. However, one major gap in developing appropriate and suitable FS treatment options is the ability to understand and monitor faecal sludge characteristics, faecal sludge quantification (accumulation rate) and the factors affecting the variabilities of
9
the sludge in both (characteristics and accumulation rates). The following sections present the state-of-the-art on sludge accumulation rates within pit latrine systems (section 2.4 and 2.5) and on characterization (section 2.6).
2.4 FS accumulation rate in pit latrines
Given the fact that pits are not standardised environments (e.g. variability in volume, lined or not-lined, type of soil, etc.), knowing precisely the FS accumulation rate is often very challenging, as the collection of information can be too labour intensive (Strande et al. 2014). Methodologies for providing estimates of faecal sludge accumulation rates have thus been used by various authors and can be organized in 4 categories (detailed in 2.4.1 to 2.4.4), namely: (1) for design criteria purpose, (2) from direct measurement according to field studies, 3) based on emptying frequency from household surveys and (4) based on mass balance modeling.
Pit design criteria
One of the first accounts describing faecal sludge accumulation rates into pits were suggested by Wagner and Lanoix (1958) to provide basic recommendations for the sizing of pits. These estimates were based on theoretical assumptions of biodegradation (i.e. that wet pits could easily perform biodegradation processes) and field observations from data collected by the World Health Organization (WHO). The proposed accumulation rates are presented in Table 2-2.
Wagner and Lanoix (1958) suggest the FS accumulation rate is lower in wet pits where biodegradable materials are used for anal cleansing, this is based on the assumption that better consolidation, accelerated decomposition and removal of the finer material should be observed in wet conditions (Wagner and Lanoix 1958).
Table 2-2 Proposed accumulation rate (liters per capita per year, l/cap/yr) for pit latrine design purposes (Wagner and Lanoix 1958)
The guidelines proposed by Wagner and Lanoix are still cited as references for PL design (Foxon 2010, Franceys et al. 1992, Harvey et al. 2002, Heinss et al. 1998a, Heinss et al. 1998b, Murphy 2015, Still and Foxon 2012a). However, they should be considered as a generalization since they are proposing that only two factors are affecting the filling rate of sludge: 1) the type of soil (sandy or clay) and 2) the type of material used for anal cleansing (i.e. biodegradable : water, paper, etc., or unbiodegradable: stones, corn cobs, coconut husk, etc.). As a matter of fact, several other parameters have proven to also impact the FS accumulation rates in pits (these parameters will be discussed in section 2.5.) Thus, guidelines in Table 2-2should only be used when no other local measurement of the actual filling rate is available (Franceys et al. 1992).
Field studies on measurement of FS accumulation
Table 2-3 presents a review of work that has focused on actively measuring the accumulation rate of FS in PLs. Based on information obtained from household surveys, Baskaran (1962) reported a pit accumulation rate of 34 l/cap/yr in West Bengal (India), where ablution water was used (biodegradable anal cleansing material). In Brazil, an average pit filling rate of 47 l/cap/yr is reported in dry pit conditions; in other words, this means that a pit of 1 m3 capacity will serve a family of five for four years (Sanches and Wagner 1954). Furthermore, in Zimbabwe, FS accumulation rates were reported to rarely exceed 20 l/cap/yr as the latrines observed in the study were regularly washed down (wet pits), and biodegradable material was used for anal
Description of pit latrine (wet or dry)
Pit accumulation rate (l/cap/yr) With Biodegradable anal cleansing material
With Unbiodegradable anal cleansing material
Wet pits 40 60
11
cleansing - all of which is supposed to contribute to lower the accumulation rate. Overall, the observations presented above are lower in comparison to guidelines proposed by Wagner and Lanoix (1958). This confirms the difficulty to extrapolate the accumulation rate estimations to other locations.
Furthermore, in more comprehensive studies commissioned in South Africa, the FS accumulation rate was measured over time (Bhagwan et al. 2008, Norris 2000, Still and Foxon 2012b). The sludge level was determined by measuring the vertical distance between a fixed datum (top of toilet seat) and the sludge, so the change in the vertical distance indicates the change in sludge volume (knowing the surface area of the pit) (Norris 2000). Information on the number of users came from a household survey (average number of users was used).
A great variability in results (3 to 264 l/cap/yr) has been observed, even for pits located in the same geographical area (i.e. a comparatively homogeneous environment) (Norris 2000). The most important factors affecting these rates were understood to be drainage from the pit and the extent to which pits are used for disposal of other household waste (Foxon 2010). The study do not indicate a strong relationship between household size and the rate at which the pit fills (Foxon 2010). This was also confirmed by Bakare (2012), who showed that there was no correlation between available data for pit filling rates and reported number of users. Bakare (2012) concluded that this was due to uncertainty in the pit filling rate data and confusion surrounding the interpretation of average number of pit users. Indeed, the household size may have increased or decreased over the period that the pit has been in use, some members may have been away from the home during the day or week and have contributed far less to the contents of the pit than others, and children contribute less than adults to the pit (Foxon 2010).
Table 2-3 Overview of studies that have focused on the measurement of accumulation rate. Estimated age of latrine (yr) Number of latrines monitored Frequency of accumulation measurement Average volume of pits (m3) Accumulation rates range (l/cap/yr) Average accumulation rate (l/cap/yr) Location Reference
N/A 34 India (West
Bengal) (Baskaran 1962)
25 India (West
Bengal)
(Baskaran 1962, Wagner and Lanoix 1958)
40 Philippines (Wagner and Lanoix 1958)
20 Zimbabwe
47 Brazil (Sanches and Wagner 1954)
3 11 14 within 28
months
1.96 13.1 to 34.0 24.1
South-Africa
(Bhagwan et al. 2008, Norris 2000, Still and Foxon 2012b) 4 159 2 - 3 within 35 months 3.16 18.3 to 120.5 69.4 5 11 1 2.83 10 to 33.2 18.5 11 19 1 3.40 14 to 123 29 (median) 11 25 1 2 14 to 77 34 (median) 9-12 100 N/A 5.40 1 to 109 39 (median) 3 4.2 11 to 146 48 (median)
10 40 N/A N/A N/A 21 (median)
10-14 35 35 2.25 3 to 264 19
N/A N/A N/A N/A 25 to 30 27.5 (implied) Tanzania
0.25-19 50 18 months 2.72 97 to 702 39 Tanzania
13 Emptying frequency
For economic reasons, emptying services would most likely be claimed only when the pits are full. Following this assumption, pit emptying frequency data may be used as a proxy to estimate the faecal sludge filling time (yr) into pits. Table 2-4 summarizes the average pit emptying frequencies reported in different studies.
Table 2-4 Estimate of the emptying frequency of pit latrine Emptying frequency
(yr) Summary of methodology used Location Reference
0.25 – 1 (53%) 1 – 2 (40%)
Data used includes surveys, field observations and photography. Analysis was done on 30 randomly chosen households of Bwaise III Parish, a lower-income urban settlement.
Kampala (Uganda)
(Kulabako et al. 2010)
5 Data is from a survey conducted with 1,500 lower-income households. 45% of latrines are abandoned after 5 years because of filling up or breaking down.
Kampala (Günther et al. 2011) 4.2 (average) ≥ 10 (high income areas) ≥ 0.25 (low-income areas)
Data collected from Kumasi Waste Management, includes department reports and the FS treatment plant operator’s worksheets.
Kumasi (Ghana)
(IRC 2006, Vodounhessi and von Münch 2006)
6 – 10 Data includes interviews and field observations; 270 households were surveyed.
Ashanti region (Ghana) (Appiah-Effah et al. 2014) 2 (unlined) 6.5 (partially lined) 8.5 (fully lined) 4.7 (drum/tire)
5.5 (other, mainly septic and sewer)
Data is from a cross-sectional survey in June 2008 of 662 residential properties across a sample of 35 unplanned low-income sub-wards.
Dar es Salam (Tanzania)
(Jenkins et al., 2015)
The assessment of the various studies presented in Table 2-4 highlights valuable information on the factors that can affect the filling time (yr) of pits. First, as observed with the FS accumulation rate (Table 2-3), the frequency of pit emptying varies significantly with observations ranging from pits that had never been emptied (> 10 yr) to some that were emptied monthly. As it was reported in Foxon (2010) for accumulation rates, Kulabako et al. (2010) also noted that the depth of the water table is likely to have the largest impact on the emptying frequency of pits. In the Kulabako study (n = 30), 53% of the respondents live in an area with a high-water table and stated to have emptied their latrine every 3 to 12 months, compared to the 40% of the respondents who live in relatively lower water table and emptied their latrine every 1 to 2 years.
In Kumasi, surveys with 20 households (5 in high income areas, 5 in medium income areas, 10 in low income areas) indicate an estimated average of 4.2 years (ranging from 10 years to only 3 months) for pit to fill up to its holding capacity (IRC 2006, Vodounhessi and von Münch 2006). Interestingly, values found in Kumasi are proportional to the household income, ranging from 10 years or more in high income areas, to as low as 3 months in low income areas (Vodounhessi and von Münch 2006). This might be caused by a higher solid waste content into pit from low-income areas where the pit is more likely to be used as a disposal site for garbage. Also, Günther (2011) conducted on-site surveys with 1,500 low income households in Uganda’s capital, and results show that 45% of the households surveyed stopped using their toilet within 5 years because it filled up (and it was difficult to be emptied), or because it broke down (Günther et al. 2011).
Furthermore, Jenkins et al. (2015) surveyed latrine emptying services in unplanned communities in Dar es Salaam, Tanzania. Collected data from a cross-sectional survey of 662 residential properties in 35 unplanned sub-wards show that lined pits, therefore watertight, were reported to fill up slower that in unlined pits. Indeed, lined pits required an average drainage frequency of 8.5 years, as compared to 2 years for unlined pits. This suggests that water infiltration (water from outside moving to inside the pit) would be
15
more important than liquid leaching (water from inside moving to outside). In the same study, Jenkins and colleagues also reported that the average emptying frequency (expressed in years) decreased with the increase in number of historical emptying; from 14.4 years for latrines emptied once, to 4.8 years for latrines emptied four or more times. This confirms local perceptions that it takes less time to refill a latrine once emptied (Jenkins et al. 2015) probably according to solids trash or sand accumulating at the bottom of the pits which is difficult to remove and structural damage to unlined or partially lined pits during emptying (Jenkins et al., 2015).
In another study, Appiah-Effah et al. (2014) reported an average emptying rate of one every 6 – 10 years. Data include interviews and field observations of 270 households in Ghana. However, one limitation is that the majority of surveyed households used shared facilities (69.6%) and may not have been aware of the emptying practices of the communal facilities (Appiah-Effah et al. 2014).
Lastly, the household survey results of a city-scale meta-analysis of on-site sanitation users’ perspectives and habits is presented in Table 2-5. A total of 13,143 household surveys and financial statements of 154 emptying service providers were compiled for 30 different municipalities in 10 countries (Chowdhry and Kone 2012). The data collected includes the number of households per city with on-site sanitation systems (PL and STs), and the average size of the pit/tank and the emptying frequency is presented. The accumulation rate assessed for each city varies from 21.4 to 941.5 l/cap/year. In general, the higher accumulation rates correspond to a higher use of STs (Chowdhry and Kone 2012). For example, in Burkina Faso and Ethiopia, where pits dominate, the accumulation rate varied between 42.1 and 177.1 l/cap/yr as compared to Senegal where the STs were reported to fill up at a rate between 608 to 941.5 l/cap/year. Given the range of pit filling rate field measurements, this estimation from a city-scaled survey shows overall higher accumulation rates. The authors justified the variation on possible inaccuracy of some primary data. Variations in the pit and tank design, size, intrusion of groundwater, amount of greywater disposal in the
latrines, along with other items like rags and garbage could also explain the large variability of the results (Chowdhry and Kone 2012).
17
Table 2-5 The faecal sludge accumulated in on-site sanitation facilities in 30 cities of Africa and Asia (Chowdhry and Kone 2012) FS accumulated (m3/yr) No. of HH with OSS FS accumulated / HH (m3/yr) No. of people using HH latrine Average accumulation rate (l/cap/year) Average volume of pits (m3) Estimated emptying frequency (years) Location 1,247,193 181,066 7 14 492 10 1.5 Abuja Africa 793,239 503,188 2 7 225 12 7.6 Addis Ababa 59,341 93,998 1 15 42 5 7.9 Bobo Dioulasso 2,079,107 167,874 12 14 885 3 0.2 Dakar 49,333 61,996 1 8 100 12 15.1 Dire 4,045 7,680 1 9 59 5 9.5 Fada N'Gourma 10,972 14,955 1 7 105 12 16.4 Hosaena 1,829,663 275,248 7 18 369 12 1.8 Ibadan 691,903 124,735 6 8 693 3 0.5 Kisumu 4,604,702 502,358 9 12 764 3 0.3 Nairobi 439,122 275,208 2 9 177 5 3.1 Ouagadougou 201,514 30,111 7 11 608 3 0.4 Thies 696,960 56,941 12 13 942 3 0.2 Touba 218,022 29,003 8 14 537 10 1.3 Yenagoa 98,806 425,179 0.23 6 39 2 8.6 Delhi Asia 564,689 333,747 1.69 5 338 3 1.8 Dhaka 90,149 24,835 3.63 5 726 3 0.8 Faridpur 166,466 212,231 0.78 4 196 1 1.3 Hai Phong 280,376 404,800 0.69 5 139 1 0.0 Hanoi
894,087 823,785 1.09 5 217 1 0.9 Ho Chi Minh City
126,004 101,714 1.24 7 177 2 1.6 Jaipur 1,013 6,971 0.15 6 24 2 13.8 Kampot 892,051 380,327 2.35 5 469 3 1.3 Khulna 56,142 58,108 0.97 3 322 2 2.1 Kuala Lumpur 48,276 57,084 0.85 4 211 1 1.2 Kuala Terengganu 66,212 35,873 1.85 5 369 2 1.1 Madurai 44,443 46,833 0.95 3 316 1 1.1 Melaka 25,764 197,788 0.13 6 22 3 23.0 Phnom Penh 3,684 30,290 0.12 5 24 2 16.4 Siem Reap
Modelling of pit filling rate
The need to better understand the faecal sludge accumulation rates into pit latrines has motivated the development of a simple mass balance model (Eq. 2.2) The model characterizes the faecal sludge as a mixture of biodegradable material, unbiodegradable material and inorganic material (Brouckaert et al. 2013). Measurements made on 2 pits in eThekwini, South Africa, were used to determine parameters for the model. Then the model was validated using data from 15 other pits in the same area and filling rate data from previous South African studies (Brouckaert et al. 2013) (Eq. 2.2). Parameters of this model are defined in Table 2-6).
(Eq. 2.2)
Table 2-6 Parameters of the Brouckaert et al. (2013) pit filling rate model Parameter Unit Description of parameter
Ru
(m3/d) Rate of addition of unbiodegradable material (dry basis)0 0
vb vu
(m3/m3) Ratio of biodegradable to unbiodegradable material fed
K (m3/m3) Yield of unbiodegradable organic material from degradation of biodegradable material
r (d-1) Rate constant for biodegradation
In Brouckaert’s model, a PL is considered as an open system, unsealed, that can interact with the environment. The model includes: 1) the inflow of faecal matter into the PL, 2) the degradation process that takes place, 3) the new inert solid material formed, and 4) the outflow. In addition, unbiodegradable material (e.g. garbage, rocks, glass, etc.) that is added to the PLs is also included in the inflow (Still and Foxon 2012, Bakare 2014, Murphy 2015). However, the authors report that, given the uncertainties involved, it seems
V(t,T ) = Ru (1+ k
v
b0v
u0)(T - t) - ((1- k)
v
b0v
u0)
e
-rt- e
-rTr
é
ë
ê
ù
û
ú
19
unlikely that the design of a PL would be driven primarily by the factors described by the model, but rather by considerations of resources, cost and the subsequent treatment process (Brouckaert et al. 2013). Nevertheless, the model may be useful to estimate some of the implications of any chosen system design (Brouckaert et al. 2013).
Furthermore, Brouckaert’s model was assessed in Infakara, Tanzania where FS build-up in 28 pits was monitored. The performance of Brouckeart’s mass balance model is shown in Figure 2-3, which reported that the simulated filling rate was within 40% of the observed rate for only half of the latrines (12 latrines).
Figure 2-3 Comparison between the observed and simulated filling rates. The 1:1 line is shown and dashed lines correspond to 40% error Todman et al. (2014).
Todman et al. (2014) concluded that Brouckaert’s model could be used as a research tool to predict pits that fill unexpectedly fast or slow, but the model cannot provide an accurate prediction of the filling rate of an individual latrine given the uncertainty of the parameters due to limited data. Results from Todman et al. (2014) also suggest that the presence of a layer of water at the top of the pit may increase the filling rate and that seasonal changes in groundwater flow into and out of the latrines has an important effect on the
filling rate (m/yr). This concludes the available information reported in the literature on the accumulation rates. The next section will discuss the factors affecting the accumulation rates of FS in pits.
2.5 Factors affecting accumulation rates of FS in pits
Many factors influence the filling rate of pits, some of them being operational and design related (i.e. number of users, age of the pits, geophysical and climatic factors, etc.) (section 2.5.1), and others being the result of the degradation processes occurring over time (i.e. aerobic and anaerobic biodegradation) (section 2.5.2). Table 2-7 summarized the studies assessing FS accumulation rates (L/cap/day) or FS biodegradation and characteristics, with factors that influence them (adapted form (Nakagiri et al. 2015).
Operational and design related parameters + Number of users
Studies relating sludge accumulation rates to number of users have reported contradictory results with the general perception that the filling rate increases with the number of users. Indeed, Norris (2000), Bakare (2014) and Still and Foxon (2012b) concluded that the reported number of users does not represent how many people on average throughout the year use the toilet. Hence, the authors suggest that this parameter may not be reliable to describe the filling rate of household pit latrines (5 to 15 users). However, the case could be different in urban settings where pit latrine sharing leads to a higher number of users (Nakagiri et al. 2015).
21
Table 2-7 Summary of studies assessing FS accumulation rates (L/cap/day) or FS biodegradation and characteristics, with factors that influence them (adapted form (Nakagiri et al. 2015)
Country Variable of
interest Study/experimental design Remarks References
South Africa
Number of users Per pit filling rate as a function of
number of users. The filling rate is not a function of reported number of users, but
rather depends on a range of other factors not recorded. (Still and Foxon 2012b) Rubbish content
Sorting and analysis of pit content
Throwing rubbish in a pit is susceptible to increase the filling rate by 50%
South Africa
Number of users Analysis of amalgamated data documented by (Still and Foxon 2012b)
No correlation (Pearson correlation coefficient of 0.203) between sludge accumulation rate and number of users.
(Bakare 2014) Commercial pit
latrine additives
Laboratory experiments on pit latrine samples
The use of commercial pit latrine additives to treat pit latrine sludge content was unable to accelerate biodegradation rate and mass loss in the test units. Thus, no impact on the accumulation rate. Moisture Laboratory batch experiments on
pit latrine samples No evidence that an increase in moisture content of samples from VIP latrines reduced the sludge accumulation rate.
Tanzania Flow and accumulation of water
Field monitoring and measurements
The presence of a layer of water at the top of the pit may increase the filling rate.
(Todman et al. 2014)
Table 2-8 Summary of studies assessing FS accumulation rates (L/cap/day) or FS biodegradation and characteristics, with factors that influence them (adapted form (Nakagiri et al. 2015) (cont’d)
Number of users
Field monitoring and measurements
South Africa
Seasonal effects
No evidence was found to support the effects of rain and moisture contents in the pit latrines monitored
South Africa
Addition of moisture
Laboratory experiments, batch anaerobic digestion on pit latrine samples
The rate of anaerobic digestion of pit latrine contents taken from the surface of the pit could
be accelerated by the addition of moisture (Couderc et al. 2008)
Increasing alkalinity
No statistically significant increases in the rate of gas production from the samples under anaerobic conditions.
South Africa
Anaerobic digestion
A serum bottle test was used to investigate anaerobic biodegradability of fresh faeces and pit latrine sludge from the different layers (depth) of a VIP pit
Inconclusive results (Nwaneri
2009) South
Africa Addition of waste Developing and testing a simple mass balance model
Adding non-degradable material to the pit significantly influenced its filling
(Brouckaert et al. 2013) South
Africa
Commercial pit
latrine additives Laboratory experiments on pit latrine samples
No statistically significant effect on rate of mass loss
(Foxon et al. 2009)
Thailand Age of the sludge Field investigations
The longer the emptying period required by on-site sanitation unit, the lower the sludge accumulation rate could be obtained.
(Koottatep et al. 2013)
Table 2-8 Summary of studies assessing FS accumulation rates (L/cap/day) or FS biodegradation and characteristics, with factors that influence them (adapted form (Nakagiri et al. 2015) (cont’d)
23
Thailand Effect of the temperature
An experimental study employing two laboratory-scale septic tanks fed with diluted septage and operating at temperatures of 40 and 30°C was conducted.
Operating a septic tank at 40°C had reduced the total volatile solids accumulation and would lengthen the period of septage removal to twice that of the septic tank operating at 30°C.
(Pussayanavin et al. 2015)
+ Seasonal impact
Studies relating sludge accumulation rates to seasonal effects have reported contrasting results. Some studies reported no influence of the seasonal effect (rainy or dry seasons) on the variations of sludge accumulation rates in PLs in South Africa and Burkina Faso (Norris 2000, Bassan et al. 2013). However, this was not observed in Tanzania, where an important increase in pit content was monitored in the wet periods (rainy season) (Todman et al. 2014).
+ Sludge age
Koottatep (2013) reported that the FS accumulation rate decreases over time due to the stabilization or biodegradation process of organic contents in the sludge (in a septic tanks, ST). The author suggested that FS accumulation rates for the first year of filling could therefore be highest, given that microorganisms require time to reach solids decomposition activity levels necessary to impact accumulation rates (Koottatep et al. 2014).
+ Addition of other wastes (rubbish)
A simple mass balance model of PL filling developed and tested by Brouckaert, et al. (2013) using data from VIPs in South Africa, predicted that adding non-degradable materials to the pit significantly influenced its filling.
+ Temperature
Impact of temperature was demonstrated by Pussayanavin et al. (2015) in an experimental study using two laboratory-scale STs fed with diluted septage and operating at temperatures of 40°C and 30°C. At steady-state conditions, there was more digestion of organic matter in the sludge layer of the ST operating at the temperature of 40°C, resulting in less total solids accumulation than in the unit operating at 30°C.
25 + Others
Finally, other operational and design related parameters could probably affect the accumulation rate of FS into pits. Parameters such as: the type of soils, diet of the users, the use of chemicals, etc. However, the lack of information in the literature limits their discussion. Further work would be needed aiming to standardize the FS accumulation monitoring into pits and to assess the key factors impacting on the accumulation rate. The next section presents the existing knowledge on the biodegradation mechanisms of faecal sludge into pits.
Biodegradation mechanisms related parameters + Anaerobic digestion
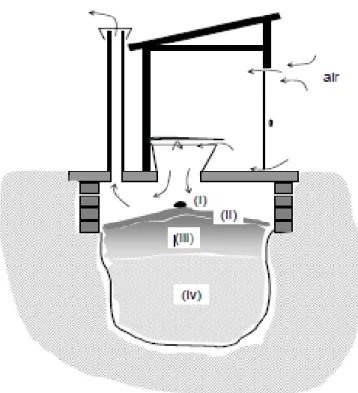
Knowledge of the degradation of faecal sludge within latrines is essential in predicting accumulation rates. Because of the unfavorable redox conditions in pits (e.g. limited oxygen, high COD from the fresh sludge), the assumption of anaerobic biodegradation predominance is largely accepted. Based on faecal sludge characterization data, a theoretical model of biodegradation mechanisms has been developed describing in four stages the profile of FS digestion into pits (Buckley et al. 2008).
Figure 2-4 Four stages theoretical model of FS digestion into pits (Buckley et al. 2008)
Buckley et al.’s (2018) conceptual model (Figure 2-4) has been developed according to the following assumptions. 1) The first layer (i) which is composed of fresh faecal matter - and thus mainly easily biodegradable mass - is likely to decompose quickly under aerobic conditions. 2) The second layer (also aerobic) (ii) is characterized by a thin layer at the top of the pit where the hydrolysis of the substrate’s macromolecules (i.e. lipids, polysaccharides, proteins, etc.) into soluble fermentable compounds under aerobic and/or facultative anaerobic fermentative bacteria takes place. At this stage, the rate of decomposition is suggested to be limited by the hydrolysis of complex organic molecules into simpler compounds. 3) The third layer (iii), the main one, is suggested to be most probably governed by anaerobic biodegradation mechanisms because of the low oxygen concentrations at this depth. 4) Finally, the fourth layer (iv) would consist of inert sludge having reached a high degree of stabilization. Criticism of the Buckley et al. (2008) theoretical model suggests that given the low numbers of aerobic bacteria in fresh feces it cannot be comfortably assumed that aerobic digestion is solely responsible for the degradation at