HAL Id: hal-02352832
https://hal.archives-ouvertes.fr/hal-02352832
Submitted on 7 Nov 2019
HAL is a multi-disciplinary open access
archive for the deposit and dissemination of
sci-entific research documents, whether they are
pub-lished or not. The documents may come from
teaching and research institutions in France or
abroad, or from public or private research centers.
L’archive ouverte pluridisciplinaire HAL, est
destinée au dépôt et à la diffusion de documents
scientifiques de niveau recherche, publiés ou non,
émanant des établissements d’enseignement et de
recherche français ou étrangers, des laboratoires
publics ou privés.
Co-simulation of an electrical distribution network and
its supervision communication network
Benjamin Camus, Anne Blavette, Anne-Cécile Orgerie, Jean-Baptiste
Blanc-Rouchossé
To cite this version:
Benjamin Camus, Anne Blavette, Anne-Cécile Orgerie, Jean-Baptiste Blanc-Rouchossé. Co-simulation
of an electrical distribution network and its supervision communication network. CCNC 2020 - IEEE
Consumer Communications & Networking Conference, Jan 2020, Las Vegas, United States. pp.1-6.
�hal-02352832�
Co-simulation of an electrical distribution network
and its supervision communication network
Benjamin Camus
∗, Anne Blavette
†, Anne-C´ecile Orgerie
∗, Jean-Baptiste Blanc-Rouchoss´e
†‡∗Univ. Rennes, Inria, CNRS, IRISA, Rennes, France, Email: {benjamin.camus, anne-cecile.orgerie}@irisa.com †Univ. Rennes, CNRS, SATIE, Rennes, France, Email: [email protected]
‡Univ. Toulouse, CNRS, IRIT, Toulouse, France, Email: [email protected]
Abstract—Smart grids require the large-scale deployment of communication means to interconnect the electrical devices and to autonomously pilot their management. Hence, interconnected tools from both the communication and the power system communities are required in order to adequately simulate the mutual dependencies between these two infrastructures. In this paper, we propose an open-source co-simulation framework for evaluating the mutual impacts between an electrical distribution network and its supervision communication network. A case study dealing with line congestion mitigation is presented to illustrate the versatility of our tool.
Keywords: communication network, smart grids, co-simulation
I. INTRODUCTION
The electricity consumption keeps growing worldwide: the number of consumers increases along with the individual con-sumption. According to the International Energy Agency, in 2018, the worldwide electricity consumption increased by 4%, the fastest pace since 2010 [18]. The current challenges in the energy sector are multiple: integration of increasingly flexible distributed loads, such as electric vehicles, exploitation of renewable energy sources, often variable by nature and decen-tralized, and energy storage management. The digitization of electricity grids is expected to meet these challenges by jointly optimizing the production, distribution and consumption.
Smart grids involve the large-scale deployment of commu-nication means to interconnect the electrical devices and to au-tonomously pilot their management. This digital infrastructure relies on computing, communication and storage resources to provide secure tools for processing, modeling, predicting and optimizing the electrical grid utilization.
Current telecommunication networks experience delays, jit-ter and bottlenecks. Such a dynamicity, ubiquitous in Injit-ternet networks, can greatly impact the management of smart grids as they require a guaranteed quality of service (QoS) [14], [23], [31]. Consequently, management solutions need to care-fully take into account mutual impacts between the electrical network and its management telecommunication network.
Since real experiments require quite complex infrastructures and are limited in scale for security and economical reasons, simulation is commonly used in both the communication and energy fields, to assess the feasibility and validity of original solutions [2], [9]. Both communities have their own validated simulation frameworks providing accurate and reliable results. Yet, in the case of smart grid simulation, interconnected tools from both communities are required in order to adequately
simulate the mutual dependencies of the management network and the electrical grid.
In this paper, we propose an open-source co-simulation framework for evaluating the mutual impacts between electri-cal network and its supervision communication network. This framework is available online [24]. It combines two validated and well-known simulators: SimGrid for the communication part and PowerFactory for the electricity part. Besides, our framework is extensible (e.g. any FMI-compliant power sys-tem simulator can be used) and scalable. We test it on a rep-resentative use-case taken from an electrical grid connecting 55 homes. A comparative analysis is then performed between a centralized and a decentralized management approach, with several values of communication latency, with respect to the impacts in terms of electrical load shedding and to the number of messages sent over the communication network.
The paper is organized as follows. Section II details the background and the related work. Section III presents our con-tribution. The validation use-case is presented in Section IV. Section V concludes this work and presents future work.
II. BACKGROUND AND STATE OF THE ART
Context. The emergence of smart grids renders more and more urgent the need for adopting a holistic view on the power system and on its supervision communication network. How-ever, this combination renders the power system performances dependent on the design and management of its telecommu-nication supervising infrastructure. The performances of the former can of course be enhanced by using the additional amount of information provided by the latter [30]. Yet, recent works have shown that communication delays, inherent to the transmission of information, could also degrade dramatically the performances of a smart grid [14], [23], [31]. Hence, it is now recommended to take communication latencies into account when designing control algorithms requiring a sig-nificant share of information transmission, such as distributed energy management strategies.
Power systems simulators. Grid studies are usually per-formed using power system simulators that reproduce numeri-cally the dynamics of an electrical network. Some of them are entirely dedicated to such simulations, such as PowerFactory [7], EMTP-RV, PSS®E and OpenDSS. Other less specific, and therefore more versatile, tools intended for the modeling and
the simulation of various complex systems are also applied to electric power system simulations, such as Dymola [6]. Computing systems simulators. Several tools are used in the literature to simulate computing systems. Event-based packet-level simulators such as NS-3 [15] and OMNeT++ [26] are widely employed in the communication network com-munity. These simulators are highly accurate due to their full implementation of the whole communication protocol stack. However, these tools do not scale up well because they simulate each packet transfer on the network. Then, it may take orders of magnitude longer than the simulated time to simulate large and complex communication network topology [13]. Hence, packet-level simulators do not seem adapted to conduct experiments on energy management in smart grids that may consider timescales ranging from seconds to several years.
The SimGrid platform [4] is dedicated to the simulation of large-scale distributed systems. It embeds a validated flow-level TCP/IP model that is faster by orders of magnitude than packet-level approaches [13]. Moreover, it has been extensively demonstrated that this model is also reasonably accurate [29]. Contrary to communication network simula-tors, SimGrid also embeds theoretically and experimentally assessed performance models to capture computing resources sharing [28]. Thanks to these models, SimGrid can simulate the execution of a complex large-scale distributed application over a distributed infrastructure. Thus, SimGrid is perfectly adapted to simulate a smart grid supervising system.
Co-simulation. For decades, the computing and the power systems communities have developed independently complex and sound simulation tools. However, with the advent of smart grids, combining these tools in a co-simulation is necessary [12]. Co-simulation consists in coupling different stand-alone simulation tools, so that they simulate together a whole system in a consistent way. This approach has the advantage of (1) enabling to study the global behaviour of the system, while (2) enforcing a clear separation of concerns in a multidisciplinary modeling and simulation process, and (3) reusing and factorizing efforts put into the development and validation of preexisting simulation tools.
However, when applied in a multidisciplinary context like smart grids, co-simulation raises several issues. First, the inter-operability has to be managed so that the different simulation software can be synchronized and exchange usable data. The challenge is then to bridge the gap between software codes that are written in different programming languages, implement different APIs, and are compliant with different Operating Systems (OS). In the smart grid context, co-simulation also im-plies to rigorously integrate the different modeling paradigms of the computing and power systems communities and their simulation strategies. On one hand, power systems are mod-eled by continuous differential-algebraic equations systems and simulated by complex numerical solvers. On the other hand, distributed computing systems applications are mostly modelled with a programmatic interface as concurrent pro-grams and simulated in a discrete event-based way. It is then required to bridge the gap between continuous formal-based
simulation and discrete code-based simulation to perform an hybrid co-simulation.
Several works in the literature propose co-simulation plat-forms to study smart grids [1], [2], [10], [11], [16], [19], [20], [22], [25], [27]. However, most of them are restricted to a specific power system simulator, which strongly limits the experiments that can be done with the co-simulation tool [2], [10], [11], [16], [19], [20]. Some do not simulate the computing system execution and neglect then its impact on the smart grid operation [22], [25]. Others use packet-level communication model and are then strongly limited by simulation performances [1], [2], [10], [11], [16], [19], [20], [27]. They also do not include computing resources (e.g. CPU) sharing models, and neglect then the time taken by the control system to compute decisions.
The Functional Mock-Up Interface (FMI) standard [21] proposes a unified software interface to interact with multi-physical equation-based systems and their solvers. The stan-dard is directly or indirectly supported by more than one hundred tools including several major power systems simu-lators (e.g. EMTP-RV, PowerFactory, Dymola, TRNSYS). Thanks to FMI, continuous models and their solvers can be exported/imported from/to any of these tools as a standardized shared library called FMUs (Functional Mock-up Units). Thus, FMI offers a framework to solve the interoperability issues between multi-physical simulation software. It becomes then an key solution for co-simulation. Yet, the challenge is to define a master algorithm to manage the co-evolution of FMUs with their simulation environment. In particular, performing hybrid co-simulation where FMU components interact with discrete-event systems still remains an open issue [5].
III. CONTRIBUTION
To co-simulate smart grids systems, we propose to leverage on the unique Information and Communication Technologies (ICT) performance models of SimGrid (i.e. bandwidth and CPU sharing), and on the federating power of FMI regarding multi-physical systems. We developped a SimGrid plugin called SimGrid-FMI to perform FMI-based co-simulations with SimGrid. The C/C++ code of this plugin is available in open-source at [24].
To mediate interactions between code-based models of distributed applications and equation-based models of power systems, SimGrid-FMI leverages the SimGrid architecture that is highly inspired from the classical design of an Operat-ing System. Indeed, SimGrid natively compartmentalizes the distributed application processes using dedicated execution contexts. Then, a simulation kernel strictly manages the co-evolution and interactions of these processes with the ICT performance models. SimGrid-FMI adds to this architecture a new SimGrid model that implements an FMI master algorithm. The SimGrid kernel manages then the co-evolution of this master with the distributed application processes in a transpar-ent way like any other ICT performance model. The plug-in also extends the SimGrid API for the distributed application processes in order to be able to interact with FMUs (e.g. set/get
input/output). To be fully compliant with the requirements of hybrid discrete-continuous co-simulations, our API also intro-duces the concept of state-events in SimGrid. They constitute a special class of discrete-events whose occurrences depends on specific conditions on the continuous state (usually when a continuous variable crosses a given threshold). During the simulation, the distributed application processes can then use our API to define state-events and register callbacks to their occurrences.
The master can manage a set of coupled FMUs thanks to an Euler fixed step-size integration algorithm [3]. Algebraic dependencies between FMUs are handled with a brute-force algorithm that iteratively solves the dependencies until the system state reaches a stable point. This algorithm assumes nonetheless that there is no algebraic loop in the FMUs couplings. The master detects state-events occurrences thanks to a fixed-size look-ahead research strategy. We deliberately choose simple numerical algorithms to make as few assump-tions as possible on the FMUs capabilities, and therefore to be compliant with the maximum number of multi-physical simulation tools. To transparently use simulation tools that are compliant with different OS, we design a proxy FMU that uses network sockets to mediate interactions between the master and a remote FMU deployed on another environment.
Thanks to the versatility of SimGrid and FMI, our plugin can be used to simulate a larger class of systems where dis-tributed computing infrastructures and multi-physical systems interact. In a previous work [3], we have validated SimGrid-FMI with the co-simulation of a data-center and its air-cooling system. In this paper, we demonstrate that our tool can also be used to co-simulate smart grids.
IV. USE-CASE A. Scenario
1) Power system modeling: The scenario considered here is based on the publicly available “European Low Voltage Test Feeder” electrical network model [17]. To the best of the authors knowledge, it is the sole IEEE benchmark (avail-able publicly) of a low-voltage European distribution network that also provides power consumption time series for each electrical load it contains. They represent the consumption of 55 electrical loads in the same district, each seemingly representing a single household. The electrical grid between the homes exhibits a tree topology that is connected to the district power substation through an electrical line named Line1 in the rest of the paper.
An arbitrarily-chosen number of 15 electric heaters (direct-acting) were added to this electrical network. The power consumption of each of these heaters was modeled as a cyclic profile alternating between a typical value of 2 kW and 0 kW. The power profile of a single radiator, observed as part of an experiment, was used to model the power consumption profile of all the radiators modeled in this article, to which random time delays were applied to model the aggregation effect.
It must be noted that, in the absence of additional ex-perimental data, a simple heater model was considered. In
this model, the post-shedding rebound effect on the power consumption was not included. However, in the case where the shedding duration is relatively short, it may be assumed that the corresponding rebound effect is also small.
2) Case study description - Power system perspective: It was assumed that congestion would occur during the peak hour of the IEEE model. Line congestion occurs when the current flowing through a line exceeds its rated value, and it should be avoided. In the past, this type of issue used to be prevented by a sufficient over-sizing of the electric network. However, grid upgrading is extremely costly and time-consuming. Hence, distribution system operators (DSOs) seek now to maximise their assets usage by deploying smart energy management strategies. Short-term load shedding may be one of them. This strategy consists in suspending temporarily the power supply to given electric loads. In particular, the shedding of heaters over a sufficiently short period of time may have a negligi-ble influence on the consumer’s thermal comfort. However, the successive and repeated shedding (called “cascado-cyclic shedding” [27]) of a sufficiently important number of radiators may solve a line congestion issue. It is important to note that automated shedding, as opposed to consumer-activated shedding, is necessary to harness this flexibility potential. This strategy requires indeed a short reaction time and may potentially need to be repeated a significant number of times. 3) Computing system modeling: To support automated shedding in the electrical network, we consider the following TCP/IP communication network. The households and Line1 are equipped with computing devices that are controlled and monitored. All these devices are connected through Ethernet links on the same local network. For the sake of simplicity, we consider a star topology with homogeneous bandwidth and latencies between the nodes, similarly to the connection of each house of the district to the district DSLAM (digital subscriber line access multiplexer).
4) Case study description - Computing system perspective: We consider the following cascado-cyclic policy to automate the shedding of the household heaters in the electrical network. A shedding sequence is initiated when the current in Line1 reaches a given upper threshold. Several households are then selected for shedding. After a short time, a new iteration of the process starts: a new group of households is selected and the shedding process switches to these households. This process is repeated until the current in Line1 falls below a lower threshold. At this point, the shedding process is suspended. To ensure that all the households receive the same amount of shedding commands, they are selected in a cyclic way.
This policy can be implemented by several algorithms. Here, we propose two of them, that are representative of respectively centralized and decentralized approaches. The decentralized approach avoids that a single actor gathers information on all the consumers at very short spacio-temporal scales. Thus, it may be considered by the general public as less intrusive. At the opposite, with the centralized approach, the DSO manages directly all the system. It conserves then a higher level of confidence regarding its own ability to operate safely and
reliably its local network.
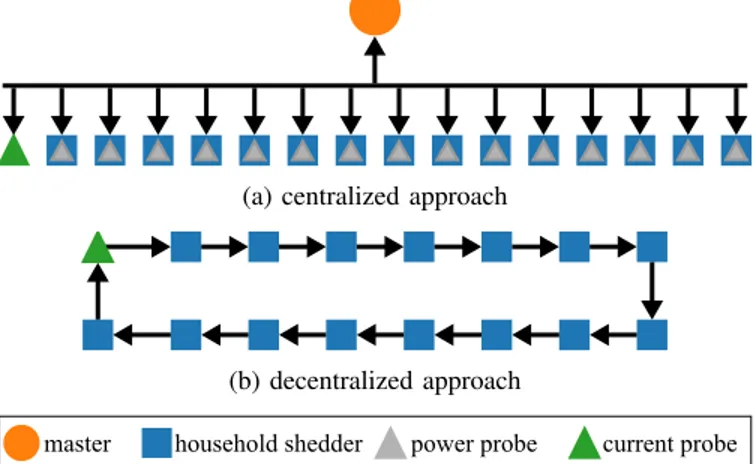
In the centralized version (shown in Figure 1a), a master application is in charge of coordinating the whole cascado-cyclic process. It sends commands through network packets to each household to start and stop the shedding of its heaters. It selects in priority the households that have the highest average power consumption over the last δ seconds (and that have not been already selected in the current shedding cycle). The master relies on the information it receives periodically through network packets from power and current probes that are deployed over the network.
In the decentralized version (shown in Figure 1b), the households are sorted in an arbitrary and predefined order. Due to the decentralization of the information, we cannot directly compare the power consumption of the households anymore. A probe located on Line1 regularly samples the current evolution. When it detects an overcurrent, it sends in a network packet the shedding commands to the first household. When a household receives such a command, it decides if it handles it or not (the decision process is described later). If it does, it sheds its heaters for a given duration, and forwards the command packet to the next household afterwards. How-ever, if it does not comply with the shedding command, the latter is immediately forwarded to the next household. Thus, the shedding commands are propagated in the network and handled by the available households on the way. The last household forwards the command packet to the Line1 probe to signal that a cycle has been completed. This command is then forwarded by the probe to the first household to start a new cycle. To ensure that all the households handle the same number of commands, the probe counts the number of performed cycles and includes this information in the shedding commands. Thus, a household only handles the commands that have a cycle number equals to the number of times it has already been shed. When the probe detects that the current falls below the lower threshold, it sends a command packet to the first household to stop the shedding. This stop-shedding packet is propagated in the network in a similar way than described previously. This process insures that when the packet reaches back the probe, shedding has stopped for all the heaters. When the probe restarts the cascado-cyclic process, the ongoing cycle is automatically resumed to the point at which it stopped. B. Results
To compare the centralized and decentralized versions of the cascado-cyclic process, we model the pilot network using SimGrid v3.23.2, and the electric network using PowerFactory 2018. We use the FMI++ PowerFactory FMU export utility [8] and our SimGrid-FMI plug-in to co-simulate the entire smart-grid. Our experiments run on a single machine. PowerFactory runs on Windows 10 whereas SimGrid is executed in Windows Subsystem for Linux. We use our FMU proxy to communicate between the two environments. During the co-simulation, SimGrid activates and deactivates household heaters shedding in PowerFactory. It reads the power and current consumption values from PowerFactory to simulate the probes behavior. We
(a) centralized approach
(b) decentralized approach
Fig. 1: The two implementations of the cascado-cyclic process.
also perform a monolithic simulation with PowerFactory (i.e. without SimGrid) to observe the system trajectory when no shedding is performed. We use this trajectory as a baseline to reflect the impact of the control system on the smart grid operation, and to validate the co-simulation.
The approaches are compared according to three metrics. The first one is the cumulative overcurrent duration –i.e. the cumulative duration during which the current in Line1 is above the allowed limit. It is computed by PowerFactory and it measures the control system efficiency from a DSO perspective. The second metric is the cumulative household shedding duration required to solve the congestion problem. It is computed by SimGrid and indicates the efficiency of the control system from the smart grid consumers’ perspective. The last metric is the number of messages sent on the commu-nication network. It is computed by SimGrid and indicates the impact of the control system on the communication network. We simulate the smart grid execution during the peak hour –i.e. from 5:30pm to 6:30pm. To see the impact of the com-munication network on the cascado-cyclic process efficiency, we vary the communication network latency between 1 ms and 20 ms. Table I sums up the parameters values set in the experiments.
TABLE I: Co-simulation parameters values. Network bandwidth 10Gbps Probe and command messages size 1 KB Power and current probes sampling frequency 1 sec Duration of a single shedding (if not interrupted) 60 sec Number of households jointly selected for shedding 4
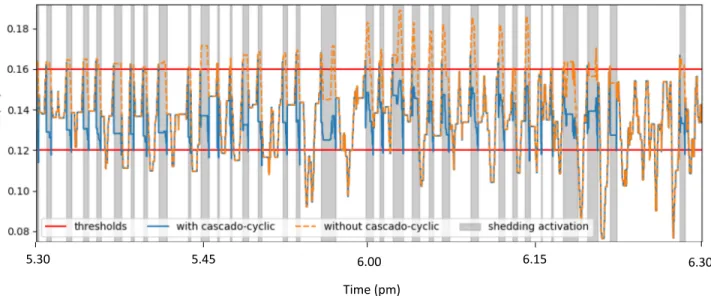
Cascado-cyclic process activation threshold 160 A Cascado-cyclic process deactivation threshold 120 A Duration δ to average households consumption 300 sec Figure 2 shows the evolution of the current in Line1 over time with the centralized approach and a communication network latency of 1 ms. From this graph, we see a nominal behavior of the co-simulation. The cascado-cyclic process starts when the current in Line1 reaches the upper threshold. Then, the current decreases due to the shedding of the heaters.
When the current falls below the lower threshold, the cascado-cyclic process stops. Then, the trajectories of the co-simulation and the monolithic PowerFactory simulation coincide perfectly due to the absence of shedding. We get similar validity results with the decentralized version.
Figure 3 shows that with a communication network latency of 1ms, the two approaches greatly reduce the cumulative overcurrent duration of approximately 97%. In this context, the latency is so low that the impact of the communication network becomes negligible and the two cascado-cyclic imple-mentations offer similar results. Yet, the centralized approach achieves this performance with a cumulative shedding duration 9% smaller, because it can determine and select in priority the households that have the highest average power consumption. Yet, this information centralization greatly increases the load of the communication network with a traffic almost 30 times higher than with the decentralized approach. Thus, compared to the decentralized approach, the centralized one has a smaller impact on grid consumers at the cost of a greater impact on the communication network.
Figure 3 also shows that the decentralized implementation is more sensitive to the communication network latency. When the latency increases to 10ms (resp. 20ms), the cumulative over-current duration of the decentralized implementation is 2.2 (resp 2.6) times higher than with the centralized approach. Indeed, the shedding command packet may be forwarded several times from household to household before it is received by sheddable one. At the opposite, the shedding commands are directly sent to the right households with the centralized implementation. Thus, latency has more impact on the respon-siveness of the decentralized architecture. Yet, even with a latency of 20 ms, the decentralized (resp. centralized) approach still reduces overcurrent duration by 77% (resp. 91%). C. Discussion
As mentioned previously, the heaters post-shedding rebound effect is not modeled here in the absence of related experi-mental data. However, it can be observed that the maximum shedding duration per heater is relatively short (60 s maximum, as shown in Table I) and the cumulative duration does not exceed 7 minutes per heater over the considered hour. Hence, the impact of not modeling the rebound effect in this study is reasonably small. Yet, an advantage of SimGrid-FMI is that we benefit from the versatility of FMI. Thus, to cap-ture the rebound effect, as we intend to do in fucap-ture work, we can use another dedicated FMI-compliant multi-physical simulator to build a thermal model of the households and to add it directly to our SimGrid-FMI co-simulation framework. Integrating such thermal models in SimGrid-FMI has already been realized in a previous work using OpenModelica [3].
SimGrid-FMI benefits from the simulation performance of the flow-based communication model of SimGrid. The drawback of SimGrid compared to packet-level simulators like NS-3 is that currently, its model is limited to TCP/IP and does not include wireless communications. Yet, if other communication protocols are required, we can use the ad-hoc
coupling between SimGrid and NS-3 that has been already developed [13]. Thanks to this coupling, SimGrid can use any NS-3 model instead of its own flow-based model. Thus, our framework is not limited to the flow-based model of SimGrid.
V. CONCLUSION
The worldwide increase in electricity consumption pushes traditional electrical distribution networks to their limits, while smart grids allow for a more flexible grid management, us-ing a pilotus-ing communication network. In this context, we proposed a co-simulation tool named SimGrid-FMI to jointly simulate electrical grids and their management communication network using PowerFactory on the electrical side (or any FMI-compliant power system simulator) and SimGrid on the communication side. This framework is open-source and available online and can be directly used by the smart grid community to obtain sound co-simulations [24].
Thanks to this framework, we studied the influence of the communication network QoS on the management of an electrical grid. This study is conducted through co-simulations of a representative use-case comprising an electrical grid with 55 homes and a star communication network between them. In this use-case, we observe the number of messages for, and the impact of the communication latency on two management strategies of the electrical grid: centralized and decentralized management. One of the main outcomes of the proposed case study consists in the quantification of the electric network performances degradation observed with a 20 ms latency between each home and the central point on the star communication network. In this case, the decentralized approach leads to an overcurrent duration 2.6 times higher than with the centralized approach. Observations based on other metrics relevant to the power system community, such as cumulative shedding duration per heater, etc. are also provided thanks to our framework.
This work constitutes a first step towards a comprehensive framework able to co-simulate the interactions between the electrical grid and its management communication network. The simple use-case taken here does not highlight the scala-bility and versatility of the proposed tool, this analysis will be included in future work. The current use-case focuses on the impact of network latency, but other important factors can be studied, such as packet delivery reliability. Our future work includes studying optimized smart grid energy management strategies with SimGrid-FMI, and evaluating the impact of wireless communication QoS on these strategies.
ACKNOWLEDGMENT
This project is funded through the “Programme des In-vestissements d’Avenir” operated by ADEME.
REFERENCES
[1] A. N. Albagli, D. M. Falc˜ao, and J. F. de Rezende, “Smart grid framework co-simulation using hla architecture,” Electric Power Systems Research, vol. 130, pp. 22 – 33, 2016.
[2] D. Bhor, K. Angappan, and K. M. Sivalingam, “Network and power-grid co-simulation framework for smart grid wide-area monitoring networks,” J. of Network and Computer Applications, vol. 59, pp. 274 – 284, 2016.
Time (pm)
6.30 6.00
5.30 5.45 6.15
Fig. 2: Evolution of the current in Line1 over time with the centralized implementation.
Fig. 3: Cumulative overcurrent duration vs. latency.
[3] B. Camus, A.-C. Orgerie, and M. Quinson, “Co-simulation of FMUs and Distributed Applications with SimGrid,” in SIGSIM PADS, 2018. [4] H. Casanova, A. Giersch, A. Legrand, M. Quinson, and F. Suter,
“Ver-satile, Scalable, and Accurate Simulation of Distributed Applications and Platforms,” Journal of Parallel and Distributed Computing, vol. 74, no. 10, pp. 2899–2917, 2014.
[5] F. Cremona et al., “Hybrid co-simulation: it’s about time,” Software & Systems Modeling, vol. 18, no. 3, pp. 1655–1679, 2019.
[6] Dassault Syst`emes, “Official website,” https://www.3ds.com/ products-services/catia/products/dymola/, Accessed March, 15 2019. [7] DIgSILENT, “Official website,” https://www.digsilent.de/en/
powerfactory.htm, Accessed March, 15 2019.
[8] FMI++ PowerFactor FMU export Utility, “Official website,” https: //sourceforge.net/projects/powerfactory-fmu/, Accessed July, 22 2019. [9] K. Fujiwara and H. Casanova, “Speed and Accuracy of Network
Simulation in the SimGrid Framework,” in International Conference on Performance Evaluation Methodologies and Tools (ValueTools), 2007. [10] M. Garau, E. Ghiani, G. Celli, F. Pilo, and S. Corti, “Co-simulation of
smart distribution network fault management and reconfiguration with lte communication,” Energies, vol. 11, no. 6, 2018.
[11] T. Godfrey et al., “Modeling Smart Grid Applications with Co-Simulation,” in IEEE SmartGridComm, 2010, pp. 291–296.
[12] C. Gomes, C. Thule, D. Broman, P. G. Larsen, and H. Vangheluwe, “Co-simulation: State of the art,” CoRR, vol. abs/1702.00686, 2017. [13] L. Guegan, B. L. Amersho, A.-C. Orgerie, and M. Quinson, “A
Large-Scale Wired Network Energy Model for Flow-Level Simulations,” in AINA, 2019, pp. 1047–1058.
[14] J. Guo, G. Hug, and O. Tonguz, “Impact of Communication Delay on Asynchronous Distributed Optimal Power Flow Using ADMM,” in IEEE SmartGridComm, 2017.
[15] T. R. Henderson, S. Roy, S. Floyd, and G. F. Riley, “NS-3 project goals,” in NS2 Workshop, 2006.
[16] Hua Lin, S. Sambamoorthy, S. Shukla, J. Thorp, and L. Mili, “Power system and communication network co-simulation for smart grid appli-cations,” in IEEE PES ISGT, 2011.
[17] IEEE PES AMPS DSAS Test Feeder Working Group, “European Low Voltage Test Feeder,” http://sites.ieee.org/pes-testfeeders/resources/, Ac-cessed March, 15 2019.
[18] International Energy Agency, “Global energy & co2 status re-port – the latest trends in energy and emissions in 2018,” https://webstore.iea.org/global-energy-co2-status-report-2018, 2019. [19] M. L´evesque, D. Q. Xu, G. Jo´os, and M. Maier, “Communications
and power distribution network co-simulation for multidisciplinary smart grid experimentations,” in Annual Simulation Symposium (ANSS), 2012. [20] V. Liberatore and A. Al-Hammouri, “Smart grid communication and
co-simulation,” in IEEE EnergyTech, 2011.
[21] MODELISAR Consortium and Modelica Association. (2014) Functional Mock-up Interface for Model Exchange and Co-Simulation – Version 2.0, July 25, 2014. Retrieved from https://www.fmi-standard.org. [22] T. S. Nouidui et al., “CyDER – an FMI-based co-simulation platform
for distributed energy resources,” J. of Build. Perf. Simul., vol. 12, no. 5, pp. 566–579, 2019.
[23] I. Ramezanipour et al., “Decision Error Probability in a Two-stage Communication Network for Smart Grids with Imperfect Links,” in IEEE SmartGridComm, 2017.
[24] SimGrid-FMI. https://framagit.org/simgrid/simgrid-FMI.
[25] C. Steinbrink et al., “CPES Testing with mosaik: Co-Simulation Plan-ning, Execution and Analysis,” Applied Sciences, vol. 9, no. 5, 2019. [26] A. Varga and R. Hornig, “An overview of the OMNeT++ simulation
environment,” in ICST, 2008, p. 60.
[27] J. Vaubourg et al., “Multi-agent multi-model simulation of smart grids in the MS4SG project,” in PAAMS, 2015.
[28] P. Velho, “Accurate and Fast Simulations of Large-Scale Distributed Computing Systems,” PhD Thesis, Universit´e Grenoble Alpes, 2011. [29] P. Velho, L. Schnorr, H. Casanova, and A. Legrand, “On the Validity
of Flow-level TCP Network Models for Grid and Cloud Simulations,” ACM Transactions on Modeling and Computer Simulation, vol. 23, no. 4, 2013.
[30] B. Vinot et al., “Congestion Avoidance in Low-Voltage Networks by using the Advanced Metering Infrastructure,” in ACM e-Energy, 2018. [31] H. Xu, J. Sun and C. Dent, “The Coordinated Voltage Control Meets